 Originally published in June 1, 2015 Commentary
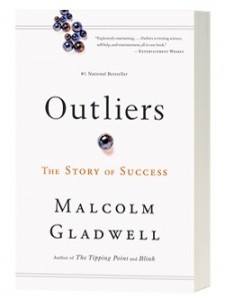
“At the extreme outer edge of what is statistically plausible” is how Malcom Gladwell defines an outlier in his amazing book, Outliers: The Story of Success (2008).
The MFO Rating System ranks funds based on risk adjusted return within their respective categories across various evaluation periods. The rankings are by quintile. Those in the top 20 percentile are assigned a 5, while those in the bottom 20 percentile are assigned a 1.
The percentile is not determined from simple rank ordering. For example, say there are 100 funds in the Large Growth category. The 20 funds with the highest risk adjusted return may not necessarily all be given a 5. That’s because our methodology assumes fund performance will be normally distributed across the category, which means terms like category mean and standard deviation are taken into account.
It’s similar to grading tests in school using a bell curve and, rightly or wrongly, is in deference to the random nature of returns. While not perfect, this method produces more satisfactory ranking results than the simple rank order method because it ensures, for example, that the bottom quintile funds (Return Group 1) have returns that are so many standard deviations below the mean or average returning funds (Return Group 3). Similarly, top quintile funds (Return Group 5) will have returns that are so many standard deviations above the mean.
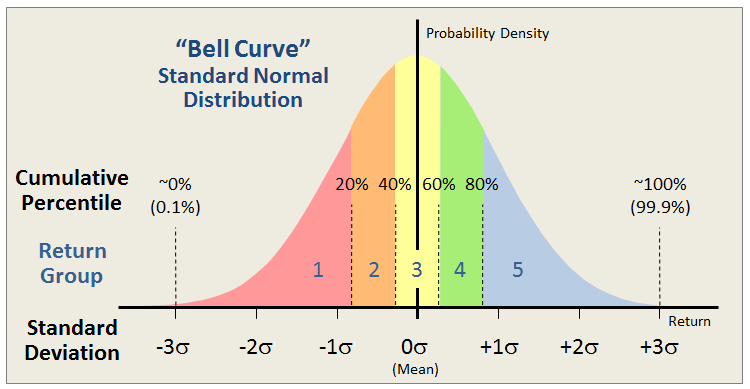
All said, there remain drawbacks. At times, returns can be anything but random or “normally” distributed, which was painfully observed when the hedge fund Long-Term Capital Management (LTCM) collapsed in 1998. LTCM used quant models with normal distributions that underestimated the potential for extreme under performance. Such distributions can be skewed negatively, creating a so-called “left tail” perhaps driven by a market liquidity crunch, which means that the probability of extreme under-performance is higher than depicted on the left edge of the bell curve above.
Then there are outliers. Funds that over- or under-perform several standard deviations away from the mean. Depending on the number of funds in the category being ranked, these outliers can meaningfully alter the mean and standard deviation values themselves. For example, if a category has only 10 funds and one is an outlier, the resulting rankings could have the outlier assigned Return Group 5 and all others relegated to Return Group 1.
The MFO methodology removes outliers, anointing them if you will to bottom or top quintile, then recalculates rankings of remaining funds. It keeps track of the outliers across the evaluation periods ranked. Below please find a list of positive outliers, or extreme over-performers, based on the latest MFO Ratings of some 8700 funds, month ending April 2015.
The list contains some amazing funds and warrants a couple observations:
- Time mitigates outliers, which seems to be a manifestation of reversion to the mean, so no outliers are observed presently for periods beyond 205 or so months, or about 17 years.
- Outliers rarely repeat across different time frames, sad to say but certainly not unexpected as observed in In Search of Persistence.
- Outliers typically protect against drawdown, as evidenced by low Bear Decile score and Great Owl designations (highlighted in dark blue – Great Owls are assigned to funds that have earned top performance rank based on Martin for all evaluation periods 3 years or longer).
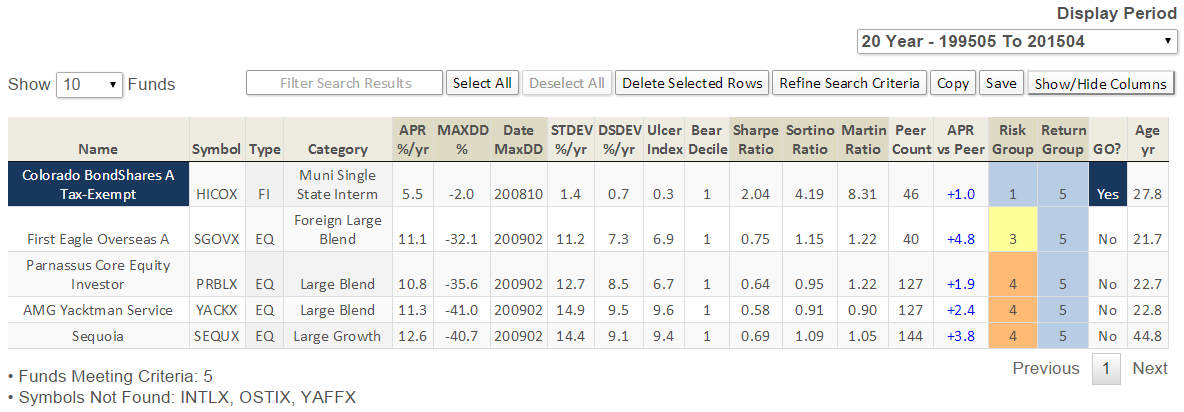
The following outliers have delivered extreme over-performance for periods 10 years and more (the tables depict 20 year or life metrics, as applicable):
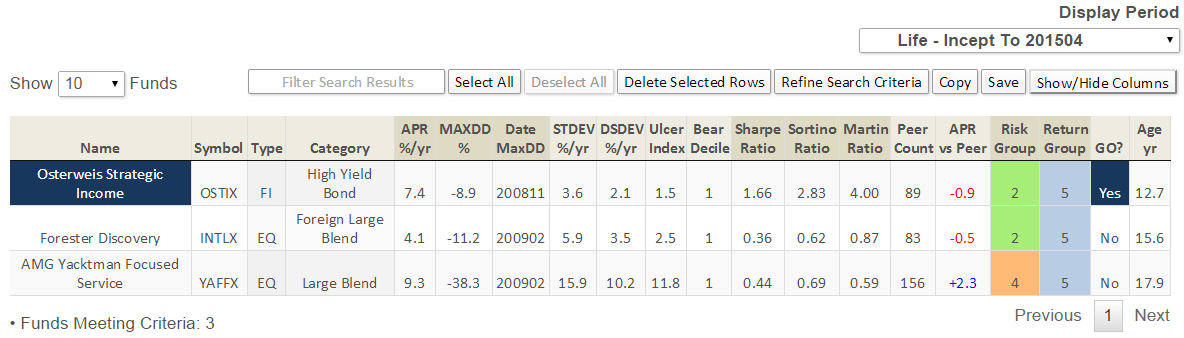
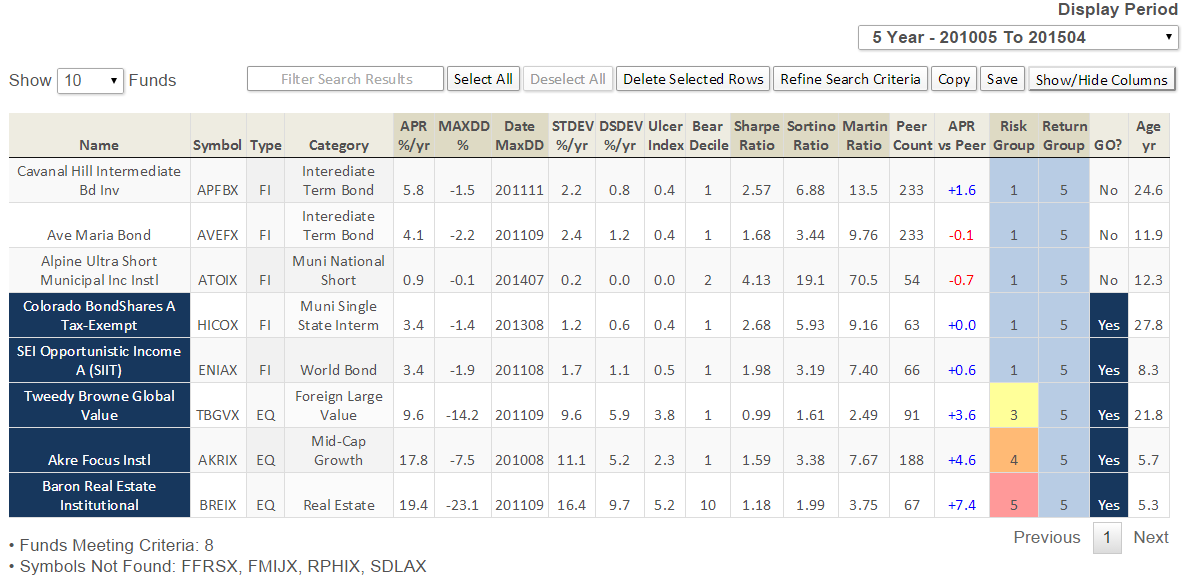
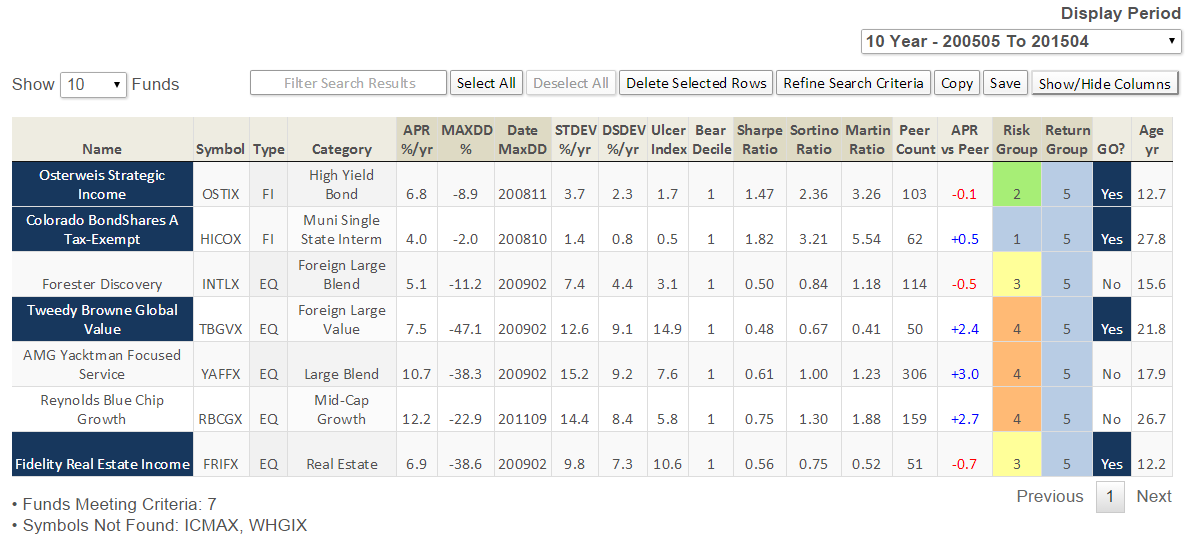
Here are the outliers for periods 5 years and more (the tables depict 10 year or life metrics, as applicable):
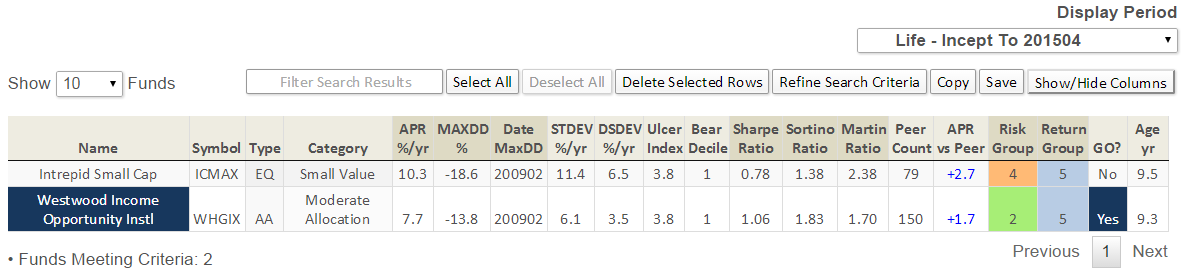
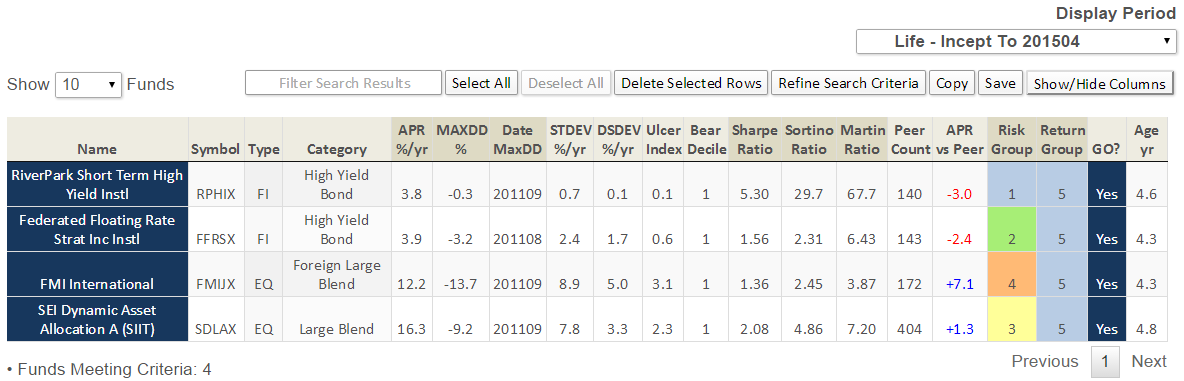
Finally, the outliers for periods 3 years and more (the tables depict 5 year or life metrics, as applicable):