


Objective and strategy
The Opportunity Fund seeks capital appreciation. They apply a value-oriented discipline to micro-, small- and mid-cap stocks in the US and other developed markets. In general, the managers look for companies with long, consistent, predictable track records of free cash flow yield generation and healthy organic growth. They identify undervalued securities by starting with balance sheet strength but they also consider qualitative factors (e.g., quality of the management) and the presence of a catalyst (e.g., sale of underperforming assets).
The Investment Manager believes that risk can be managed through a careful selection process that focuses on the relationship between the actual market price of a security and the intrinsic value of which the security represents an interest.
Adviser
Prospector Partners, which is headquartered in Guilford, CT, was founded in 1997 by John D. Gillespie. Prospector defines itself as a value investor with a distinctive emphasis on investing from a credit perspective. They manage institutional private funds and separate accounts, along with the Prospector funds. Prospector manages about $730 million of which $145 million is in the Prospector funds.
Managers
John D. Gillespie, Kevin O’Brien, and Jason Kish. Mr. Gillespie is one of Prospector Funds founders and its president. He has managed the fund since its inception. From 1986-1997, Mr. Gillespie was with T. Rowe Price where, among other things, he managed the Growth Stock Fund and New Age Media Fund (originally a closed-end fund that morphed into Media & Telecommunications, now called Communications & Technology Fund). He’s also serves on the Board of Trustees for Bates College, an alma mater. Mr. O’Brien has been a portfolio manager at Prospector since 2003 and has helped manage this fund since inception. Before joining Prospector he spent seven years with Neuberger Berman, rising from analyst to managing director, and several years with White Mountains Advisors. He earned the Chartered Financial Analyst designation in 1995. Mr. Kish joined the fund in 2013, but has been with the firm for 20 years. He’s a graduate of Providence College, received his Certified Public Accountant designation in 2000 and his Chartered Financial Analyst designation in 2004. The CFA designation is a significant predictor of manager performance. The team also manages Prospector Capital Appreciation (PCAFX) and is supported by four analysts.
Strategy capacity and closure
There’s no hard and fast number. The fund holds substantial positions in micro-, small- and mid-cap stocks; assets need to remain small enough that the fund can both benefit from a micro-cap stock and exit from the stock without disrupting markets. Under current (May 2018) conditions, Prospector estimates they could manage “a billion plus.” Since they’re “more interested in our reputation than in asset gathering,” they’ll close the strategy when conditions warrant.
Management’s stake in the fund
Messrs. Gillespie and O’Brien each have invested over $1 million in the fund, Mr. Kish has more than $300,000. In total Mr. Gillespie, owns 12.11% of the Capital Appreciation Fund.
Every member of the Board of Directors has invested in both Prospector funds. Despite receiving modest compensation, three of the four independent members report investments in the highest SEC reporting band: $100,000+. The four independent director has between $10,000 – 50,000 in each fund; given his age (78) and the funds’ equity exposure, that strikes us as a very substantial vote of confidence. While many people understand the importance of “skin in the game” by managers, fewer know that research gives Board ownership substantial weight; funds with high Board ownership tend to take fewer outsized risks and tend to produce steadier returns than other funds. Prospector’s level of ownership is in the industry’s top tier.
Opening date
September 28, 2007
Minimum investment
$10,000
Expense ratio
1.26%, after waivers, on assets of $219 million.
Comments
All funds lose sometime. I love funds that lose at the right time.
The table below shows the absolute and relative returns of Prospector Opportunity in each of the past 10 years. Here’s one reading: Opportunity has trailed its peers half of the time, which suggests that it’s merely average. But looking carefully at when it trailed them is much more important than simply noting that it trailed them.
| 08 | 09 | 10 | 11 | 12 | 13 | 14 | 15 | 16 | 17 | |
| Absolute | -19% | 26 | 17 | -0.2 | 15 | 27 | 7 | 1 | 21 | 10 |
| Relative rank | 2%ile | 86 | 88 | 17 | 65 | 93 | 72 | 5 | 26 | 81 |
Look at the “bad” years first. So Prospector trailed more than 80% of its peers in four of the last ten years, and it returned an average of 20% in each of those years. Prospector beat more than 80% of its peers three times (2008, 2011 and 2015) and it returned an average of -6% in each of those years.
So the bad years were good, and the good years were bad? What’s up with that?
What’s up is that Prospector specializes in not losing its investors’ money. That means surrendering part of the gains that might make when the market is “frothy” in exchange for protecting the gain they did make when the market turns ugly. That occurs because, they note, “Prospector approaches value investing from a credit perspective.” That is, they look at many of the same factors that a bond investor might, starting with the balance sheet because it’s “harder [for management] to manipulate” than measures like “earnings” are. Rather than starting by asking “how much could we make if everything goes right,” they start with “how much could we lose if everything goes wrong?” That accounts for their more muted returns in frothy markets where, almost by definition, lots could go wrong.
Peter Perugini, Prospector’s CFO, argues that the key measure we need to look at is upside/downside capture. “It’s the old saying, rule #1 is ‘don’t lose money’ and rule #2 is ‘don’t forget rule #1.’ At Prospector, the plan is to string together a series of positive returns, sometimes modest, and at the same time doing our best to avoid large losses.”
Despite that caution, they are dedicated stock investors because stocks – carefully chosen – still outperform bonds in the long-run. Their 2017 Annual Report admits
In our estimation equity valuations remain at historically extended levels, in the tenth decile on trailing operating earnings. We feel we are in the later stages of a bull market, although nothing is certain. Equities look most reasonable when comparing earnings yield to Treasury and even corporate bond yields. In any case, the values inherent in your portfolio should attract acquirers and other investors over time. Meanwhile, we believe equities are a superior asset allocation alternative to bonds over the longer term.
That philosophy reflects an approach similar to T. Rowe Price’s, and the results for Prospector have been outstanding. MFO does not measure success in terms of returns, but only in terms of risk-adjusted returns. Because Prospector invests in stocks of all market caps, and stocks that are characterized as both “growth” and “value,” it gets classified as a mid-cap blend fund (Morningstar) or a mid-cap core fund (Lipper). While not all mid-cap core/blend funds have a go-anywhere portfolio, many such as Prospector do, which makes them particular apt core holdings.
Using the MFO Premium screener, we searched for the mid-cap core funds which have sustained the most attractive risk-return profile over the course of the entire market cycle (roughly October 2007 – now). Here are the top ten funds among the 86 mid-cap cores operating since October 2007. Here we’ve sorted it by Sharpe ratio, the most widely followed measure of risk-adjusted performance. Prospector is ranked #1 of 86 mid-cap core funds based on Sharpe ratio.
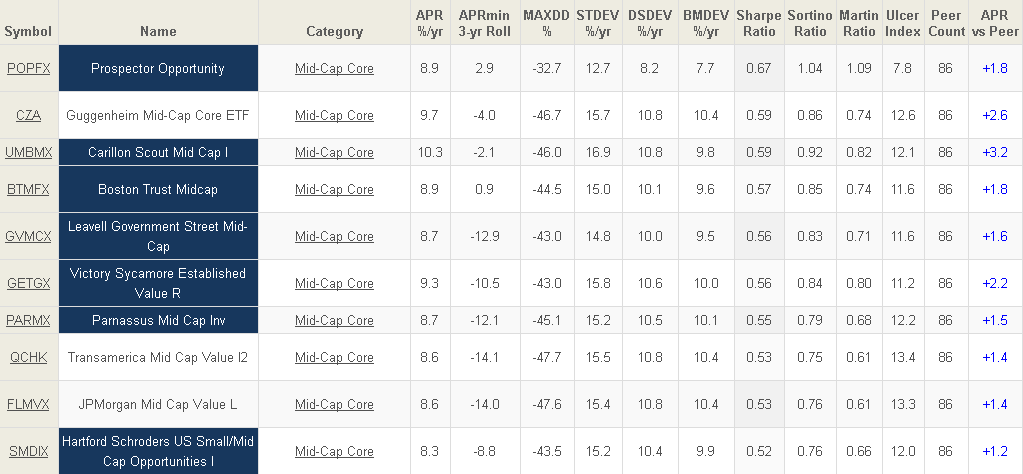
How do you read this table? The funds are dark blue are designated by MFO as “Great Owl” funds; they have delivered top quintile risk-adjusted returns, based on Martin Ratio, in its category for evaluation periods of 3, 5, 10, and 20 years, as applicable. The requirement to excel in every trailing period is our attempt to measure consistency as well as excellence.
Prospector has returned 8.9% annually, 1.8% greater than its average peer.
Prospector is ranked #1 out of 86 funds based on its minimum three-year rolling return; this metric asks, if you held a fund for 36 months, what’s the worst case for returns? In Prospector’s case, the worst 36 month period saw annualized returns of 2.9%. Some of its larger, more famous peers posted losses of 26.6% using the same measure. Only one other fund was in the black for a rolling three-year average; 84 of 86 funds in the group would have been underwater.
Prospector is ranked #1 funds based on its maximum drawdown; which measures the magnitude of a fund’s worst decline in the period.
Prospector is ranked #1 based on standard deviation.
Prospector is ranked #1 based on downside deviation, which looks at the volatility of a fund’s downward movements – which investors find important – whereas standard deviation penalizes a fund for both upward spikes and downward ones.
Prospector is ranked #1 based on bear market deviation, which looks at how a fund does in months with substantial stock market declines.
Prospector is ranked #1 based on Sortino ratio, a more-conservative variation of the Sharpe ratio.
Prospector is ranked #1 based on Martin ratio, our most-conservative risk-return metric.
Prospector is ranked #1 based on Ulcer Index, our most whimsically named metric, which factors together how far a fund drops and how long it stays down.
Even if we triple the number of funds in the comparison group by adding Lipper’s multi-cap core group, Prospector is ranked #1, 2 or 3 in virtually every measure of risk-adjusted performance: three-year rolling average, maximum drawdown, downside deviation, bear market deviation, Sharpe, Sortino and Martin ratios, and Ulcer Index.
Bottom Line
Prospector is #1. Will it ever be so? No, of course not. They trailed their peers in 2009-10 and again in 2012-14, and they’ll doubtless do so again. But they rewarded their investors handsomely in both of the “laggard” periods, while ferociously protecting them when (in 2008, for example) markets were at their worst. Prospector is not designed for eye-popping returns, and doesn’t deliver them. It’s designed to capture as much of the market’s upside as it reasonably can, without compromising its ability to preserve capital when things turn. If you are concerned that such a turn lies in our future, you would be well-served to learn about Prospector now.