


Good news: The US stock indexes are at, or quite near, all-time highs!
Bad news: The US stock indexes are at, or quite near, all-time highs.
Good news: the 3rd quarter of 2018 had the highest returns over any quarter in over five years!
Bad news: the 3rd quarter of 2018 had the highest returns over any quarter in over five years.
Good news: the advance in equities has left almost no one behind!
Bad news: the advance in equities has left almost no one behind.
It’s the eternal story of the market: the seven fat years are inevitably followed by the seven lean years. That’s not random. There’s a rational economical linkage at work: with a steadily but not spectacularly growing economy, with steadily but not spectacularly growing earnings, with steadily but not spectacularly growing demand, you can project your likely returns over the next five or ten years. Any single year or two might see a spectacular crash or a spectacular price spike, but over time the rule never changes: the more you make now, the less you’ll make later.
We’ve been making a lot: the Dow Jones Industrials climbed 9.5% in the third quarter while the S&P 500 rose 7.7%. Over the past decade, the Dow and S&P have been returning 12% per year – and that includes the dramatic losses in late 2008 and early 2009.
The “real” economy, meanwhile, has been clocking in at 2-3% a year.
That combination leaves us with a rather expensive stock market. The folks at the Leuthold Group provided the following snippets in September 2018:
Stock market bulls like to look at the market’s “forward” valuation; that is, they want to imagine what companies might earn next year and use that to assess the market’s valuation. Based on those numbers, the market seems only “reasonably expensive.” Leuthold argues that forward p/e’s are simply a circular fantasy: “the forward P/E multiple is only ‘cheaper’ than it was during the dot-com era—between 1998 and 2001—hardly a rousing endorsement! Indeed, excluding the extreme ending of the dot-com era, the current forward P/E multiple is one of the highest valuations since 1990 …
Finally, the central problem with the forward P/E multiple is that it is based on “investor sentiment,” as this measure depends on future consensus earnings per share estimates. That is, it reflects emotions associated with collective thought. Rather than an objective valuation assessment, it simply reinforces the consensus view. If investor sentiment is bullish (typically because the stock market has been rising), future earnings expectations rise, keeping the market cheap.”
By less sentimental estimates, the market is substantially overpriced. If you look at actual earnings, which can be calculated in different ways, we’re near the highest valuations in history.
… the valuation of the U.S. stock market based on trailing earnings is extremely high compared to historic norms. The market cap to corporate profits ratio is now at the 96.6 percentile of its history since 1951, the CAPE P/E multiple is at the 95.2 percentile since 1950, and the trailing S&P 500 P/E multiple is at the 85.9 percentile since 1950!
Stocks are at historic highs when you compare their prices to those of bonds. Leuthold again: “relative to bonds, the contemporary bull market has carried stocks to an all-time record!”
Likewise, homes: “The U.S. stock market is also at a record, today, relative to home prices.”
Likewise, incomes: the average American, working for the average hour wage, would have to work for “105.5 hours to buy the S&P 500 index. By comparison, it only took 89 hours at the top of the dot-com market, and only 36 hours when this bull market began in 2009!”
Likewise commodities, the GDP, foreign assets and on and on.
The traditional response has been, “don’t worry, there’s always a bull market somewhere!” That is, some stocks will be historically pricey but others will be historically cheap. When the market darlings crash, investors plan to take refuge in the market’s laggards. That worked in 2000: tech and telecom cratered while industrials surged on. By Leuthold’s calculation, the game has changed: the current bull market has not left any real pockets of value as all sectors powered ahead.
The median trailing P/E multiple among all U.S. stocks is at a post-war high of 21.1x which is more than 50% higher than it was in 2000 (i.e., 21.1x in June 2018 versus 14.6x in June 2000)! Today, the overall stock market is very highly priced, but the median U.S. stock is “uniquely” highly priced. That is, the “broadness” of record valuation risk today is unprecedented, at least during the post-war era!
Martha and the Vandellas summarized our position this way:
Nowhere to run to, baby, nowhere to hide
Got nowhere to run to, baby, nowhere to hide
It’s not love, I’m a running from
It’s the heartbreak I know will come…
Many confidently disagree. Having scaled the infamous “wall of worry,” they’re within about 30 seconds of endorsing Irving Fisher’s conclusion that “stock prices have reached what looks like a permanently high plateau.” (That’s a conclusion he made on October 16, 1929.) At the end of September, one “lead research analyst” surveyed the case for caution and dismissed it: “This all sounds scary, but the stock market doesn’t care—it’s been too busy surging to new highs!”
—
So, what might we reasonably expect from this historically rich market over the medium term, say the next 5 – 10 years?
The world’s largest investment managers estimate that a balanced portfolio will be zero, plus or minus three percent, before inflation and taxes, with substantial volatility.
Over the past ten to fifteen years, the US market has returned 10-11% annually with 14-15% volatility. That’s measured by the performance of Vanguard Total Stock Market Index Fund (VTSMX). Vanguard estimates that over the next 10 years, stocks will return around 4% with 17% volatility. Roughly speaking, expect 60% less gain but 20% more pain. Their bond market projections are 2.5% gain and 5.0% volatility. Over the past five years, Vanguard Total Bond Market Fund (VBMFX) returned 2% with 2.8% volatility so you might expect a small rise in returns and a near doubling of volatility. (Vanguard economic and market outlook for 2018: Rising risks to the status quo, 12/2017). That implies a balanced portfolio will return 3.4% annually, before accounting for the effects of inflation, fees and taxes.
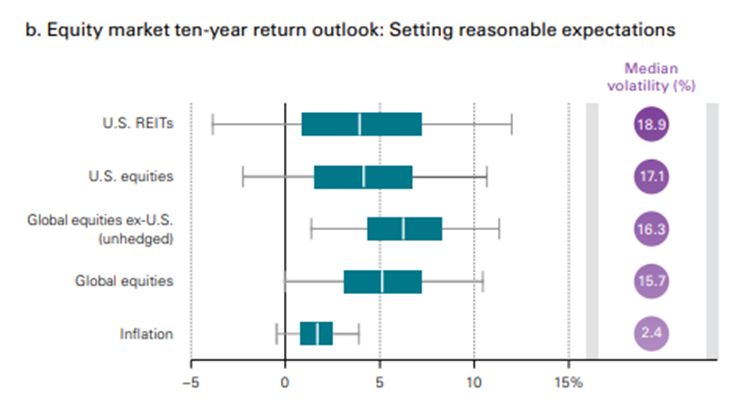
BlackRock reaches a similar conclusion: 5% US equity returns with 17% volatility. A 60/40 portfolio would, by their calculation, sit at 4% returns before inflation with a 12% standard deviation.
Sadly, Vanguard and BlackRock represent the optimists. Institutional investor Grantham, Mayo, van Otterloo (GMO) uses a simple reversion-to-the-mean method to project negative 4.4% real (that is, after-inflation) returns from US stocks and negative 0.3% real returns from US bonds over the next seven years. In that case, a 60/40 portfolio would lose 2.75% annually
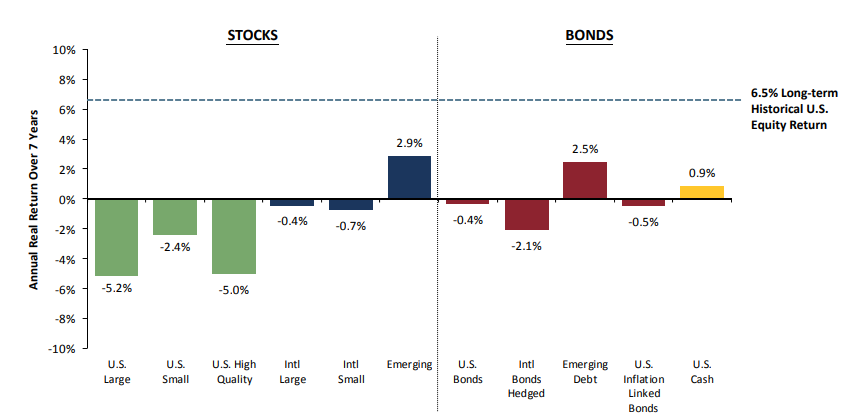
(7 Year Asset Class Returns, 8/30/2018). The British institutional investor Schroders, with rather more than a half trillion dollars in global assets, estimates 1.6% returns on US stocks over the next seven years and 0.3% returns on US bonds (Seven year asset class forecast returns, 2017 update). That comes out to 0.75% annually, before fees and taxes. Research Affiliates estimates 0.6% annually for a 60/40 portfolio over the next decade.
The cockeyed optimists of the bunch, Callan Associates, which does investment consulting for institutional clients, projects 10-year returns of 7% of US stocks and 3% for US bonds, their lowest projection since 1988. That would translate to pre-inflation returns of 5.4%.
Here’s the tally for your portfolio over the next decade: Vanguard: 3.4%. BlackRock: 4%. Schroders: 0.75%. Research Affiliates: 0.6%. GMO: negative 2.75%.
So returns for a core 60/40 portfolio in the range of negative 3% to positive 3% per year are plausible, though unpalatable.
—
Can you do better?
Maybe. All of the estimates above assume that your portfolio’s returns are driven by the overall returns in the stock market. Some managers believe that they can decouple your returns from the market’s. Fund raters tend to place these funds into categories such as market neutral, event arbitrage or absolute return. Most of these managers realize that while an individual stock’s price is largely driven by broad market movements, events unrelated to the broad movement of the stock market also can affect a stock’s price.
If the market rises, some stocks will rise more. If the market falls, some stocks will fall less. No surprise but also no comfort: if the market drops 40% and your stock drops only 35%, you’re still screwed. The goal would be to somehow neutralize the effects of the market’s overall movement, so that you just captured your 5% gain instead of capture the market’s 40% fall and your 5% gain. Some strategies attempt to do precisely that.
One common method is called pair trading: identify one stock that you believe is worth, say, 5% more than another similar stock. (Ford might be worth 5% more than GM.) Invest long in the valuable stock, then short the value-less one. If the market rises, your hope is that the good stock will rise by 5% more than bad stock will. The losses on your short position (shorts fall when markets rise) will offset all but 5% of your long position’s rise, but you still get a 5% profit. On the other side, you’re also betting that the bad stock will fall 5% more than the good stock will fall if the market tumbles. The gains on your short position would offset the overall decline in the market, leaving you again with a 5% profit.
There are two problems with these strategies:
- People hate them when the market is rising, since you’re limiting yourself to small gains rather than riding the bull.
- Most managers suck at implementing them. They charge too much, return too little, and often cheat by being market-positive rather than market-neutral. That is, they have more long positions than short ones in hopes of riding the bull … but just a bit, they promise.
If the market is indeed on the verge of a sustained period of low returns and high risk, it would be useful to identify now the managers who might help you and to weed out the poseurs. With the help of the screeners at MFO Premium, we looked for funds that might serve you. Here are the criteria:
- They should, over the past five years, have maintained a market neutral position. That is, their returns should be driven by stock-picking and not by the market’s exuberance. To do that, we looked for funds with a stock market correlation (R-squared) of under 5 (on a scale of 0-100).
- They should, over the past five years, have returned 4% or more. That is, their stock-picking abilities should allow them to exceed the likely returns available for the next 5-10 years.
We searched in three Lipper fund categories: absolute return, market neutral and event-driven. We’d originally looked at several other categories, including long/short, enhanced equity, and tactical allocation, but both the correlation to the stock market and volatility were consistently high. No salvation there.
We started with 71 funds, then dumped any fund with a correlation over 10. That included some famous entrants: Gateway, Eaton Vance, Goldman Sachs, Calamos and Gotham all had funds with correlations of 75 and up.
25 funds remained, then we dumped any fund that hadn’t made at least 4% per year. Just four remained.
| Name | Lipper Category | APR/yr | MaxDD | Std Dev | R2 vs SP500 |
| Cognios Market Neutral Large Cap COGIX | Alternative Equity Market Neutral | 5.7% | -10% | 7.2% | 0.05 |
| Columbia Absolute Return Currency & Income RARAX | Absolute Return | 5 | -13 | 10.9 | 0 |
| Invesco Macro Allocation Strategy GMSHX | Absolute Return | 4.5 | -7.8 | 6 | 0.07 |
| PIMCO Mortgage Opportunities and Bond PMZIX | Absolute Return | 4.4 | -0.8 | 1.5 | 0.01 |
Investors anxious for slightly higher returns who are willing to place more of those returns at risk by increasing their market correlation can add a few options.
| Name | Lipper Category | APR/yr | MaxDD | Std Dev | R2 vs SP500 |
| BlackRock Event Driven Equity BILPX | Alternative Event Driven | 7.7 | -5.9 | 7 | 0.36 |
| AmericaFirst Tactical Alpha ABRFX | Absolute Return | 6.9 | -12.4 | 9.7 | 0.38 |
| ATAC Rotation ATACX | Absolute Return | 6.2 | -18.8 | 14.9 | 0.13 |
One younger fund, Balter Invenomic (BIVIX), would qualify except for its short track record. One reason to consider the fund, in addition to its performance, is that its manager Ali Motamed also brings a stint as co-manager of Boston Partners Long/Short Equity (BPLEX). Balter has substantially outperformed Boston Partners since inception, with a negligible correlation to the market.
| Name | Lipper Category | APR/yr | MaxDD | Std Dev | R2 vs SP500 |
| Balter Invenomic BIVIX | Alternative Long Short Equity | 6.5 | -4.3 | 6.3 | 0.10 |
Bottom line: you do have options. The simplest option is to invest with managers who hold cash. GMO anticipates that the real return on cash alone will far outstrip both US stocks and bonds in the years ago. We’ve repeated argued that “dry powder” serves you well. Our most recent review of high cash – solid return fund was April’s 15/15 funds story. That is, funds that held at least 15% cash and yet made at least 15% returns in 2017.
The other option, laid out here, is to consider funds that maintain a near-zero correlation to the stock market but have a record of returns higher than what we think the market will bring in the years ahead. These strategies tend to be complicated, so you need to spend some time learning  about what your managers actually do so that you have an understanding of the jolts that will come along. If you read their shareholders communications and think “WTF?”, then you should look elsewhere. Heck, if you search for their shareholder communications and can barely fund anything, I’d conclude “WTF” and recommend that you look elsewhere. And they do tend to be expensive, so don’t overcommit.
We’ve profiled Cognios Market Neutral Large Cap, and have been impressed with their consistent focus and discipline.
As always, readers with access to MFO Premium (free for a year when you make a $100 tax-deductible contribution to support MFO) can easily run these screens – or craft their own – in order to have their safe space in a market that offers nowhere to run to, nowhere to hide!