


Wow! What a year it has been so far! Coronavirus is at the top of the list. For me personally, there was a diagnosis, uncertainty, denial, surgery, and then recovery. After recovery, I took an assignment involving significant travel with less time to spend researching and investing for a couple of months followed by lots of free time. These two life events did not impact how I invest as much as the last rule, to “Develop a Simple Investment Process Based on Rules and Guidelines”. First, I wanted portfolios that were stable enough that I would be comfortable holding them unattended for months at a time during a bear market. For this reason, I created three relatively simple model portfolios that I follow with different accounts. Second, I began researching managed portfolios and accounts at Charles Schwab, Fidelity, and Vanguard, in case my wife needs to manage our investments. I put a small account into a Charles Schwab Intelligent Portfolio (Robo-Adviser) to see how well it does.
I first got the idea of writing the rules of investing last November, but most of the rules that I found were about trading and market timing. I wanted rules that were more applicable to the average individual investor. Here are a few of my favorite rules of investing,some of which are provided by Lance Roberts in Market & Investing Wisdoms For 2020.
-
- “In my view, the greatest way to optimize the positioning of a portfolio at a given point in time is through deciding what balance it should strike between aggressiveness and defensiveness. And I believe the aggressiveness/defensiveness balance should be adjusted over time in response to changes in the state of the investment environment and where a number of elements stand in their cycles.” – Howard Marks
- …the investor should never have less than 25% or more than 75% of his funds in common stocks. – Benjamin Graham
- Always insist on a margin of safety – James Montier
- Be fearful when others are greedy and greedy when others are fearful. – Warren Buffet
- Don’t trust your own opinion and back your judgment until the action of the market itself confirms your opinion. – Jesse Livermore
- The money lost by speculation alone is small compared with the gigantic sums lost by so-called investors who have let their investments ride. – Jesse Livermore
- Always keep a good part of your capital in a cash reserve. Never invest all your funds. – Bernard Baruch
My Simple Process
I use an investment model to estimate how much I should have invested in stocks and bonds that are consistent with the rules of the famous investors above. The point is to determine whether one should be aggressive or defensive. With the uncertainties surrounding COVID-19 and a global slowdown, I choose to be more defensive. To select the funds, I create a single value to rank all funds based on Return (Martin Ratio, Sortino Ratio, Period Return, MFO Rank), Risk (Ulcer Index, MFO Risk, average down cycle performance), Yield, Quality (Family Rating, Expenses, Age, Composite MFO, % Junk Bonds, Bond Rating), Valuation (Discount, Price to Cash, Sales, and Earnings) and Momentum (3- and 10-month trends, 3-month performance, and Fund Flows).
I use a nine bucket approach based on diversification and safety. I hold at least one fund in at least seven buckets. These are Buckets #1 – #4 for increasing Risk, Inflation, Global bonds, Global Investments, and Defensive.
I am going to use the Fidelity Moderate Model Portfolio as an example. The system is automated and takes about an hour per month.
Fidelity Moderate Portfolio
There are 13 funds in the Fidelity Moderate Portfolio and the overall rank and its components are shown in Chart #1. The best rank is 100 and the worst is 0. The funds shaded green are doing well. The yellow funds are okay. The funds shaded red are candidates to be replaced.
Chart # 1: Fidelity Moderate Portfolio Factor Rank
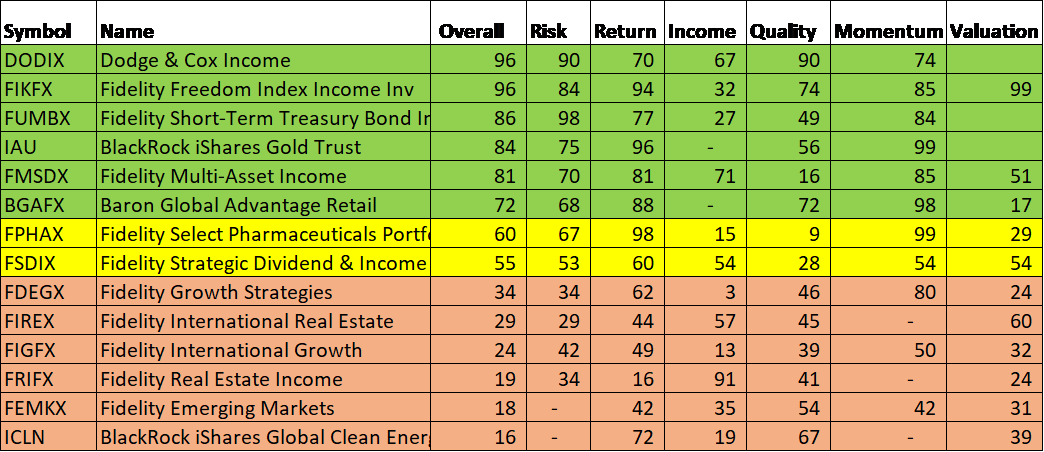
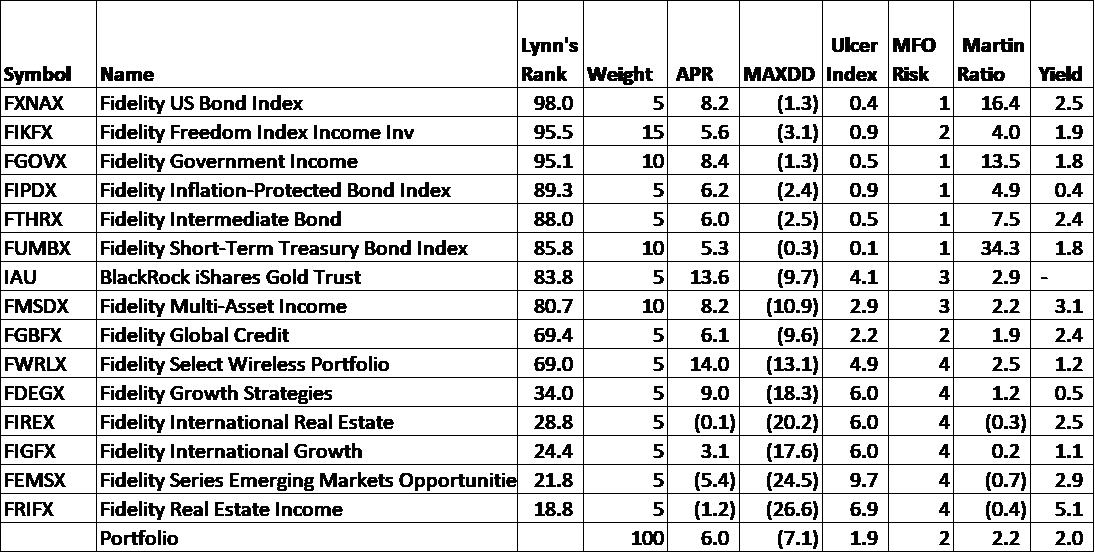
Chart #2 is created from the Mutual Fund Observer Portfolio Tool showing the same funds from for the past two years. The portfolio has an average annual return of 7.1% with a maximum drawdown of 8.9%. It is classified by MFO as Conservative (MFO Risk = 2). Weight is the percent of the portfolio allocated to a fund. Most of the red funds had a maximum drawdown of 18 to 27 percent over the past two years with real estate and emerging markets performing the worst. These are candidates for replacement. I hold many of these for purposes of diversification so temporary short term performance is not a reason alone to make a trade.
Chart # 2: Fidelity Moderate Portfolio Metrics – 2 years
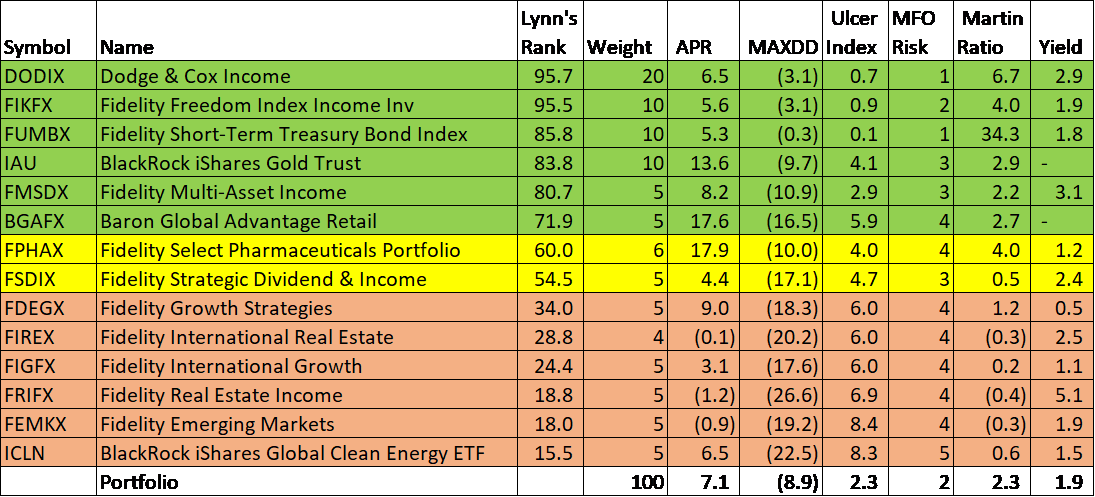
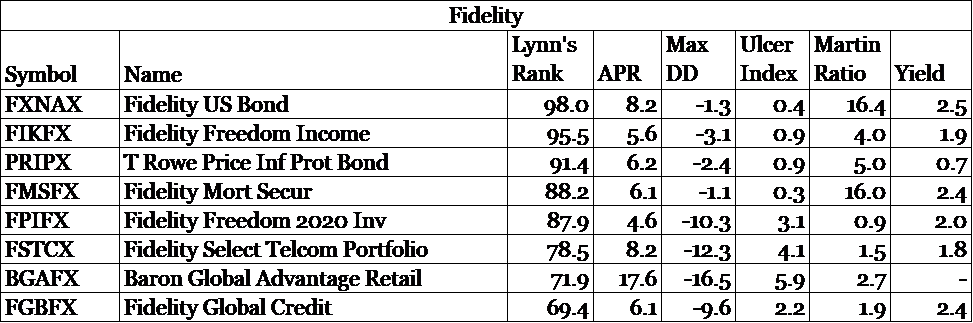
Chart #3 shows the top-ranked Fidelity Mutual Funds by selecting one fund for each of the nine Buckets. I am overweight in bonds and not interested in exchanging one bond fund for another. The Fidelity Select Telecommunication Portfolio (FSTCX) is interesting, but I already own a Telecomm fund. I also already own the Baron Global Advantage Retail Portfolio Fund (BGAFX).
Chart # 3: Top Ranked Fidelity Funds Per Bucket Classification
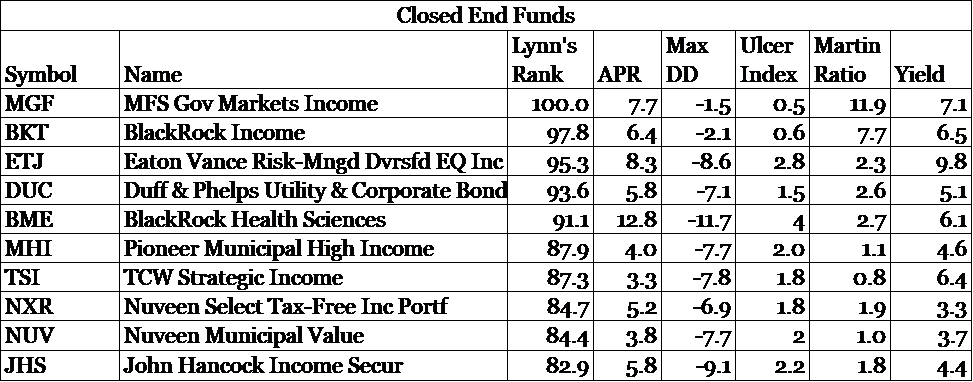
I may also include Closed End Funds in the Fidelity Moderate Portfolio. Chart #4 is interesting. Each of the funds has a low Ulcer Index (risk) and a respectable Martin Ratio (risk-adjusted return). These warrant more research when I am not traveling.
Chart # 4: Top Ranked Closed End Funds Per Bucket Classification
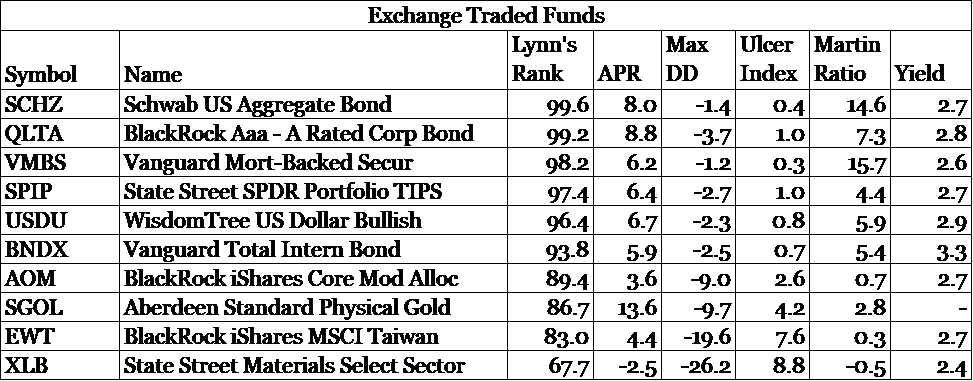
Of the Top Ranked Exchange Rated Funds, the Blackrock Aaa – A Rated Corporate Bond Fund (QLTA) is the only one of interest to me. I maintain a small amount of gold in each of my portfolios which has reduced volatility and increased returns.
Chart # 5: Top Ranked Exchange Traded Funds Per Bucket Classification
Fidelity Conservative Portfolio
The Fidelity Conservative Portfolio that I also follow is likewise classified as Conservative (MFO Risk = 2) but has a slightly lower Ulcer Index than the Fidelity Moderate Portfolio. The portfolio has an average annual return of 6.0% with a maximum drawdown of 7.1%.
Chart # 6: Fidelity Conservative Portfolio Metrics – 2 Years
Vanguard Conservative Portfolio
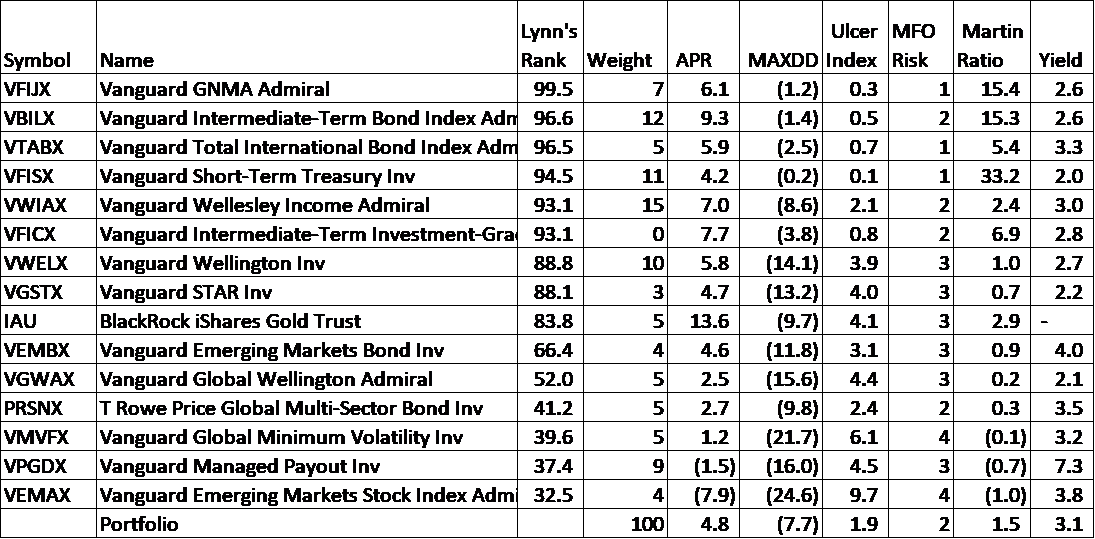
The Vanguard Conservative Portfolio had a lower return of 4.8% for the past two years, a maximum drawdown of 7.7%. Its yield is 3.1%.
Chart # 7: Vanguard Conservative Portfolio Metrics
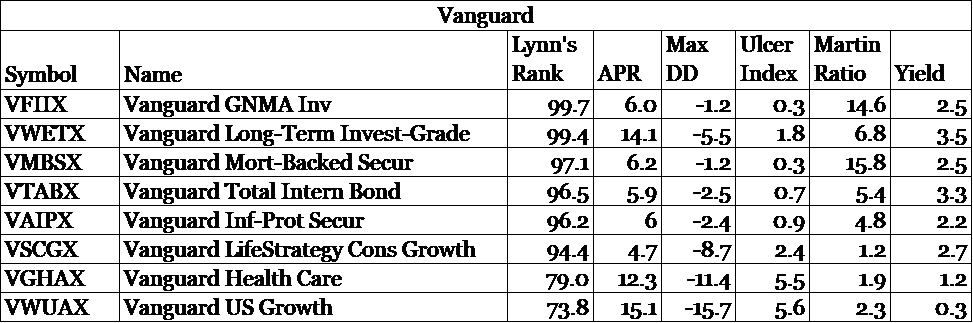
The Top Ranked Vanguard Funds with one fund per bucket classification are shown in Chart #8. The Vanguard Health Care (VGHAX), LifeStrategy Conservative Growth (VSCGX), and US Growth (VWUAX) are potential replacements for the T. Rowe Price Global Multi-Sector Bond Fund (PRSNX). The rest, I want to keep for diversification.
Chart # 8: Top Ranked Vanguard Funds Per Bucket Classification
Top Charles Schwab Funds
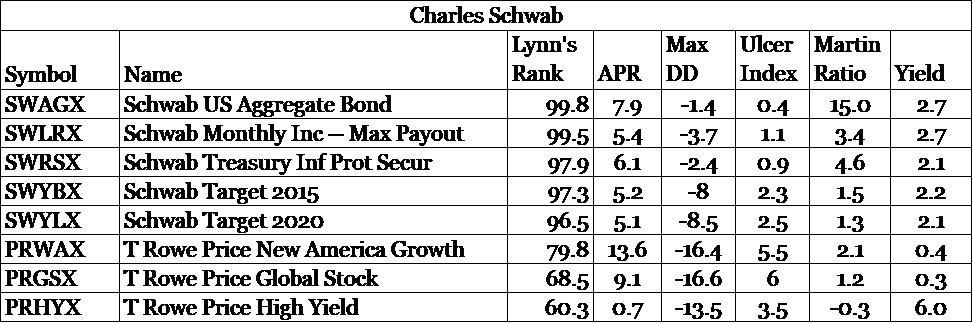
Chart #9 contains the Top Ranked Funds available at Charles Schwab. The T. Rowe Price New America Growth (PRWAX) and T. Rowe Price Global Stock Fund (PRGSX) are interesting stock funds and deserve additional research.
Chart # 9: Top Ranked Charles Schwab Funds Per Bucket Classification
Closing
I appreciate the services that the good people at Mutual Fund Observer provide. They have reduced the amount of time that I spent doing research and provided a quantitative method for investing. I have spent too many hours during my life looking at charts and tables trying to determine trends. The method that I use now quantifies those trends.
Disclaimer
I am not an economist nor an investment professional. I became interested in economic forecasting and modeling in 2007 when a mortgage loan officer told me that there was a huge financial crisis coming. There were signs of financial stress if you knew where to look. I have read dozens of books on business cycles since then. Discovering the rich database at the St. Louis Federal Reserve (FRED) provides most of the data to create an Investment Model. The tools at Mutual Fund Observer provide the means for implementing and validating the Investment Model.