By Charles Lynn Bolin
I turned 66 last week and bought a retirement home in Colorado last month. By most measures, I am prepared for retirement with pensions, social security, and savings. I continue to work for several reasons including the uncertainties of markets facing seismic shifts. In the 50 years since I was in high school, so much has changed, both good and bad. These secular trends that have occurred in my life have significance for young and old investors. As Bear Bryant said, “Offense sells tickets, but defense wins championships.”
In Section #1 I look at seven long term trends that will impact stock market prices over the coming decade(s), in Section #2 I summarize Vanguard’s Long-Term View of Investments in the coming decade(s), and in Section #3, I look at funds that may fit into Vanguard’s outlook for performance. Key points are summarized after each heading so readers can skip to the sections of interest.
1. Retrospection
Key Point: The seven long term trends covered in this article are 1) slowing economic growth, 2) stagnant profit growth, 3) massive stimulus which will wear off, 4) end of the bond bull market with associated low interest rates, 5) impact of corporate buybacks on asset inflation and volatility, 6) high leverage which increases instability, and 7) taxes that are heading higher.
In the ten years following my high school graduation, the stock market had average annual returns of 0.3% plus inflation. During the past fifty years, there have been seven bear markets with the stock market falling 25 to 55 percent in all but one. In ten years separate years we saw one day drops in the S&P 500 of more than 5 percent. Through these 50 years, the stock market has returned 7 percent plus inflation; that is, the “real” returns from the US market over the past 50 years has been 7%. For the past ten years, the S&P 500 has returned nearly 13 percent annualized plus inflation with almost all of the gains due to increases in valuation. The past ten years has seen unusually high returns due to higher valuations without much growth in the economy or profits.
Valuations and Secular Markets
P/E remains significantly above the level justified by low inflation and low interest rates. Ed Easterling, Crestmont Research
In retrospect, during the past 36 years, the Vanguard Wellington, a balanced growth fund, returned 10.7%, almost as much as the 11.7% of the S&P 500, while the conservative Vanguard Wellesley returned a respectable 9.4%. During this period, the markets experienced the Black Monday stock market crash of 1987, the bursting of the Technology Bubble and Housing Bubble/Financial Crisis, and the COVID-induced recession. Part of the success of the mixed asset funds was due to rising bond prices as interest rates declined.
Figure #1: Growth of S&P 500, Long Bonds, Vanguard Mixed Asset Funds Since 1985
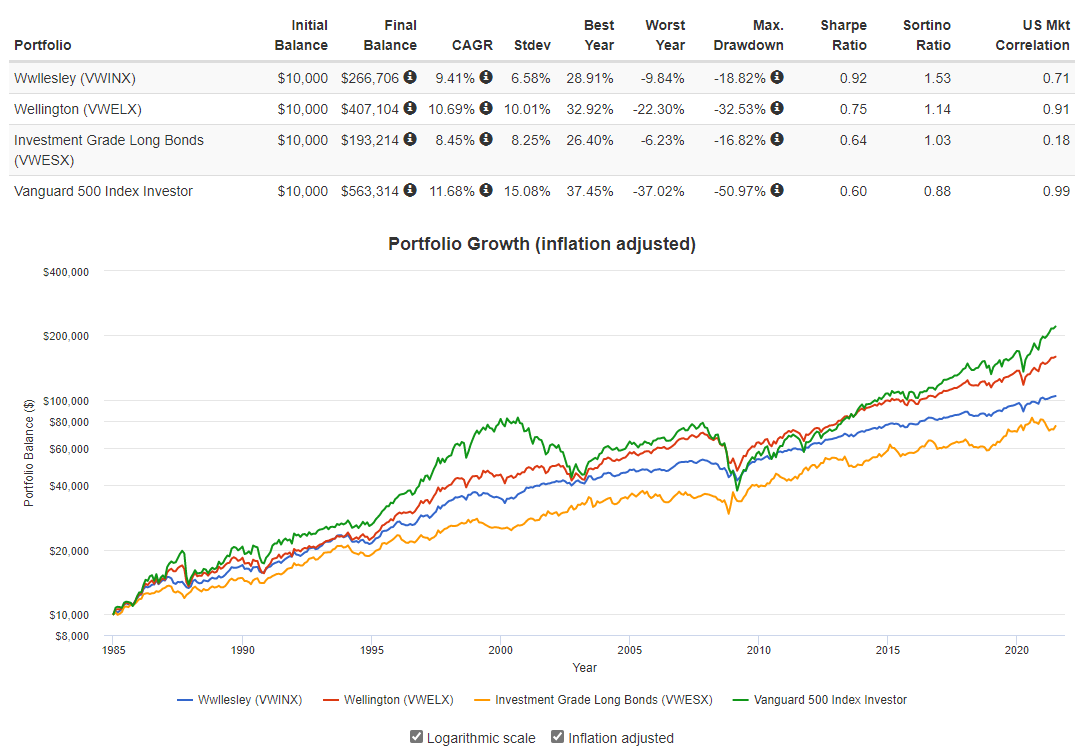
Source: Created by the Author Using Portfolio Visualizer
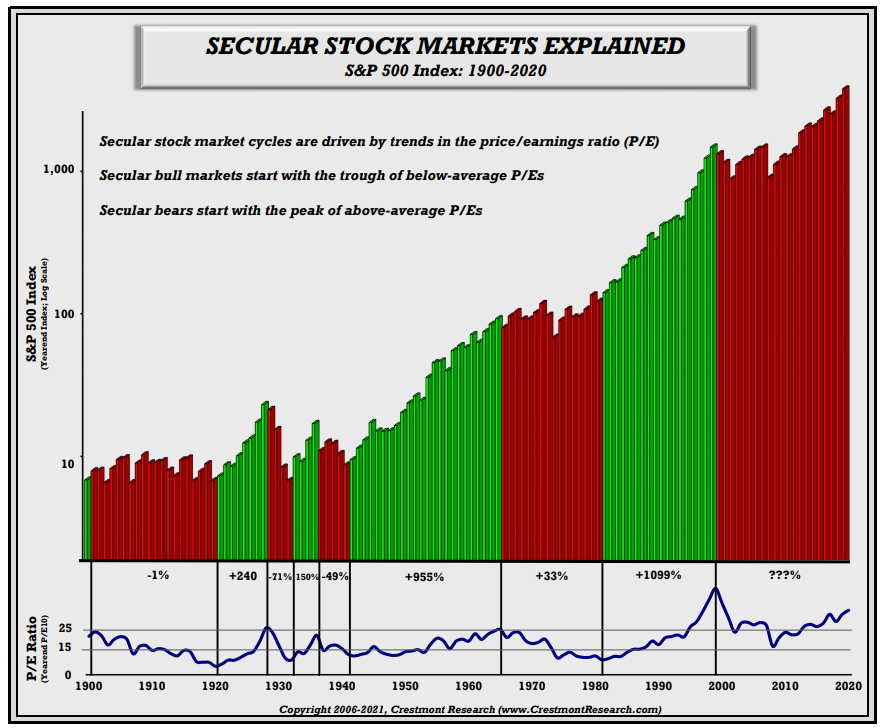
Ed Easterling, founder of CrestmontResearch, explains these long-term secular markets in Unexpected Returns: Understanding Secular Stock Market Cycles and Probable Outcomes: Secular Stock Market Insights (2005). Mr. Easterling defines secular markets partly by extremes in valuations. By his definition, we are in a cyclical bull market within a secular bear market that began in 2000 because valuations never reached the historical averages as shown in Figure #2.
Figure #2: Secular Stock Markets Explained by Crestmont Research
Mr. Easterling shows the impact of normalizing current valuations over different time periods in Table #1. The conclusion should be that stock market returns during the coming decade(s) will be much lower than the past decade(s).
Table #1: Returns for Normalized Valuations for Different Time Periods
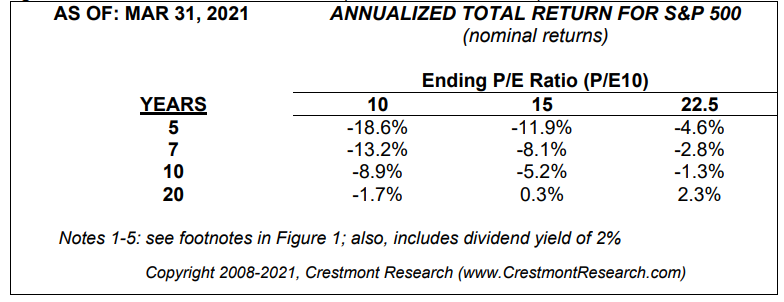
Source: Crestmont Research
I like the approach of Benjamin Graham who advocated owning between 25% and 75% stocks based on valuations, or John Bogle who reduced his allocation to stocks at the height of the Technology Bubble as described in his book, Enough: True Measures of Money, Business, and Life. Columbia Thermostat follows the approach of adjusting allocations based on valuations. At the time of this writing, the S&P 500 stands at 4,375. Columbia Threadneedle released its updated allocation table on May 1st, available at Columbia Thermostat Fund Allocation Update, for the Columbia Thermostat Fund (COTZX/CTFAX). It currently stands at 10 percent allocation to stocks until the S&P 500 falls to 3,743 or 14 percent. They state:
The updates to the S&P 500 Index levels in the table below are calculated based on cyclically adjusted price-to-earnings (P/E) ratio for the prior seven-year period. If the P/E ratio is in the top 25%, we determine that the market is “expensive” and use the full version of the table. As a result of last year’s historic rise, we are currently in the top ninth percentile of P/E—well within the top 25% that designates an expensive market.
Trend #1: Slowing Economic Growth
But the post-pandemic boom, fueled by pent-up demand for services, trillions in extra savings and trillions more in government aid, will fade. The CBO now projects growth will slow to 1.1 percent in 2023 and an average of 1.2 percent in 2024 and 2025 — the slowest sustained growth the United States has seen outside of a recession, according to Commerce Department data going back to 1929.
What happens to the economy when $5.2 trillion in stimulus wears off?
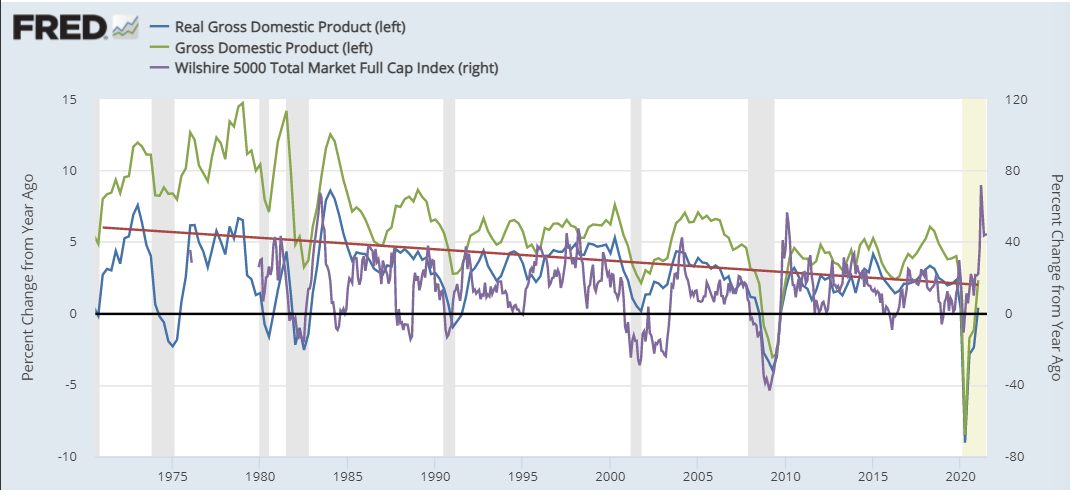
Figure #3 shows real gross domestic product annual growth (blue line) has fallen from 3.0% in the first two decades following my high school graduation to 1.7% for the past two decades. The current growth rate is more than 40 percent lower than 40 years ago. As the quote from the Washington Post above says, the CBO now projects slow growth of close to 1 percent after the stimulus wears off.
Figure #3: Annual Growth of GDP, Real GDP, and Wilshire 5000
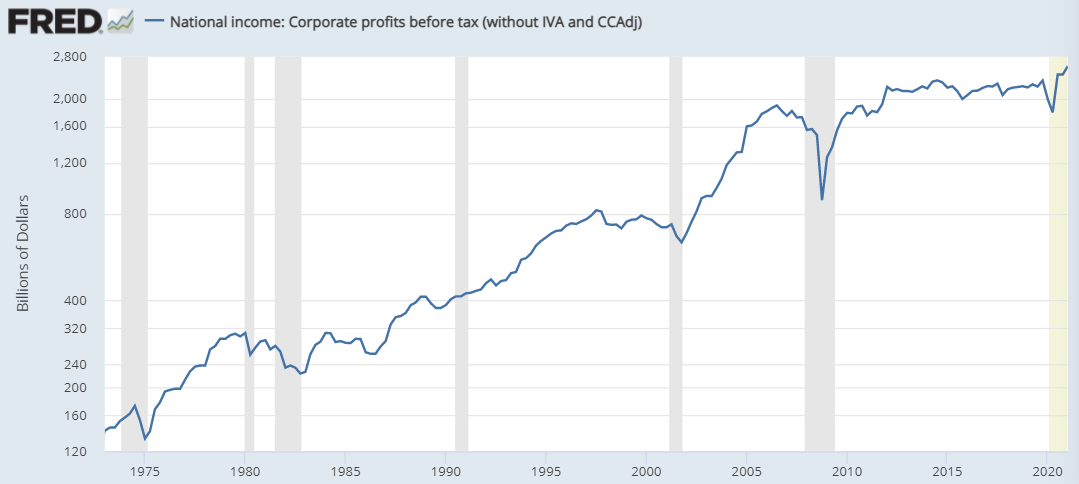
Trend #2: Stagnant Profit Growth.
Corporate profits (before taxes) have not grown significantly in 10 years.
Figure #4: Corporate Profits Before Tax
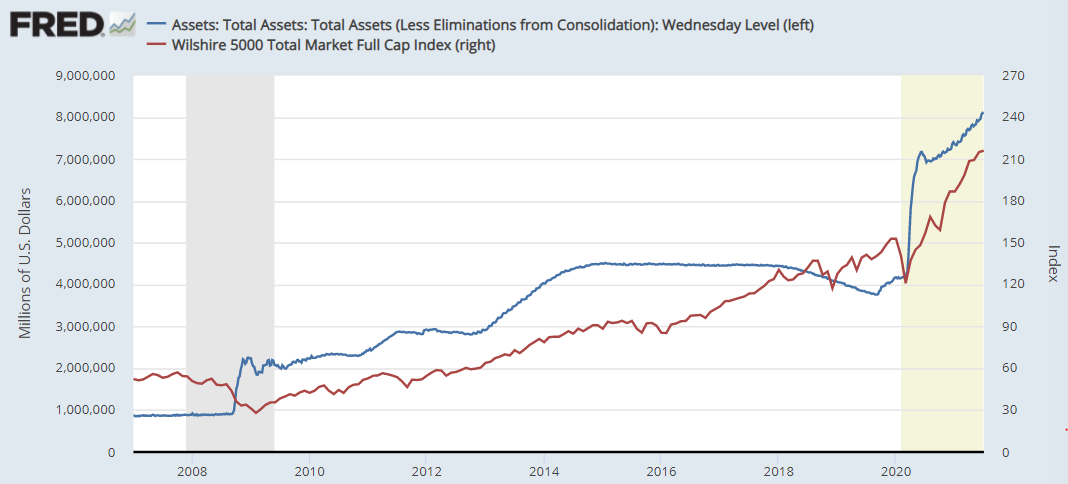
Trend #3: Massive Stimulus is Driving Asset Prices.
Massive stimulus has reduced the impact of the financial crisis and COVID-induced recession, but has also lowered interest rates, increased liquidity, and resulted in driving up asset prices. It raises the possibility of another Minsky Moment, where economic stimulus and necrosis of the bond market sets the stage for a dramatic fall. Tapering will remove a driving force from the markets over the next few years.
Figure #5: Total Value of the Assets of all Federal Reserve Banks vs Wilshire 5000
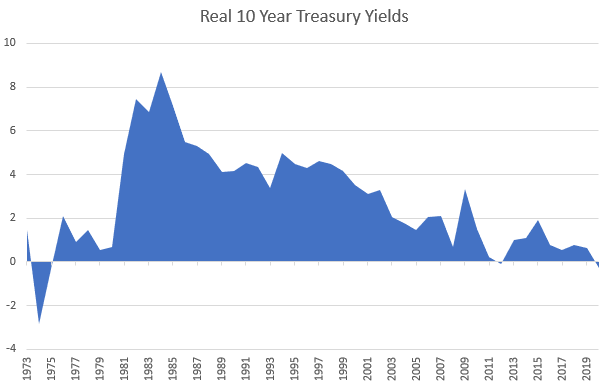
Trend #4: End of the Bond Bull Market
Real yields (adjusted for inflation) on ten-year Treasuries have come full circle from being nearly zero in the 1970’s to eight percent in the early 1980’s back down to zero for parts of the last decade. Funds that have benefited over the past 40 years from investing in long duration bonds will not have this benefit in this decade.
Figure #6: Real 10 Year Treasury Yields
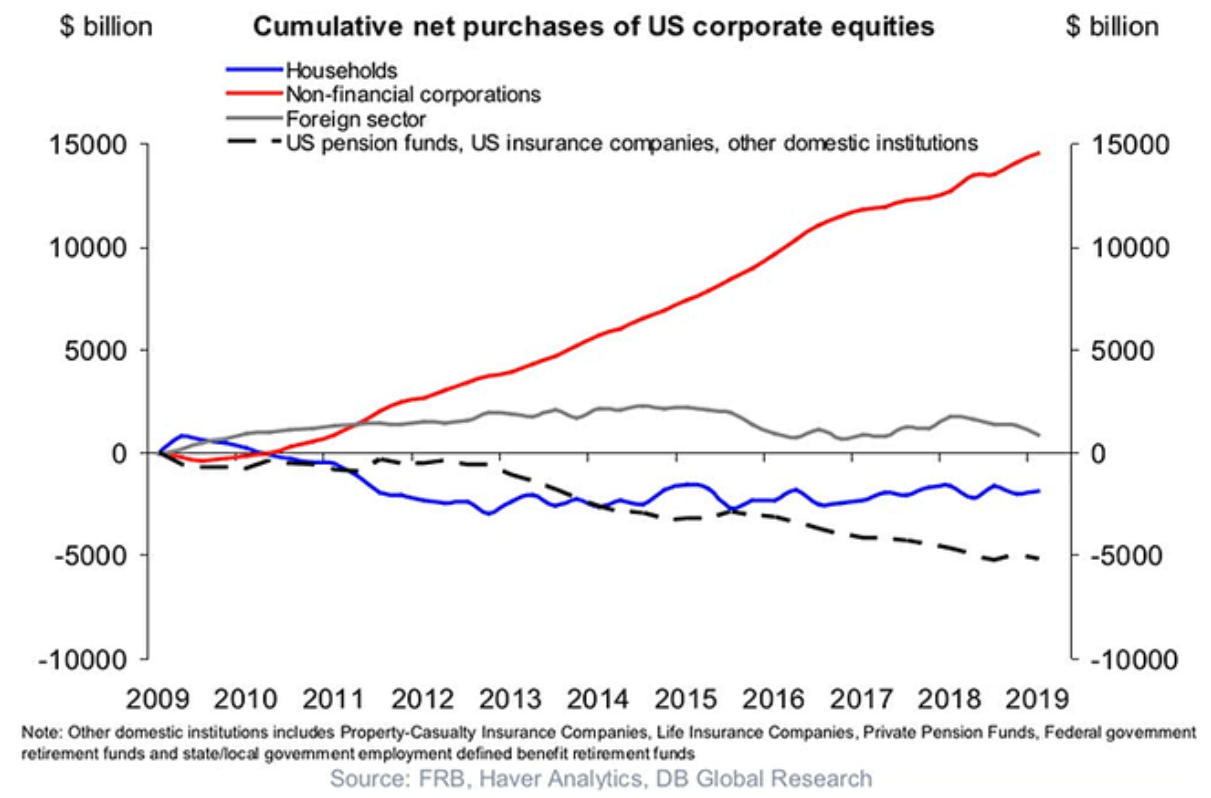
Trend #5: Corporate Buybacks Increase Valuations Financed with Cheap Debt
Lance Roberts shows in Aaand It’s Gone…The Biggest Support for Asset Prices that corporations have been the only significant net buyers of stocks for the past decade. Corporations have been issuing debt to take advantage of low interest rates and buying back their own shares which increases the earnings per share. Profits are rising, but the earnings per share is due to a higher debt to equity ratio. Corporate share buybacks tend to occur more during strong economic growth and decrease during times of slow growth. Buybacks slowed in 2018 through 2020, but have been increasing for the past three quarters. We can expect corporate buybacks to decline when the stimulus tapers and growth slows.
Figure #7: Cumulative Net Purchases of US Corporate Equities
Trend #6: Leverage Is Driving Asset Prices and Increases Market Instability
Low interest rates have made it cheaper to buy stock on margin. The increase in margin is another driver of stock market increases over the past decade as shown by the negative free cash in margin accounts. Conversely, a declining market encourages the quick exodus from margin as can be observed prior to the 2020 bear market.
Figure #8: Free Cash in Margin Accounts vs S&P 500
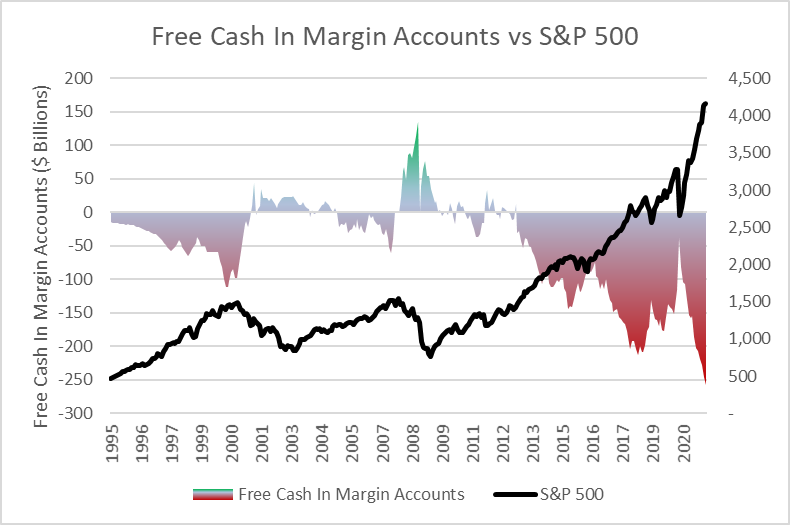
Source: Created by the Author Using data from FINRA
Trend #7: Taxes Are Heading Higher
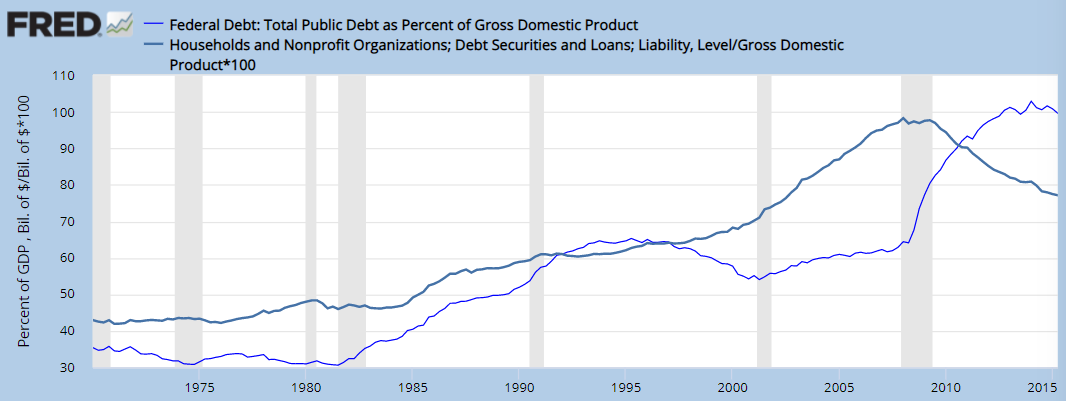
Federal debt and deficits have been climbing to the extent that Federal Debt to GDP is near the levels following World War II. High debt levels reduce the amount of capital available for investing in future growth. Technology and lower taxes combined have not grown the economy enough to create a balanced budget. This is not sustainable, so spending has to be cut or taxes raised.
Figure #9: Federal and Household Debt to GDP
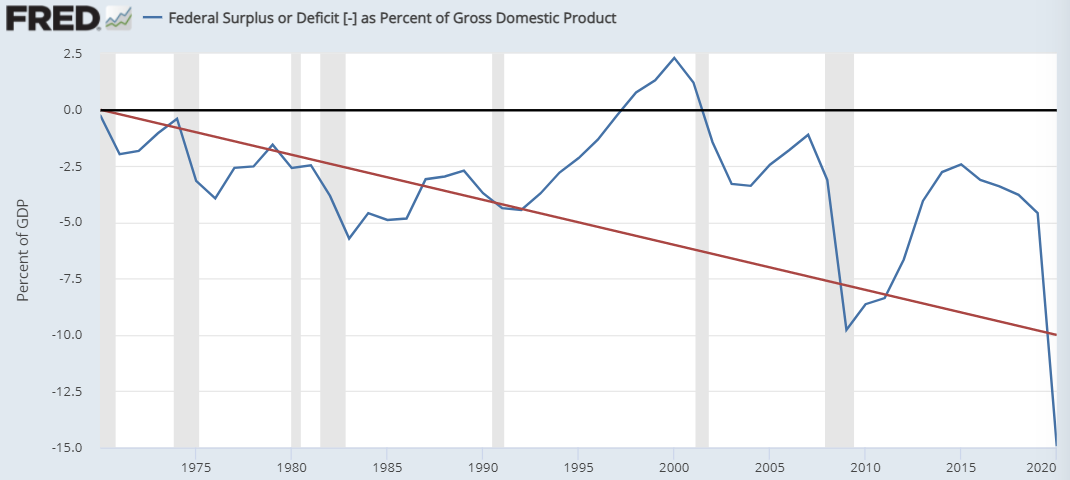
The Federal deficit is now more than 10 percent of GDP. Growth is likely to remain slow, pressure will build to cut spending and/or increase taxes.
Figure #10: Federal Deficit as Percent of Gross Domestic Product
President Biden has proposed raising the capital gains taxes which is likely to remove some of the incentives for corporate share buybacks.
President Joe Biden proposed doubling capital gains taxes for investors making over $1 million to fund his American Families Plan. While some high-income investors may consider selling assets to avoid paying a 39.6% rate, the current tax code allows for different strategies to minimize capital gains taxes. Biden’s plan will change as it moves through Congress, and both chambers will have to approve it via vote before the president can sign it into law.
Inside Biden’s Capital Gains Tax Plan
Table #2 shows the capital gains tax rates for the past 50 years. It fell in 1997 for individuals and 2018 for corporations.
Table #2: Historical Capital Gains Tax Rates
| Date |
Individuals |
Corporations |
| 1971 |
32.5% |
25.0% |
| 1972–1974 |
35.0% |
25.0% |
| 1975–1977 |
35.0% |
30.0% |
| 1978 |
33.8% |
30.0% |
| 1979 |
35.0% |
30.0% |
| 1980–1981 (June 9) |
28.0% |
28.0% |
| 1981 (after June 9 )–1986 |
20.0% |
28.0% |
| 1987–1992 |
28.0% |
34.0% |
| 1993–1997 (May 6) |
28.0% |
35.0% |
| 1997 (after May 6)–2003 (May 5) |
20.0% |
35.0% |
| 2003 (after May 5)–2012 |
15.0% |
35.0% |
| 2013–2017 |
20.0% |
35.0% |
| 2018-2021 |
20.0% |
21.0% |
Source: Historical Capital Gains Rates
Another tax change coming is the global minimum tax which was recently discussed by Treasury Secretary Janet Yellen. Income, sales, royalties, property and value added taxes (VAT) are the common methods for collecting taxes. Most of the world uses VAT with the US using income and sales more as primary taxes. This encourages corporations operating globally to “optimize” taxes, sometimes leading to relocating headquarters to countries with lower taxes and using tax havens. The global minimum taxes are an attempt to equalize taxes globally, reducing the incentive for countries to “race to the bottom” by keeping taxes artificially low.
A group of 130 nations has agreed to a global minimum tax on corporations, Treasury Secretary Janet Yellen announced Thursday, part of a broader agreement to overhaul international tax rules.
Yellen did not announce the actual rate at which the GMT would be set, but the Biden administration has pushed for at least 15%.
The GMT would effectively end the practice of global corporations seeking out low-tax jurisdictions to move their headquarters.
130 nations agree to support U.S. proposal for global minimum tax on corporations
Closing of tax loopholes and more tax increases can be expected to continue.
2. Vanguard’s Long-Term View
Key Point: Vanguard’s view is that funds with more international exposure and value orientation will outperform in the coming decade(s).
Along the theme of this article, Vanguard published A Tale of Two Decades for U.S. and non-U.S. Equity: Past Is Rarely Prologue which I can align with:
The past 10 years have been tremendous for U.S. stocks relative to their international peers, largely because investors expected the U.S. to grow faster and it did. Now, however, higher valuations and slower earnings growth in the U.S. relative to the past decade make future outperformance unlikely. As a result, we expect that investors who maintain globally diversified equity portfolios will be rewarded in the years ahead.
The ownership structure of Vanguard favors the investors. The company is more oriented to buy and hold investors and has some of the lowest costs for funds. I trust their analysis to be less biased or promotional than most sources. In Asset Bubbles and Where to Find Them, Vanguard believes that the broad market is highly valued but that value stocks are undervalued. They expect value to outperform growth over the coming decade as described in Why U.S. value stocks are poised to outperform growth (April 2021).
The broad market may be overvalued, though not severely. Yet forthcoming Vanguard research highlights one part of the U.S. equity market that gives us pause: growth stocks. Low-quality growth stocks especially test our “plausible future income” scenario. For some high-profile companies, valuation metrics imply that their worth will exceed the size of their industry’s contribution to U.S. GDP. Conversely, our research will show that U.S. value stocks are similarly undervalued.
Vanguard’s projected returns over the next decade as discussed in Beyond the Pandemic: What to Expect from Stocks, Bonds (June 2021) are more generous than most that I have seen.
Figure #11: Vanguard Model of Returns in the Coming Decade
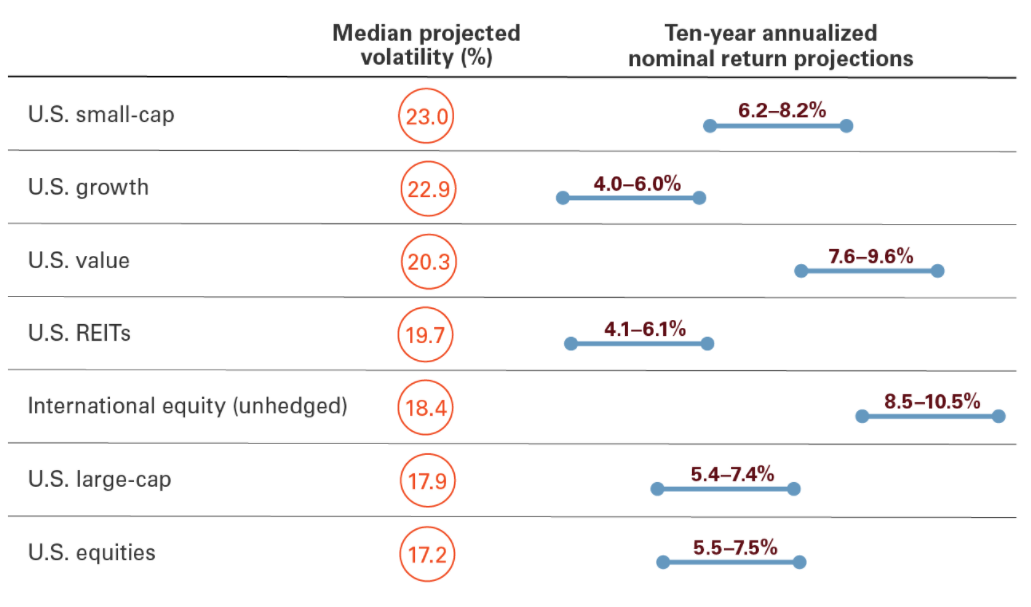
Source: Vanguard
3. Funds for the Next Decade
Key Point: Funds covered in this section include Target Retirement Funds, Mixed Asset Funds with high international exposure, Global Equity Funds, and Value Funds.
…the tectonic plates of market fundamentals are tightly bound and seeking realignment. Relatively high inflation and relatively high stock and bond valuation are very unlikely to coexist indefinitely.
The inflation rate will likely recede, and the current market trend is likely to continue. But it’s also a good time to have portfolios strapped to the parachute of diversification.
Be sure to diversify risk in this environment, not simply to diversify asset classes.
Ed Easterling’s July 2021 newsletter
The performance metrics in the following tables are from Mutual Fund Observer. The allocations and three-year Tax Cost Ratio are from Morningstar. The three-year after-tax return is calculated by the author based on these values.
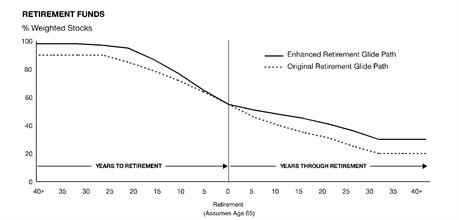
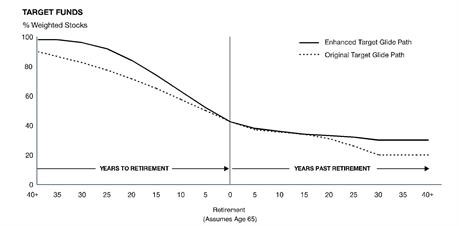
Target Retirement Funds
For target retirement funds, I track Fidelity Freedom, Fidelity Freedom Index, T. Rowe Price Retirement, T. Rowe Price Target, and Vanguard Target Retirement without fully appreciating the differences. To explore this further, I used MFO Premium’s MultiSearch to compare the Fidelity and Vanguard index funds for the Glide Path with metrics shown for the past three years. The fund groups are similar with the main differences in red. First, Vanguard starts dropping the allocation to stocks as an investor is about twenty years from retirement. Second, Fidelity continues to drop the allocation to stocks for an investor who is in near retirement down to the Target Retirement Income Fund (FIKFX) of 19 percent while Vanguard drops quickly to 33 percent but then the Target Retirement Income Fund (VTINX) has 30 percent allocated to stocks. Investors may want to consider a bucket approach of several funds with different Target Dates to match withdrawal needs.
Table #3: Glide Path of Vanguard and Fidelity Target Date Funds
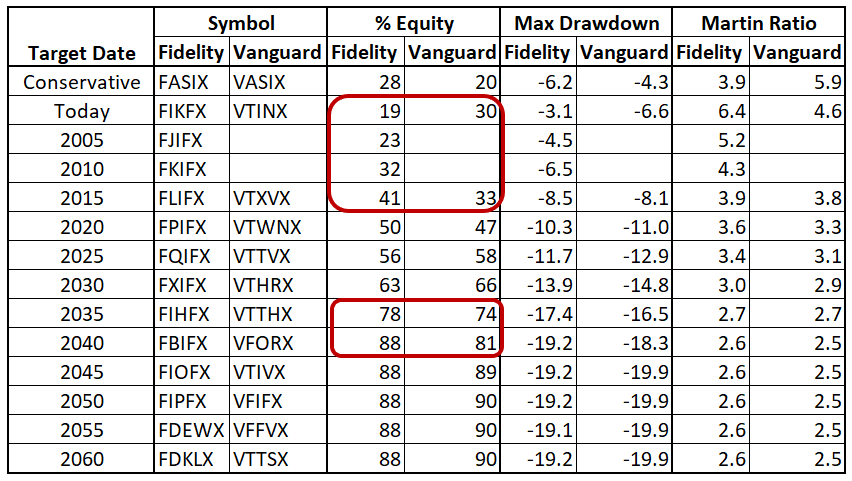
Source: Created by the Author Using Lipper Global Datafeed data and MFO Premium screeners
Next, I look at the five different fund groups that I track using the 2025 Category with metrics shown for the past five years. First, allocations to equities range from 50 to 65 percent with T. Rowe Price Retirement 202 (TRRHX) being the one outlier. The allocations to foreign stocks generally fall between 35 and 41 percent of the total allocation to stocks with Fidelity Freedom 2025 being an outlier with foreign stocks making up 53 percent of the total allocation to stocks. The funds are sorted from highest risk adjusted return (Martin Ratio) to the lowest. In other words, over the past seven years the active management of some funds did not overcome the low-cost advantage of index funds. True, TRRHX and FFTWX had slightly higher average annual returns, but also slightly higher drawdowns.
Table #4: Performance of Target Date 2025 Funds – Seven Years
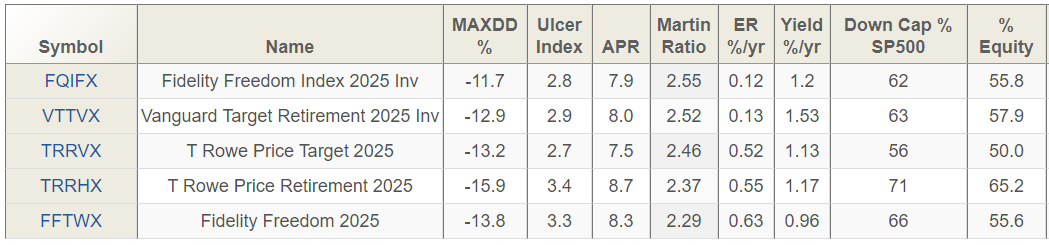
Source: Created by the Author Using MFO Premium screeners
So what is the difference between the Fidelity Freedom Index 2025 Fund (FQIFX) and Fidelity Freedom 2025 Fund (FFTWX)? The primary differences are the following two excerpts added to the non-index (FFTWX) Summary Prospectus Primary Investment Strategies:
The Adviser, under normal market conditions, will use an active asset allocation strategy to increase or decrease asset class exposures relative to the neutral asset allocations reflected above by up to 10% for equity funds, bond funds and short-term funds to reflect the Adviser’s market outlook, which is primarily focused on the intermediate term. The asset allocations in the glide path above are referred to as neutral because they do not reflect any decisions made by the Adviser to overweight or underweight an asset class.
The Adviser may also make active asset allocations within other asset classes (such as commodities, high yield debt (also referred to as junk bonds), floating rate debt, real estate debt, and emerging markets debt) from 0% to 10% of the fund’s total assets individually, but no more than 25% in aggregate within those other asset classes. Such asset classes are not reflected in the neutral asset allocations reflected in the glide path above.
Mixed Asset Funds with High International Exposure
Table #5 contains the Mixed Asset Funds that I track with more than 30 percent allocated to stocks of which at least 30 percent are foreign, and with low to moderate valuations. They are sorted from highest allocation to stocks to lowest.
Table #5: Allocations of Mixed Asset Funds with High International Exposure
| Name |
Symbol |
Cash & Bonds |
U.S. Stocks |
Foreign Stocks |
Other |
Stocks |
Foreign/ Stocks |
| iShares Core Aggressive Alloc |
AOA |
21 |
45 |
34 |
0 |
79 |
43 |
| ClearShares OCIO ETF |
OCIO |
31 |
45 |
23 |
1 |
68 |
34 |
| Vanguard Global Wellington |
VGWAX |
32 |
38 |
29 |
2 |
67 |
43 |
| SPDR® SSgA Global Allocation |
GAL |
32 |
35 |
30 |
2 |
66 |
46 |
| KL Allocation Institutional |
GAVIX |
36 |
27 |
37 |
1 |
64 |
58 |
| Vanguard Managed Allocation |
VPGDX |
36 |
34 |
29 |
1 |
63 |
46 |
| Vanguard STAR Inv |
VGSTX |
37 |
41 |
21 |
1 |
63 |
34 |
| Vanguard LifeStrategy Mod Grwth |
VSMGX |
38 |
36 |
25 |
0 |
61 |
41 |
| iShares Core Growth Allocation |
AOR |
40 |
34 |
26 |
0 |
60 |
43 |
| Fidelity Multi-Asset Income |
FAYZX |
30 |
34 |
17 |
19 |
51 |
33 |
| BlackRock 40/60 Target Alloc |
BAMPX |
54 |
30 |
15 |
1 |
45 |
33 |
| Vanguard LifeStrategy Cnsrv Gr |
VSCGX |
58 |
25 |
17 |
1 |
41 |
41 |
| T. Rowe Price Retire Balanced |
TRRIX |
60 |
26 |
14 |
0 |
40 |
34 |
| Vanguard Global Wellesley Inc |
VGYAX |
58 |
16 |
24 |
3 |
40 |
60 |
| iShares Core Moderate Alloc |
AOM |
61 |
22 |
17 |
1 |
38 |
43 |
Source: Created by the Author Using Morningstar
Table #6 contains the MFO metrics for three years with Morningstar’s Tax Cost Ratio. I approximate the After-Tax Return, but this is specific to individual investor’s tax circumstances. The funds shaded green are the lowest risk as measured by the Ulcer Index. The funds shaded blue had more than 10 percent annualized returns. I identified T. Rowe Price Retire Balanced (TRRIX) as a One Stop Mutual Funds with Good Multi-Year Metrics.
Table #6: Performance (3 Years) of Mixed Asset Funds with High International Exposure
| Symbol |
P/E |
RTN 3 Year |
S&P500 Downside |
Ulcer |
Martin |
%Tax Cost Ratio |
After Tax Return |
| AOA |
26 |
12.3 |
78 |
4.8 |
2.3 |
0.7 |
11.6 |
| OCIO |
22 |
9.9 |
61 |
3.6 |
2.5 |
1.0 |
8.9 |
| VGWAX |
27 |
11.3 |
63 |
4.1 |
2.5 |
0.6 |
10.7 |
| GAL |
21 |
9.6 |
72 |
4.9 |
1.7 |
1.0 |
8.6 |
| GAVIX |
32 |
7.4 |
10 |
2.9 |
2.1 |
2.1 |
5.3 |
| VPGDX |
20 |
8.9 |
59 |
4.3 |
1.8 |
1.7 |
7.2 |
| VGSTX |
23 |
14.6 |
60 |
3.4 |
4.0 |
1.7 |
12.9 |
| VSMGX |
20 |
11.3 |
55 |
3.2 |
3.2 |
1.0 |
10.3 |
| AOR |
20 |
10.6 |
57 |
3.4 |
2.8 |
0.8 |
9.8 |
| FAYZX |
28 |
16.6 |
42 |
2.5 |
6.2 |
1.3 |
15.3 |
| BAMPX |
19 |
10.5 |
34 |
2.2 |
4.3 |
1.5 |
9.1 |
| VSCGX |
14 |
9.2 |
32 |
2.0 |
4.0 |
1.0 |
8.2 |
| TRRIX |
14 |
9.6 |
40 |
2.5 |
3.4 |
1.9 |
7.8 |
| VGYAX |
23 |
6.8 |
41 |
2.6 |
2.2 |
0.9 |
5.9 |
| AOM |
13 |
8.9 |
35 |
2.2 |
3.6 |
0.9 |
8.0 |
Global Equity Funds
The following funds are Global Equity Funds with high exposure to foreign stocks. I include this section for readers who prefer to build their own portfolios instead of using Mixed Asset Funds. They are selected because of their relatively low Ulcer Index and high Martin Ratio.
Table #7: Allocation and Performance of Global Stock Funds
| Description |
Symbol |
%U.S. Stocks |
%Foreign Stocks |
RTN 3 Year |
Ulcer |
Martin |
| BlackRock MSCI Global Impact |
SDG |
31 |
69 |
22.2 |
3.8 |
5.6 |
| Columbia Select Global Equity |
IGLGX |
62 |
36 |
21.9 |
3.9 |
5.3 |
| T Rowe Price Global Growth Stock |
RPGEX |
52 |
44 |
23.8 |
4.8 |
4.7 |
| T Rowe Price Global Stock |
PRGSX |
52 |
46 |
25.8 |
4.9 |
5.0 |
| Adaptive Growth Opport |
AGOX |
63 |
22 |
18.9 |
5.0 |
3.5 |
| BlackRock Global 100 |
IOO |
72 |
27 |
17.9 |
5.1 |
3.3 |
| Northern Trust Global Sustain |
NSRIX |
64 |
36 |
15.8 |
5.3 |
2.8 |
| Fidelity Worldwide |
FWWFX |
63 |
35 |
19.4 |
5.3 |
3.4 |
| Vanguard Global Equity Inv |
VHGEX |
53 |
47 |
16.8 |
5.7 |
2.8 |
| BlackRock MSCI ACWI |
ACWI |
58 |
41 |
14.7 |
5.8 |
2.3 |
| Vanguard Total World Stock |
VT |
56 |
44 |
14.7 |
6.0 |
2.2 |
| State Street Global Stock Market |
SPGM |
59 |
41 |
15.1 |
6.1 |
2.3 |
Value Funds
I track many value funds, but Yacktman (YAFFX) stands out for its long term performance. Two noticeable things about the fund is its exposure to foreign stocks, and its willingness to move to cash when valuations are high. I include VictoryShares US EQ Income Enhanced Volatility Weighted ETF (CDC) because of its lower risk and low correlation to the S&P 500.
Table #8: Allocation and Performance of Value Funds
| Name |
Symbol |
%Cash |
%U.S. Stocks |
%Foreign Stocks |
%Bonds |
| AMG Yacktman Focused |
YAFFX |
16 |
45 |
37 |
3 |
| VictoryShares US EQ Inc Enh Vol Wtd |
CDC |
0 |
99 |
1 |
0 |
| |
| Symbol |
SP500 Downside |
SP500 Correl |
Ulcer |
Yield TTM |
Total Return
3 Year |
Tax Cost Ratio
3 Year |
After Tax Return |
| YAFFX |
74 |
0.91 |
5.3 |
0.7 |
16.0 |
3.6 |
12.4 |
| CDC |
77 |
0.82 |
5.0 |
2.2 |
15.1 |
1.2 |
13.9 |
Closing
In retrospect, the changes that we have seen during the past 50 years are incredible. For investors of any age, the impact of secular markets can have a major impact on retirement. Financial education is the best solution for most investors.
I have talked with three financial advisors this year, am consolidating accounts, and trimmed back tactical funds that have lost momentum. I have shifted a portion of assets to international mixed asset funds, and have invested more in the Columbia Thermostat Fund (COTZX/CTFAX).
I attended Charles Boccadoro’s MFO Webinar this week on the new features in MultiSearch. There are some very useful features that I wish I had before starting this article. I especially like the Lipper Leaders Rankings, additional trend metrics, and the Batting Averages for rolling return metrics.
Did you know that the Vanguard Target Date Funds (VTHRX, VTWNX, VTTVX), Janus Henderson Balanced (JABAX), and T Rowe Price Spectrum Moderate Allocation (TRPBX) have all beaten their peers more than 90 percent of the time during each of the past ten years for minimum one year rolling APR? Incredible!
Best Wishes and Stay Safe!
As disclosure, I own VWIAX, FIKFX, VTWNX, FFFDX, VGWAX, GAVIX/GAVAX, FAYZX/FMSDX, VSCGX, VGYAX, COTZX/CTFAX discussed in this article.