


One Stop Mutual Funds with Good Multi-Year Metrics (CTFAX, FMSDX, JABAX, PRSIX, RBBAX, TRRIX, VTINX, VWINX)
As I imagine retirement in a few years here, my personal investing goals have been to simplify. I built my Ranking System around MFO Metrics to determine the best funds for a conservative investor nearing retirement considering long-term performance, momentum, consistency, downside volatility, risk-adjusted returns, quality, and income. These funds are in line with my preference to have diversified low-risk funds where the manager has the discretion to change allocations to reduce risk.
I was inspired by the new Mutual Fund Observer Multi-Search features to search for funds with five-year risk-adjusted returns (Martin Ratio) greater than 2.5, a maximum drawdown of 11 or less, Ulcer Index less than 3, downside deviation less than 6, annualized returns higher than 6%, positive ten-month trend, Fund Family Rating of 3 or more, and bond quality of investment-grade BBB or higher. There are surprisingly few funds meeting these criteria. The article took a twist when a Reader despaired of finding “One Stop Shop Mutual Fund Options with Good Multi-Year Metrics” and a turn after comments on the Mutual Fund Observer Discussion Board about the risks of derivatives and hard to value assets.
This article looks at the performance of Lipper Categories over five and fifteen year periods. Thirteen funds are identified with lower risk and higher risk-adjusted-performance. The Final One Stop Shop List contains eight funds. The hidden risk or benefits of derivatives and assets with lower confidence in value is examined.
This article is divided into sections for those who wish to skip to particular topics of interest. Those only interested in the Final List of One Stop Shop Funds may skip to Section 6. Key Points are added at the top of each section for those who have limited time.
-
- Best One Stop Lipper Categories
- Known Unknowns – The Case for Risk Management
- The Twist – The One Stop Contenders
- The Turn – Level 3, Derivatives and “Other Assets”
- Evaluating the Funds
- Final List of One Stop Shop Mutual Funds
- Summarized Fund Strategies
1. Best One Stop Lipper Categories
Key Point: New funds are being introduced, but most of the consistent, low risk funds with higher risk adjusted returns have been in existence for more than 15 years.
Table #1 contains all funds in eight Lipper Categories with expense ratios less than 1.5% that were in existence five years ago and fifteen years ago. These 248 funds in existence for the past 15 years had $1.4 trillion in assets. For the funds between five and fifteen years of age, the assets have $281 billion (21%) but the number of funds grew to 400 for a 61% increase in the number of funds. Part of this large increase in the number of funds is known as survivor bias, where less successful funds are closed or merged with others and new funds spring up in their place. More than 30% of the increase in assets and number of funds came in the Flexible Portfolio category.
Table #1: Lipper Category Risk and Risk-Adjusted Returns – Five and Fifteen Years
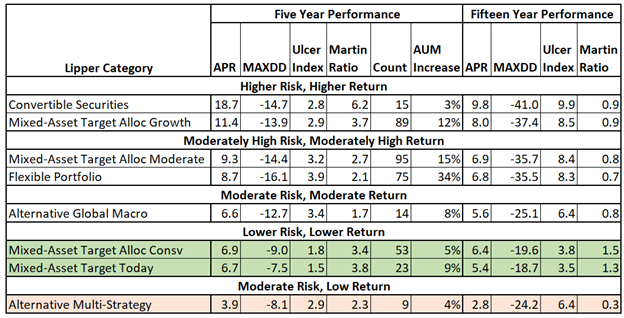
Source: Created by the author based on MFO Premium data and screeners
Figure #1 shows the relationship of Return vs Risk is almost linear over 15 years with the exception of the Alternative Multi-Strategy Funds which have significantly lower returns for the level of risk. There are only nine of these funds. The Mixed-Asset Allocation Conservative and Today are shaded green because they have higher risk-adjusted returns (Martin Ratio).
Figure #1: Risk Vs Return – Fifteen Years
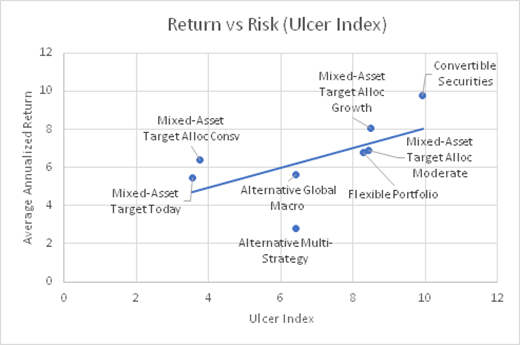
Source: Created by the author based on MFO Premium data and screeners
Depending upon market conditions, conservative funds such as the Vanguard Wellesley Income Fund (VWINX) can outperform more aggressive funds such as the case in Figure #2 because of high starting valuations. Market valuations are very high, but with infrastructure and more stimulus being considered, the markets may continue to be elevated for years. I show this example as I believe we are approaching a similarly extended time period where a conservative approach will outperform.
Figure #2: The Tortoise (Conservative VWINX) and the Hare (S&P 500) Performance
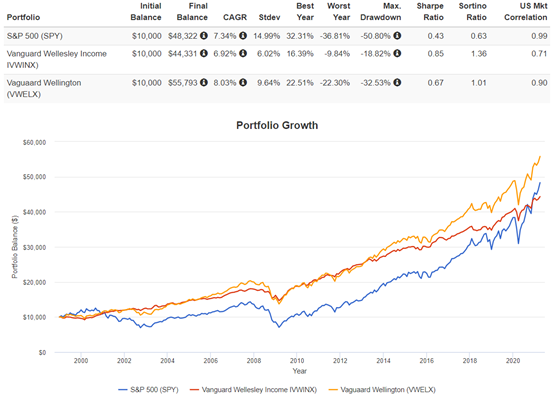
Source: Created by the author using Portfolio Visualizer.
2. Known Unknowns – The Case for Risk Management
Key Point: Valuations are high, the risk of inflation is rising, taxes are likely to increase to pay for massive stimulus.
Although market risk remains, it’s true that by focusing on acceptable downside first, those portfolios are likely to weather downturns better even if they do surrender some upside as an offset. And while none of these approaches is perfect, they can work as a component to offset a portion of the market risk retirees probably need to endure for decades to come.
The Perfect Storm for Retirees, Kiplinger, George Terlizzi
In Best No-Load Mutual Funds Available At Fidelity, I showed a chart by Jill Mislinksi from Advisor Perspectives revealing that markets are highly valued, and a chart by Christine Benz from Morningstar compiling estimates of some major financial institutions showing that returns in the next ten years may be in the low single digits, and foreign equities are expected to have higher returns than domestic.
Ed Easterling, founder of Crestmont Research and author of Probable Outcomes: Secular Stock Market Insights and Unexpected Returns: Understanding Secular Stock Market Cycles, recently updated the P/E Summary shown in Table #2 which supports the cited examples. The chart shows that if valuations fall to a normal or low level then annualized returns may be negative over the next ten years.
Table #2: Annualized Return by Years and Valuations (CAPE 10 Year)
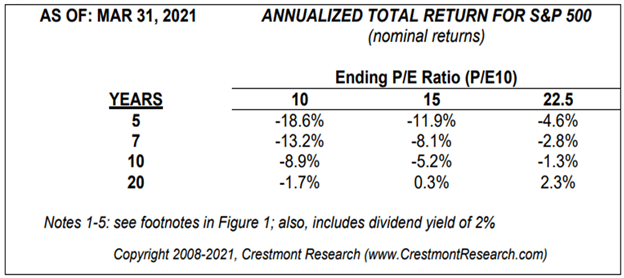
Source: Stock-PE-Summary
In the first quarter, the stock market gained 5.8%. As a result, normalized P/E increased to 39.4—significantly above the level justified by low inflation and low interest rates. Although the market appears to remain “irrationally overvalued,” there could be factors justifying such high valuation and commensurately low expected return. As a result, the current status of the stock market is positioned for “substantially below-average long term returns.”
– Ed Easterling, Crestmont Research
Mr. Easterling makes the connection between valuations and inflation. Historically, valuations fall when inflation rises. Measures of price increases compared to a year ago are distorted because they are against the trough of the recession. Figure #3 shows the trends in consumer, producer, home, and global commodity prices as well as stock market level and inflation expectation and breakeven rates since August 2020. Inflation is increasing and is a trend worth following.
-The potential that inflation reaches a level higher than expected and persists at that level for longer than is expected is our opinion.
-The outperformance of cyclicals and interest-sensitive stocks seems to validate the expectation that inflation will be higher for longer. The increase in fed funds future yields also suggests that the market expects inflation to force the Fed to begin raising rates sooner than they are currently articulating.
–Reflation and Rotation by Steven Vannelli of Knowledge Leaders Capital
Figure #3: Various Measures of Price Increases (Inflation)
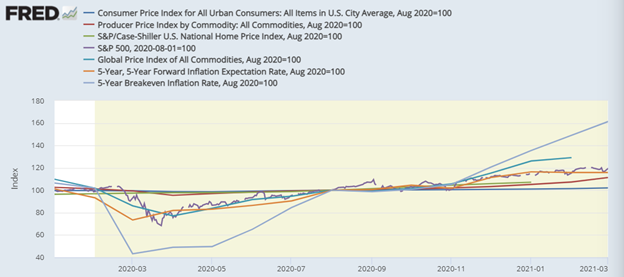
Source: Created by the author using the St. Louis Federal Reserve FRED Database
Lance Roberts describes Savita Subramanian’s view from Bank of America that the S&P 500 is overbought and there is a risk of a correction:
“Amid increasingly euphoric sentiment, lofty valuations, and peak stimulus, we continue to believe the market has overly priced in the good news. We remain bullish the economy but not the S&P 500. Our technical model, 12-Price Momentum, has recently turned bearish amid extreme returns over the past year.”
Mr. Roberts says that he is making profits and increasing cash levels. He suggests selling winners and what isn’t working and reviewing your allocation relative to your risk tolerance. Indeed, Tom Roseen, of Refinitiv Lipper, points out that money market funds had the largest absolute increase in assets under management increasing $179 billion (4%) for the first quarter while commodity funds increased $6 billion (28%) in assets.
And with improvements in the economic environment, Central Banks are more likely to taper back on accommodative policy:
The Bank of Canada (BoC) garnered headlines by becoming the first major central bank this year to make reductions to its accommodative monetary policy.
Taper Time: Bank Of Canada Scales Back Asset-Purchasing Program, Russell Investments
3. The Twist – The One Stop Contenders
Key Point: The Best One Stop Funds are actively managed funds with longer histories.
A Reader lamented finding “One Stop Shop Mutual Fund Options with Good Multi-Year Metrics” while my original article was based on fund performance over the past five years. I modified (twisted) this article to include funds meeting similar criteria over the past 15 years. Both mutual funds and exchange-traded funds were considered, but no exchange-traded funds made the list which is shown in Table #3. “Other Class” refers to a different share class of the same fund which may have different expenses, transaction fees, loads, inception dates, availability, and/or minimum investment requirements at different brokers. The funds are intended to be available to small investors without a front-end load with at least one of Charles Schwab, Fidelity, or Vanguard.
The funds are categorized by their stated objectives and yield as Risk Managed and/or Capital Preservation and Capital Appreciation separated by high and low yields. The Capital Preservation Funds are sorted from least risky, as measured by the Ulcer Index, over the past five years. The Capital Appreciation Funds with high yields are sort by risk adjusted yields (Yield/Ulcer Index) from highest to lowest. Capital Appreciation with low yields are sorted from the highest to lowest annualized returns.
All funds are classified as “Active Management Approach” although AOCIX, COTZX, RBBAX, TRRIX, and VTINX are “funds of funds”. Note that of the thirteen funds listed as “One Stop Contenders” all but four have histories going back to the 2008 recession and financial crisis.
The Symbols shaded dark green (CRAZX/CRAAX and FAYZX/FMSDX) are classified as “Great Owl” funds, those shaded light green (DODLX, RBBAX, PRSIX, TRRIX) are on the “Honor Roll”. Those with a red tint have had higher Ulcer Index (risk) and/or maximum drawdown relative to the other funds in the table over either the past 5 or 15 years. Those shaded yellow have higher allocations to “Other” asset classification or assets that are more subjective estimating the value (Level 2 & 3).
Table #3: The One Stop Shop Contenders
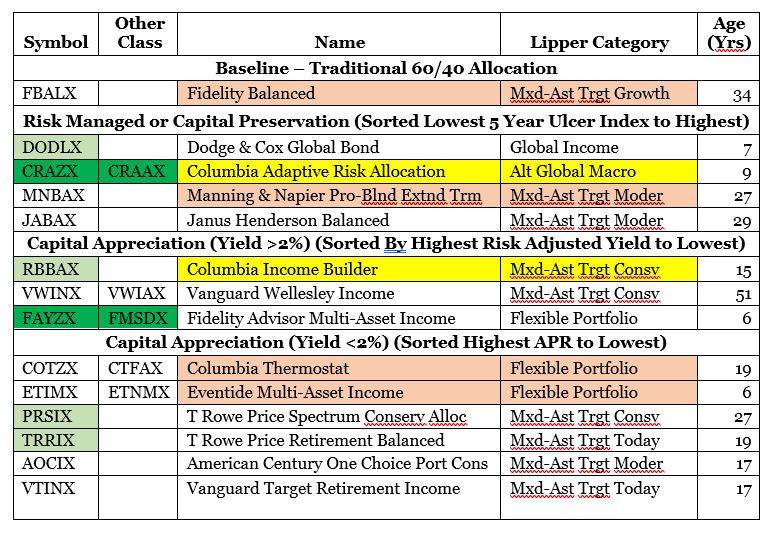
Source: Created by the author based on MFO Premium data and screeners
4. The Turn – Level 3, Derivatives and “Other Assets”
Key Point: Most One Stop Shop Fund Contenders have no exposure to Level 3 assets, but some have exposure to Level 2 assets and use derivatives. All but one fund (FMSDX) with a history of less than 15 years are excluded from being Contenders.
I read comments on the Mutual Fund Discussion Board expressing concern about risks associated with “Level 3” assets and derivatives. The Turn in this article is to research the composition of the “One Stop Shop Contenders” with respect to these assets. One of the criteria that I used to select the “One Stop Shop Contenders” was to preview an order at Fidelity to see if I get the following message:
You are placing an order for a security that requires you to execute Fidelity’s Designated Investments Agreement and also requires an Investment Objective of Most Aggressive for this account.
Two funds were excluded from making the list of Contenders because of this test. For this article, I looked into the confidence that is placed on valuing assets. In Fidelity -> Composition -> Prospectus & Reports -> Portfolio Holdings you may search for “Level 3” to find the confidence that is placed on valuing assets:
The availability of observable inputs can vary from security to security and is affected by a wide variety of factors, including, for example, the type of security, whether the security is new and not yet established in the marketplace, the liquidity of markets, and other characteristics particular to the security. To the extent that valuation is based on models or inputs that are less observable or unobservable in the market, the determination of fair value requires more judgment. Accordingly, the degree of judgment exercised in determining fair value is greatest for instruments categorized in Level 3…
The inputs or methodology used for valuing securities are not necessarily an indication of the risk associated with investing in those securities.
The Funds utilize various methods to measure the fair value of most of their investments on a recurring basis. GAAP establishes a hierarchy that prioritizes inputs to valuation methods. The three levels of input are:
■ Level 1: Quoted prices in active markets for identical securities
■ Level 2: Other significant observable inputs (including quoted prices for similar securities, market indices, interest rates, credit risk, forward exchange rates, etc.)
■ Level 3: Significant unobservable inputs (including Fund management’s assumptions in determining the fair value of investments)
From Charles Schwab, I obtained the amount the “Contenders” are short Equity (none), bonds, other and Derivatives. In Table #4, I list “Other”:
But other asset categories – including real estate, precious metals and other commodities, and private equity – also exist, and some investors may include these asset categories within a portfolio. Investments in these asset categories typically have category-specific risks.
–Beginners’ Guide to Asset Allocation, Diversification, and Rebalancing
None of the “Contenders” have a significant amount of “Level 3” assets. Table #4 looks at whether the amount of “Other”, Derivatives, and Level 2 assets is associated with risk as measured by the Ulcer Index. RBBAX went through the financial crisis with a moderately low Ulcer Index and currently has more than 10% in derivatives, but no Level 2 assets. CRAZX/CRAAX has a low Ulcer Index for the past five years, and a large number of derivatives and Level 2 assets, but was not in existence during the financial crisis. Both of the multi-asset funds, FAYZX/FMSDX and ETIMX/ETNMX have low Ulcer Indexes over five years, large amounts of “Other” assets. I prefer FMSDX over ETNMX because of the lower Ulcer Index, among other reasons. That FAYZX/FMSDX invests in “Other Assets” is an attraction to me as a potential inclusion of commodities and real estate, among others.
Table #4: Derivatives and Valuations Confidence
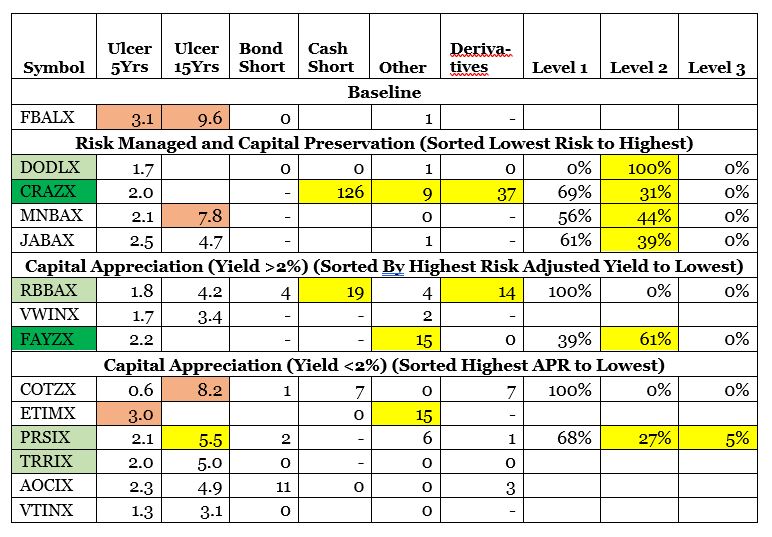
Source: Created by the author based on MFO Premium data and screeners
Based on this review, I excluded CRAZX/CRAAX because of its relatively short history even though I like Columbia.
5. Evaluating the Funds
Key Point: Table #5 shows how the funds have performed during past conditions and the Reader is free to select the funds that are believed to match their own crystal ball about future conditions.
For this article, I chose to ignore Lipper Category because fund strategies and objectives vary. The only metrics that I show based on Lipper Category are the Ferguson Metrics for Outperformance and Consistency. Consistency is defined below. I show Consistency for the life of the fund which covers three to fourteen years.
[Ferguson Consistency] Measures fund consistency based on how a fund performs each calendar year relative to its peers and hurdle rate. If a fund’s absolute return beats its peers by its hurdle rate, the fund scores a win. If it underperforms its hurdle rate, it scores a loss. Anything in-between is a push. An FCI of 1.00 is the best possible value and means the fund beat its peers by at least its hurdle rate each calendar year across the evaluation period, while an FCI of -1.00 is the worst possible value.
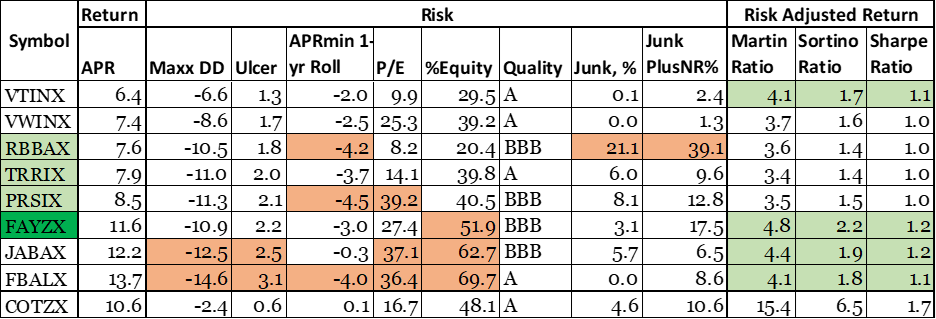
Table #5 contains the Multi-Year Metrics for the remaining Contenders. The reddish shade highlights the performance of concern while the green shade highlights a more desirable performance.
Table #5: Returns, Risk, Risk-Adjusted Return and Consistency
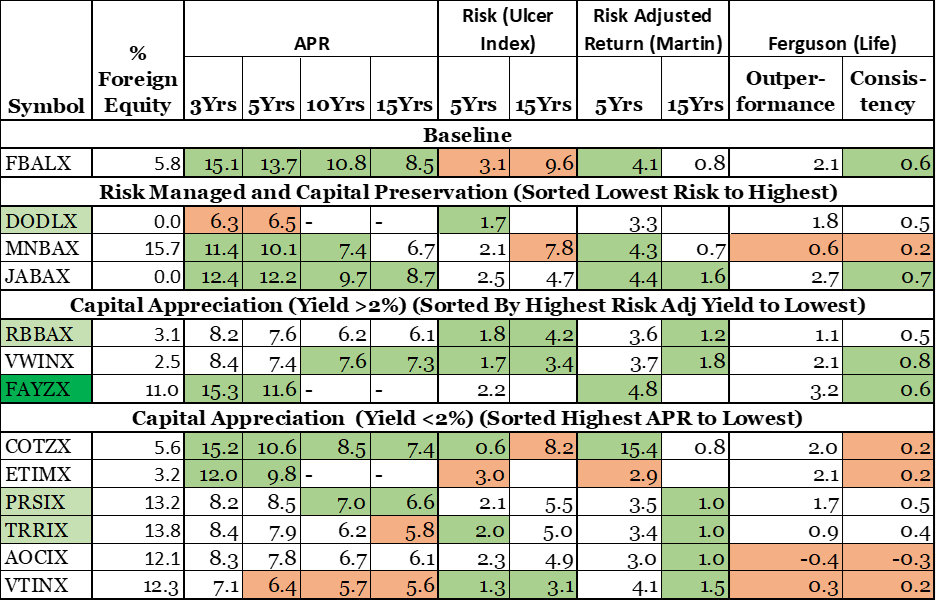
Source: Created by the author based on MFO Premium data and screeners
Table #6 contains how the funds performed during different market conditions. I expect higher rates, quantitative tapering, inflation, and higher taxes for the wealthy and corporations. My crystal ball is murky on the extent and timing.
Table #6: Fund Performance in Different Environments
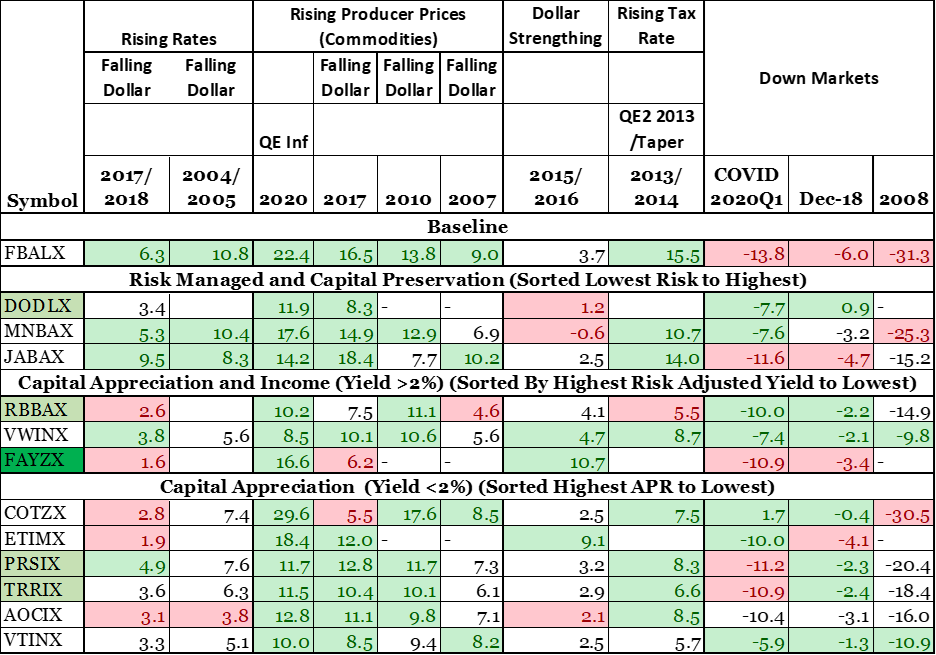
Source: Created by the author based on MFO Premium data and screeners
Figure #4 is the Efficient Frontier showing Return versus volatility for fifteen years with a small insert for the past five years. The relationship is consistent for five years, but is more erratic for the past fifteen years due to the impact of the Financial Crisis. Some assets may perform well during orderly markets, but risks become more evident during bear markets.
Figure #4: Efficient Frontier of Contenders – Five (small insert) and Fifteen Years
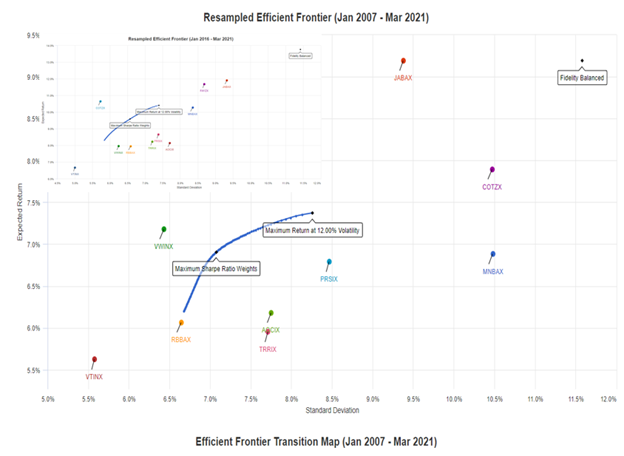
Source: Created by the Author using Portfolio Visualizer
Based on this review, I excluded ETIMX/ETNMX, MNBAX, and AOICX.
6. Final One Stop Shop Funds
Key Point: The Final One Stop Shop Funds have good multi-year metrics, and have withstood the test of time.
Table #7 is my final One Stop Shop List of Funds. These funds have good long-term track records, with the exception of FAYZX/FMSDX which is five years old, from good Fund Families. The reddish cells highlight metrics that give clues to future performance. However, as pointed out in the next section, fund strategies may have a tactical approach and allocations will change to match market conditions. The green shaded risk-adjusted returns show which funds have the highest risk-adjusted returns over the past five years.
Table #7: Final One Stop Shop Funds – Five Years
Source: Created by the author based on MFO Premium data and screeners
Columbia Thermostat (COTZX/CTFAX) is the last fund listed even though it has the lowest Ulcer Index. Its performance during the 2020 bear market was exceptional. It has changed the target allocation levels and does not offer as much downside protection. COTZX lost more in 2008 than I like. Time will tell if their strategy is right for this market.
VWINX, RBBAX, TRRIX, and PRSIX have similar returns, Ulcer Index, and risk-adjusted returns, but they are very different. VWINX takes less of a tactical approach. PRSIX has a high P/E value. RBBAX invests more in high yield bonds and less in equity. The next section may help an investor decide which is the best for their needs.
7. Summarized Fund Strategies
Key Point: The Strategies of the Final Funds are summarized below with links to the Prospectus. The use of tactical adjustments, derivatives, and alternatives are highlighted.
I have summarized the strategies from the Prospectus of Final One Stop Shop Funds. This is as important of a step as looking at historical performance to gain a glimpse of how the fund may perform in the future. I favor diversified funds that manage risk and invest in international markets. The Prospectus may be viewed in the link associated with the fund symbol.
Vanguard Retirement Income (VTINX, Target Today)
The Fund invests in other Vanguard mutual funds (underlying funds) according to an asset allocation strategy designed for investors currently in retirement. As of September 30, 2020, the Fund’s asset allocation among the underlying funds was as follows:
-
- Vanguard Total Bond Market II Index Fund 37.4%
- Vanguard Total Stock Market Index Fund 17.6%
- Vanguard Short-Term Inflation-Protected Securities Index Fund 17.0%
- Vanguard Total International Bond Index Fund 15.8%
- Vanguard Total International Stock Index Fund 12.2%
Vanguard Wellesley Income (VWIAX, Conservative Allocation)
The Fund invests approximately 60% to 65% of its assets in investment-grade fixed-income securities that the advisor believes will generate a reasonable level of current income, including corporate, U.S. Treasury, and government agency bonds, as well as mortgage-backed securities. The remaining 35% to 40% of Fund assets are invested in common stocks of companies that have a history of above-average dividends or expectations of increasing dividends.
Columbia Income Builder (RBBAX, Conservative Allocation)
The Fund invests in a combination of mutual funds and exchange-traded funds (ETFs), representing different asset classes, potentially including an allocation to alternative investment strategies to achieve a high level of current income and growth of capital. Typically, asset allocation changes will be made monthly. Investments are made by exposure to sectors, industries, issuers, and securities relative to the Fund’s indices; factors such as credit quality, interest rate outlook, and price; and Targeting certain Underlying Funds that invest in lower-quality (junk) bonds and foreign investments as attractive opportunities arise.
T Rowe Price Retirement Balanced (TRRIX, Mixed-Asset Target Today)
The fund is intended for retired investors who seek income and relative stability from bonds along with some capital appreciation potential from stocks. The fund’s “neutral allocations,” which are what T. Rowe Price considers broadly appropriate for investors during their retirement years, are 40% stock funds and 60% bond funds… These allocations are intended to reflect the need for reduced market risks, lower portfolio volatility, and an income stream throughout retirement. While the overall asset mix generally remains consistent over time, tactical decisions may be made by T. Rowe Price to overweight or underweight a particular asset class or sector based on its market outlook… The fund’s overall allocation to stocks is represented by a diversified mix of U.S. and international stock funds that employ both growth and value investment approaches and consist of large-cap, mid-cap, and small-cap stocks. The fund’s overall allocation to bonds is represented by a “core” fixed income component designed to have lower overall volatility and a “diversifying” fixed income component designed to respond to a variety of market conditions and improve risk-adjusted returns.
T Rowe Price Spectrum Conservative Allocation (PRSIX, Conservative Allocation)
The fund pursues its objective(s) by investing in a diversified portfolio typically consisting of approximately 40% domestic and international stocks; 55% bonds, money market securities, and cash reserves; and 5% alternative investments, including through hedge funds. The fund may invest up to 40% of its total assets in foreign stocks and non-U.S. dollar-denominated bonds. Bonds, which may be issued by U.S. or foreign issuers and issued with fixed or floating interest rates, are primarily investment grade (i.e., assigned one of the four highest credit ratings by established credit rating agencies) and are chosen across the entire government, corporate, and mortgage-backed securities markets. Maturities generally reflect the manager’s outlook for interest rates. The fund’s investments in alternative investments may include unregistered hedge funds or other private or registered investment companies. The fund may also gain exposure to specific asset classes through the use of options or by investing in other T. Rowe Price Funds that focus their investments in a given asset class.
T. Rowe Price may decide to overweight or underweight a particular asset class based on its outlook for the economy and financial markets. Under normal conditions, the fund’s allocation to the broad asset classes will be within the following ranges, each as a percentage of the fund’s net assets: stocks (30-50%), bonds, money markets securities, and cash reserves (45-65%), and alternative investments (0-10%). When deciding upon allocations within these prescribed limits, T. Rowe Price may favor fixed income securities if the economy is expected to slow sufficiently to hurt corporate profit growth. When strong economic growth is expected, T. Rowe Price may favor stocks. T. Rowe Price may adjust the fund’s portfolio and overall risk profile by making tactical decisions to overweight or underweight particular asset classes or sectors based on its outlook for the global economy and securities markets, as well as by adjusting the fund’s use of options and allocations to alternative investments, including through hedge funds.
Fidelity Advisor Multi-Asset Income (FMSDX, Flexible Portfolio)
Fidelity Multi-Asset Income Fund is a flexible income-oriented strategy that invests tactically across a broad spectrum of income-producing securities, ranging from investment-grade bonds to dividend-paying equities. Unconstrained by target asset allocation profiles or benchmark weights, the fund dynamically pursues attractive income and value opportunities across asset classes, while closely monitoring interest rate, equity and credit risk. This flexibility helps the fund adapt to market conditions, with the goal of generating capital appreciation in rising markets and mitigating losses in declining markets. The fund brings Fidelity’s specialists in income investing together in a single portfolio. The lead manager and co-managers work collaboratively to identify the optimal combination of securities, reflective of market conditions, in seeking to balance income potential versus risk. Each manager leverages specialized research teams to find the most compelling investment ideas within their respective areas of expertise. The managers adjust allocation among asset classes to take advantage of short-term market opportunities and strategic, longer-term opportunities.
Janus Henderson Balanced Fund (JABAX)
The Fund pursues its investment objective by normally investing 35-65% of its assets in equity securities and the remaining assets in fixed-income securities and cash equivalents. The Fund normally invests at least 25% of its assets in fixed-income senior securities. The Fund’s equity investments include, but are not limited to, common stocks, preferred stocks, and other securities with equity characteristics. A “bottom up” approach is used to select companies to invest in one at a time to determine if a company is an attractive investment opportunity and if it is consistent with the Fund’s investment policies. The Fund’s fixed-income investments include, but are not limited to, government notes and bonds, corporate bonds, commercial and residential mortgage-backed securities, and asset-backed securities. The Fund may also invest in money market instruments and commercial loans (such as bank loans). The Fund may invest in fixed and floating rate obligations with varying durations. The Fund will limit its investments in high-yield/high-risk bonds (also known as “junk” bonds) to 35% of the fixed-income portion of its net assets…
The Fund may also invest its assets in derivatives to offset risks associated with an investment, currency exposure, or market conditions and may use futures, including Treasury bond futures and interest rate swaps, to manage interest rate risk, yield curve positioning, and country exposure. The Fund may also use index credit default swaps for hedging purposes (to offset risks associated with an investment exposure, or market conditions) …
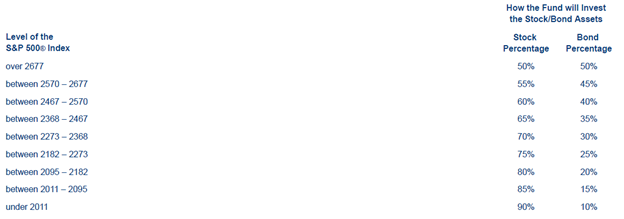
Columbia Thermostat (COTZX/CTFAX), Flexible Portfolio)
The Fund is primarily managed as a fund that invests in other funds (i.e., a “fund-of-funds”) that seeks to achieve its investment objective by investing its assets among a selected group of underlying stock and bond mutual funds and exchange-traded funds (ETFs) for which Columbia Wanger Asset Management, LLC, the Fund’s investment adviser (the Investment Manager) or its affiliates, including Columbia Management Investment Advisers, LLC (Columbia Management), serves as an investment adviser or principal underwriter (the Portfolio Funds)… Generally, the Fund’s allocation to stock funds increases as the S&P 500 Index declines and decreases as the S&P 500 Index rises. When the S&P 500 Index goes up in relation to trading range bands that are predetermined by the Investment Manager, the Fund sells a portion of its stock Portfolio Funds and invests more in the bond Portfolio Funds, and when the S&P 500 Index goes down in relation to the predetermined bands, the Fund increases its investment in the stock Portfolio Funds.
From the Fund’s inception in 2002 through April 2020, the asset allocation table in place reflected the Investment Manager’s determination that the equity market was “expensive.” The Fund’s current asset allocation table, which is set forth below, reflects the Investment Manager’s determination that the equity market is currently “normal.” The structure of the Fund’s current allocation table reflects the form that has been in place since May 1, 2020.
Closing
I like the following quote by T. Rowe Price about the TRRIX Fund. By One Stop Shop Mutual Fund Options, I narrowed the list to eight final funds that have lower risk with respectable returns, but investors should be invested with more than one fund. Investors should match risk in funds to their withdrawal needs and their expectations for the market environment over the next decade or so.
Although the fund is designed for investors already in retirement, you should be aware that it does not decrease its equity holdings and become increasingly conservative over time. As such, you may want to consider a more conservative or more aggressive approach depending on your age and specific stage of retirement. The fund is designed to be part of an investor’s overall retirement strategy, but is not intended as a complete solution to an investor’s retirement needs.
T Rowe Price Retirement Balanced (TRRIX, Mixed-Asset Target Today):
My personal investing goals have been to simplify and spend more time analyzing funds than searching for funds. These One Stop Shop Funds are added to my watchlist, and I will look at their performance each month. These funds are in line with my preference to have diversified low-risk funds where the manager has the discretion change allocations to reduce risk.
I built my Ranking System around MFO Metrics to determine the best funds for me as a conservative investor nearing retirement considering long-term performance, momentum, consistency, downside volatility, risk-adjusted returns, quality, and income. All of the One Stop Shop Funds rank in the top 20% of the approximately one thousand funds that I track. I own FMSDX, CTFAX, and VWIAX. FBALX is used as a baseline fund and is not a One Stop Shop Fund because of its higher risk. Over the past 5 years, TRRIX earns an MFO Rank of 2 which is below average. As pointed out earlier, the P/E of TRRIX is more value-oriented than PRSIX. My preference is on the value side at this time. The Composite MFO Rank is the long-term performance of the fund on a risk-adjusted basis. MFO Rank is the same metric for the past five years.
Table #8: Ratings by Author, Mutual Fund Observer, and Morningstar
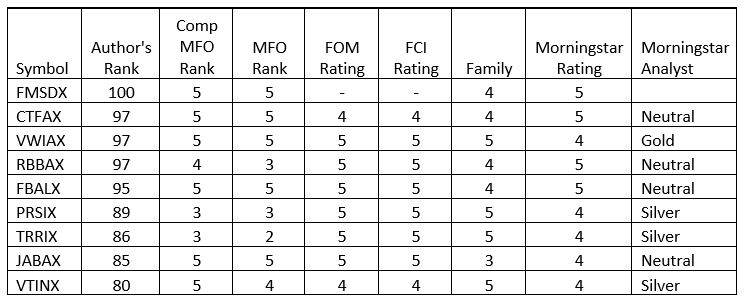
Source: Created by the Author with Mutual Fund Observer and Morningstar
Figure #5 shows four of the lower risk funds since 2007 with a small subset showing that the same funds performed in a very similar manner over the past five years. This is an illustration that how funds perform in different environments accumulate having a large impact on long term performance. Vanguard Wellesley has a great history and is a “Steady Eddy” Fund in my portfolio. As a result of writing this article, I will be looking more closely at TRRIX, and to lesser extent PRSIX and RBBAX with a skeptical eye as we may be reaching an inflection point.
Figure #5: Final One Stop Shop Low Risk Funds
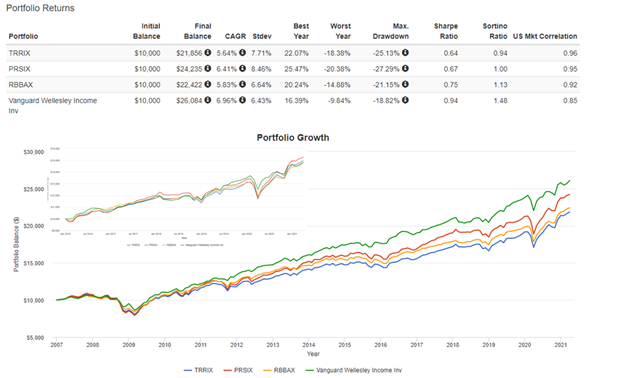
Source: Created by the author using Portfolio Visualizer
Best Wishes and Stay Safe!