


Update from the MFO archive
“Stocks for the long-term!” goes the mantra. That chant has two meanings: (1) in the (very) long-term, no asset outperforms common stock. And (2) in any other term, stocks are too volatile to the trusted so if you’re going to buy them, be sure you’re doing it with a long time horizon.
Your financial adviser hates this article. They’ll explain that following a lower equity, lower volatility strategy will absolutely kill your long-term returns. Over 20 years, $1,000 earning 6% returns will grow to $3,200. Over the same time, $1,000 earning 12% will grow to $9,600. That’s vast. No argument.
Our argument is that if your investment horizon is not measured in decades, the risk-return calculus is vastly different. For a five-year horizon, for instance, the difference is a high certainty of $1300 (the equity-lite portfolio) and high uncertainty around a potential $1700 return (the equity-heavy portfolio).
My own non-retirement portfolio, everything outside the 403(b), embeds a healthy skepticism about stocks. The strategic asset allocation is always the same: 50% equity, 50% income. Equity is 50% here, 50% there, as well as 50% large and 50% small. Income tends to be the same: 50% short duration/cash-like substances, 50% riskier assets, 50% domestic, 50% international. It is, as a strategy, designed to plod steadily.
In the past, 2004, 2010, and 2014, we’re shared research from T. Rowe Price that illustrates the dramatic rise in risk that accompanies each increment of equity exposure. Below is the data from the most recent of those articles, which looks at 65 years of market history, from 1949 to 2013.
Performance of Various Portfolio Strategies
December 31, 1949, to December 31, 2013
| S&P 500 USD |
80% Stocks 20 Bonds 0 Cash |
60% Stocks 30 Bonds 10 Cash |
40% Stocks 40 Bonds 20 Cash |
20% Stocks 50 Bonds 30 Cash |
|
| Return for Best Year | 52.6 | 41.3 | 30.5 | 22.5 | 22.0 |
| Return for Worst Year | -37.0 | -28.7 | -20.4 | -11.5 | -1.9 |
| Average Annual Nominal Return | 11.3 | 10.5 | 9.3 | 8.1 | 6.8 |
| Number of Down Years | 14 | 14 | 12 | 11 | 4 |
| Average Loss (in Down Years) | -12.5 | -8.8 | -6.4 | -3.0 | -0.9 |
| Annualized Standard Deviation | 17.6 | 14.0 | 10.5 | 7.3 | 4.8 |
| Average Annual Real (Inflation-Adjusted) Return | 7.7 | 6.8 | 5.7 | 4.5 | 3.2 |
T. Rowe Price, October 30, 2014. Used by permission.
Over those 65 years, periods that included devastating bear markets for both stocks and bonds, a stock-light portfolio returned 6.8% annually. That translates to receiving about 60% of the returns of an all-equity portfolio with about 25% of the volatility. Going from 20% stocks to 100% increases the chance of having a losing year by 350%, increases the average loss in down years by 1400%, and nearly quadruples volatility.
A fascinating real-world experiment in asset allocation points to the same conclusion. Fidelity Investments run a series of Asset Manager funds, run by the same team, which differ only in the degree of their exposure to the stock market. Asset Manager 20% has … well, 20% in stocks while Asset Manager 70% has 70% in stocks. Otherwise, the same strategy from the same manager.
The youngest of the funds in the Asset Manager series is 12 years old and the oldest is twice that. If we look at raw returns, we see a familiar and predictable pattern: more stock exposure, more total return.
Raw Returns, through January 2022
| Fidelity Asset Manager | 3 year | 6 year | 9 year | 13 year | 20 year | 25 year |
| 20% | 6.1 | 5.3 | 4.3 | 5.9 | 4.9 | 5.2 |
| 30% | 7.9 | 6.8 | 5.5 | 7.4 | – | – |
| 40% | 9.6 | 8.1 | 6.6 | 8.5 | – | – |
| 50% | 11 | 9.2 | 7.6 | 9.7 | 6.0 | 6.6 |
| 60% | 12.4 | 10.4 | 8.5 | 10.7 | – | – |
| 70% | 13.8 | 11.5 | 9.4 | 11.7 | 6.6 | 6.8 |
| 85% | 15.8 | 13.3 | 10.8 | 13 | 7.4 | – |
In rough terms, increasing your equity exposure by 10% increases your annual returns by 1%. Over 13 years, the most stock-heavy fund returned 2.2 times what the most stock-light fund did.
The question is, how much risk are you taking for the sake of a 1% gain in returns? Are the additional returns a free lunch (that is, 1% more gain with less than 1% more pain) or are you being taken to the cleaners?
Here’s the data on risk and risk-adjusted returns:
Risks and return-return measures over the longest possible period, 13 years
| Fidelity Asset Manager | Maximum drawdown | Standard deviation | Capture ratio | Sharpe ratio | Martin ratio | Ulcer Index |
| 20% | -6.2 | 4.3 | 1.4 | 1.3 | 5.3 | 1.0 |
| 30% | -8.3 | 5.7 | 1.2 | 1.2 | 4.6 | 1.5 |
| 40% | -10.2 | 7.1 | 1.1 | 1.1 | 4.0 | 2 |
| 50% | -12.2 | 8.6 | 1.1 | 1.1 | 3.6 | 2.6 |
| 60% | -14.2 | 10.1 | 0.99 | 1.0 | 3.3 | 3.1 |
| 70% | -16.2 | 11.6 | 0.95 | 0.96 | 3.0 | 3.8 |
| 85% | -19.2 | 13.8 | 0.91 | 0.91 | 2.7 | 4.7 |
Data through January 30, 2022
How do we read that table? First, the most stock-heavy fund earned 2.2x what you got with the most stock-light fund but that came at the price of tripling the maximum drawdown and volatility. All four risk-return measures – capture ratio, Sharpe ratio, Martin ratio (a sort of “Sharpe ratio for risk-conscious investors”), and Ulcer Index (“how much of an ulcer is this fund going to give you?” A metric computed from the depth and length of a fund’s worst drawdowns) – deteriorated steadily with the addition of equity exposure. Every little bit of added equity saw a worsening of the funds’ long-term performance.
Just looking at the current market cycle – the Covid bear market in the first quarter of 2020 and the insane gains that followed and the swoon in January 2022 that saw broad averages end 6% down – shows a similar pattern. The losses in the bear were 3.5 times as great in the stock-heavy fund though the returns were almost as great: 3.4 times. The highest capture ratio and the highest Martin ratio were held by the stock-light fund, while the highest Sharpe ratio came with a 30-40% exposure to equities.
Risks and return-return measures during Recent Rocket Ride
| Fidelity Asset Manager | 2020 meltdown | 2020 melt up | January 2022 | Full cycle | Capture ratio | Sharpe ratio |
| 20% | -5.4 | 14.6 | -2.1 | 7.1 | 1.3 | 0.88 |
| 30% | -7.7 | 20.3 | -2.6 | 9.5 | 1.2 | 0.90 |
| 40% | -9.7 | 25.7 | -3.1 | 11.5 | 1.2 | 0.91 |
| 50% | -11.9 | 31.1 | -3.6 | 13.2 | 1.1 | 0.88 |
| 60% | -14.1 | 36.5 | -4.0 | 14.7 | 1.1 | 0.85 |
| 70% | -16.2 | 41.9 | -4.3 | 16.0 | 1.1 | 0.82 |
| 85% | -19.0 | 50.1 | -5.0 | 18.3 | 1.1 | 0.81 |
What would have happened if you bought exactly five years ago, but were freaked out by the Covid bear? Oops. The blue field represents the five-year growth of FAM 20, each succeeding line is the performance of sibling fund with more stock exposure.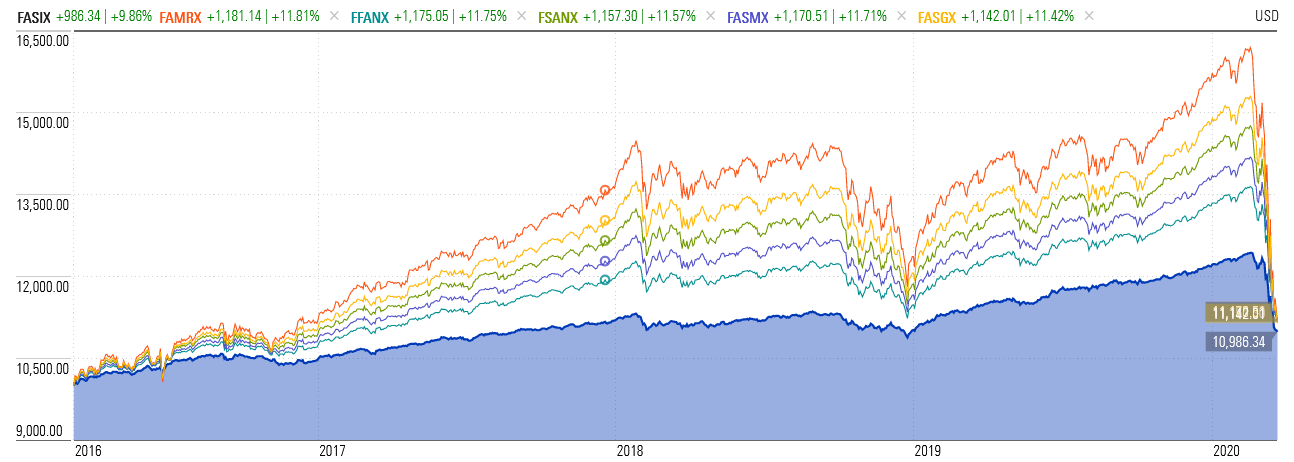
At the bear trough, all of the excess returns were effectively wiped out. FAM 20 sat at $11,000. FAM 85 at $11,200. In one 16-day stretch, the five-year gains of FAM 85 went from $16,200 to $11,200.
Bottom line
Valuations in the US stock market, measured by the Shiller 10-year CAPE ratio, are at their second-highest level in over 150 years and climbing. As we note in this month’s Publisher’s Letter, more and more investors are taking more and more rash, perhaps irrational, and sometimes almost-laughable, actions. Many pundits and others paid to convince you to buy stocks see the coming Biden Bull, most especially in sectors that might benefit from reopening and government spending on green infrastructure.
You should hope they’re right, and plan your investments around the possibility that they’re wrong. In general, that might mean dialing down your exposure to equities (a portfolio with 30% equities has, historically, returned 7% annually), shortening by a bit your bond portfolio duration, adding some strategic cash to your holdings – just in case you encounter a sudden, dramatic sale – and looking beyond recent winners and stocks beloved by the day-trading crowd.
There are no guarantees but, on average and over time, slow and steady wins, risk-conscious wins, quality wins, dividends win. You should, too.