Monthly Archives: November 2022

November 1, 2022

By David Snowball

Happy New Year

On behalf of my Celtic forebears, happy New Year! November 1 marks the traditional beginning of the Celtic year at a fire-rich festival called Samhain (or Samhuinn or something like it). It’s a curious cultural choice: the old year ends with the harvest, and the new year begins “the darker half” of the year, a period of confinement and, frequently, gnawing hunger.

On whole, the Romans chose the bright path: they began the year around March 1st when the first hopeful sprouts of spring appeared. The Celts, made of sterner stuff, looked the darkness square in the eye and shouted, “let’s party!”

Far be it from me to suggest that we’ll be facing “the darker half” of the market in the months ahead, but, really, that’s quite possible.

The argument is fairly straightforward: the people whose careers depend on your attraction to stock investing have a vested interest in the end of the bear market, and a lot of articles this month have declared that “the end is nigh.” CityWire declared, “cash levels hit 20-year highs as capitulation fears speak!” (10/18/2022). The 20-year high in question? 6.3% cash … which is to say, the average stock investor is 93.4% in the market. That’s more like “capitulation fears mumble vaguely.” Based on a Merrill Lynch investment manager survey, the story concluded, “Equities are viewed as being near maximum bear levels.”

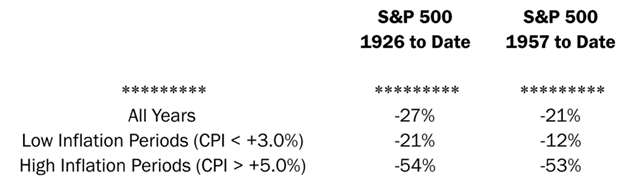
Dear Lord, dude. Here’s the chart of the market’s cyclically adjusted price/earnings ratio:

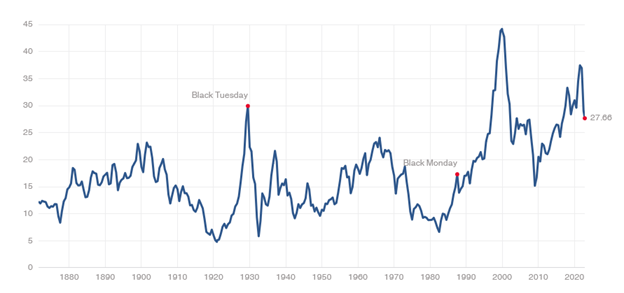
Today’s p/e is 27.6. My reading is that the market can end up with single-digit p/e ratios. So the worst case might be a 60% drop from here. Ick. The researchers at Leuthold have looked at lots of bear markets, not just the truly spectacular ones. Even returning to median market valuations – that is, getting back to but not below the long-term values – implies a titanic drop from here.

Back to the Medians

Things look dramatically better if you believe that the world before 1995 is irrelevant. If you assume that we’ll return to the happy days of near-zero interest and the guarantee of the Fed racing to save the stock market – the conditions defining that period – then we might see just another 10% decline.

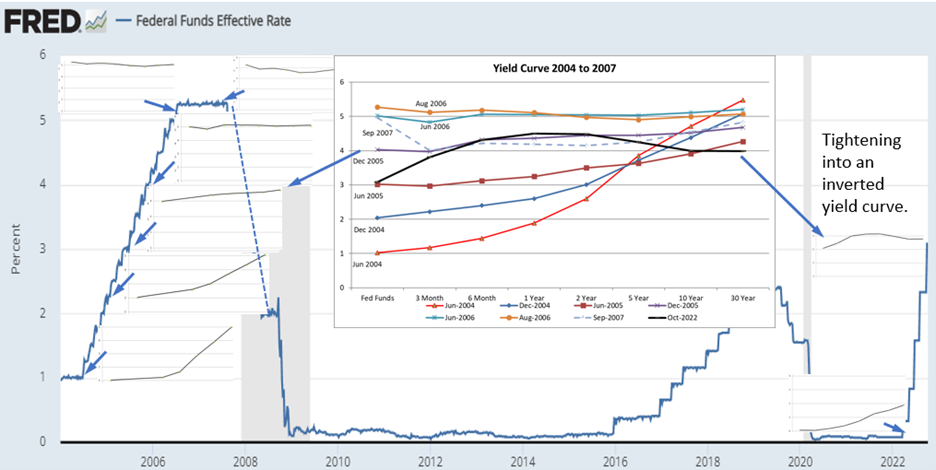
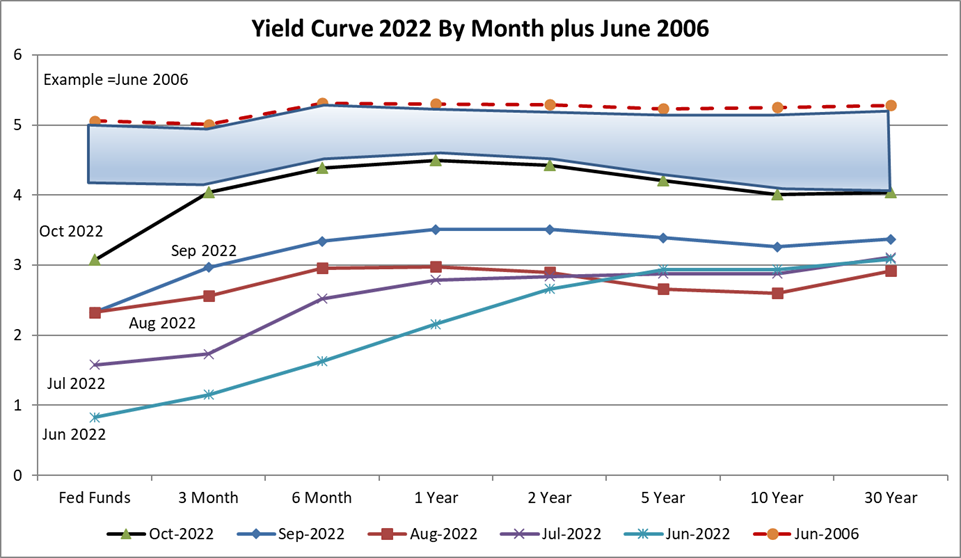
The problem is that the Fed is virtually undefeated in its fights with investors. Fight the Fed, lose.

The Fed has repeatedly signaled its resolve to break the back of inflation, and they’ll know they’ve won only when the data shows they’ve won. Two problems with that:

  1. The Fed’s actions affect the economy with a long and indeterminate lag. Essentially, the Fed does something, and the economy reacts to it between a year and two years later.
  2. Stocks respond to the end of a tightening cycle with a long and indeterminate lag. Historically, bear markets have ended a year or two after the Fed ends its rate hikes.

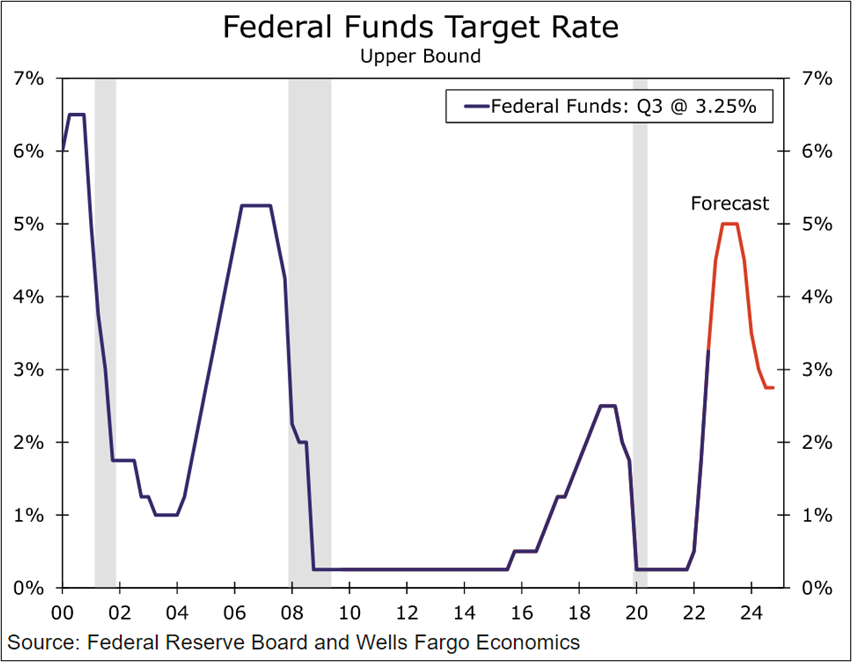
On November 2, the Fed raised its benchmark rate by another 76 basis points, and the market roared upward … until the Fed chairman started answering reporters’ questions in plain and unambiguous English. “It is very premature to think about pausing,” “We have a ways to go,” and signs that the current tightening has worked are “not obvious to me.” Finally, “We have some ground left to cover here. And cover it we will.”

Growth stocks, the prime beneficiaries of free money to underwrite speculative ventures, ended the day down 4% from their open.

All is not darkness, and we do not benefit from being ruled by fear. Bull markets end. Bear markets end. Good investors make money because they are the ones who didn’t surrender to greed in the one, didn’t surrender to fear in the other, and didn’t pretend that they could magically dance between the two. They thought through their goals, took prudent risks, and refused to embrace the old military adage, “When in danger, When in doubt, Run in circles, Scream and shout!”

Prudence and Preparation

My colleagues’ work dominates this issue, as they help you act prudently in the short term while preparing for the inevitable gains that will follow.

Charles Boccadorro documents “the worst year ever,” at least from the perspective of bond investors. Of the 109 bond funds with a record of 10 years or more, 106 are suffering through the worst year in their histories.

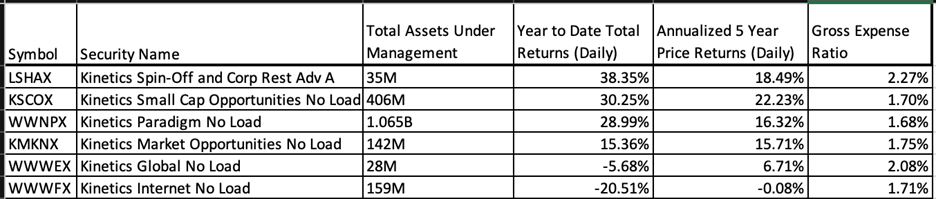
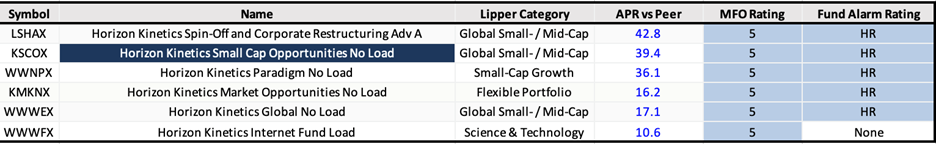
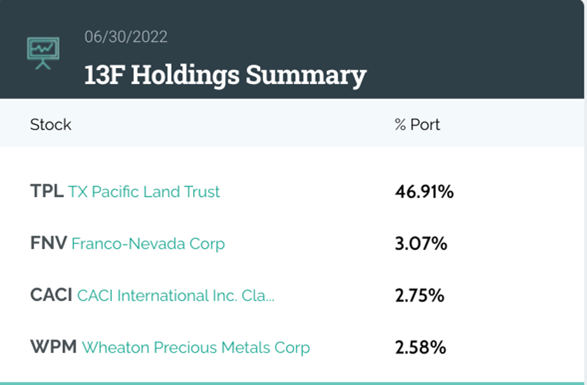
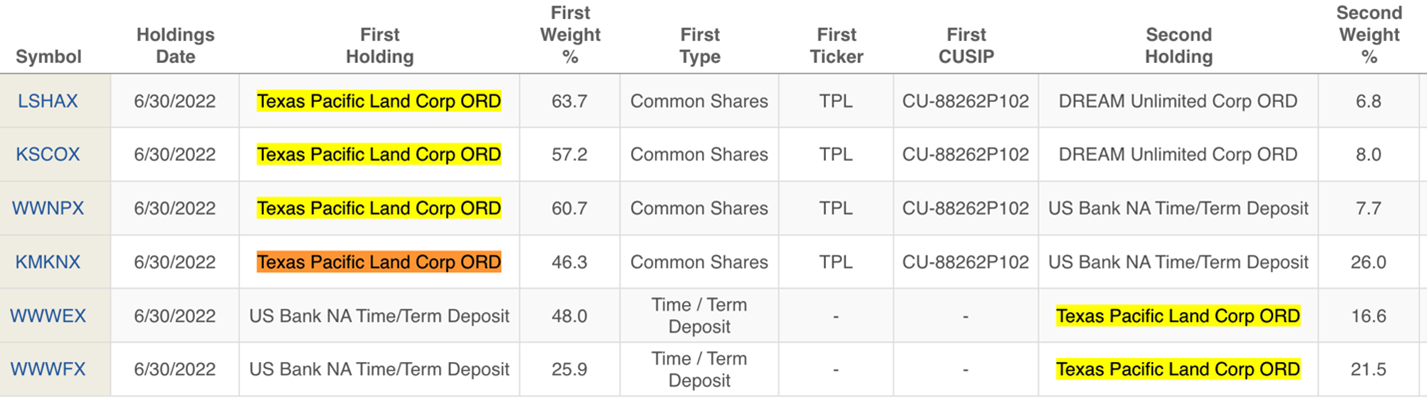
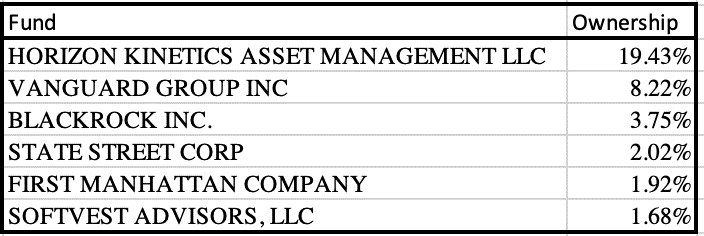
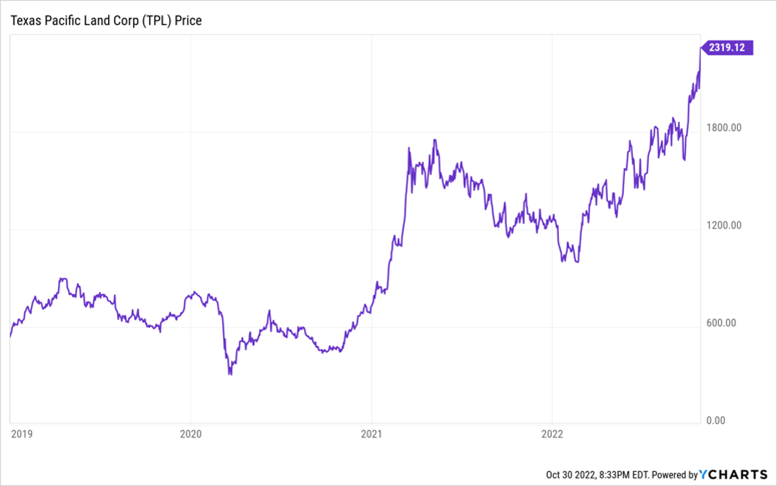
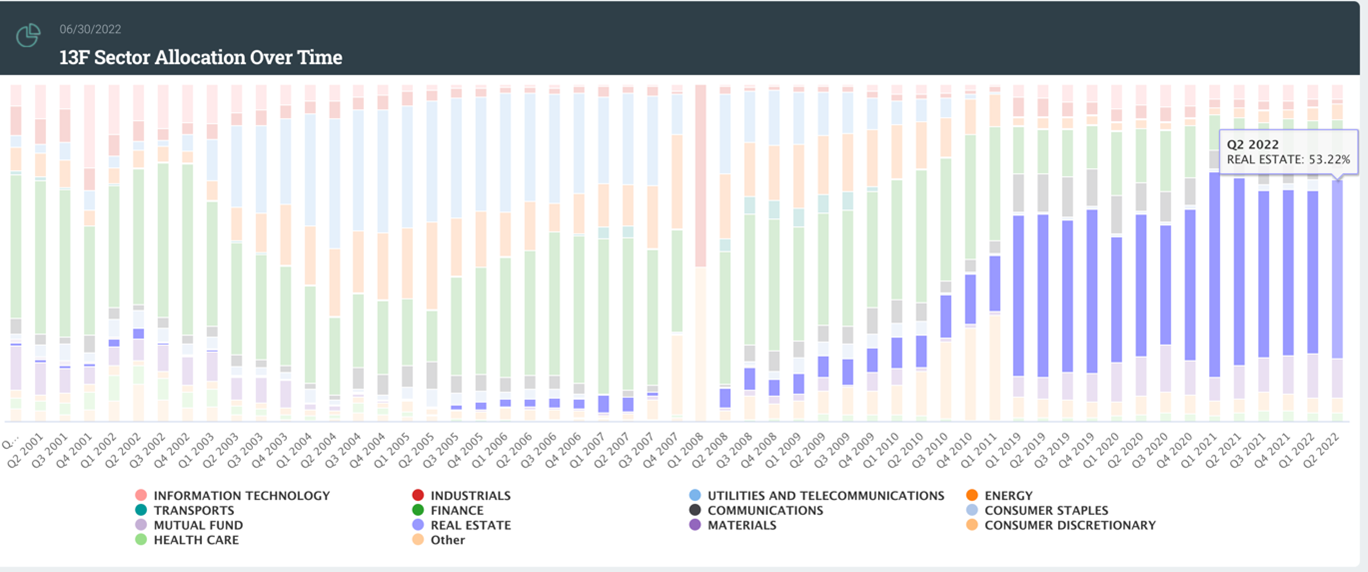
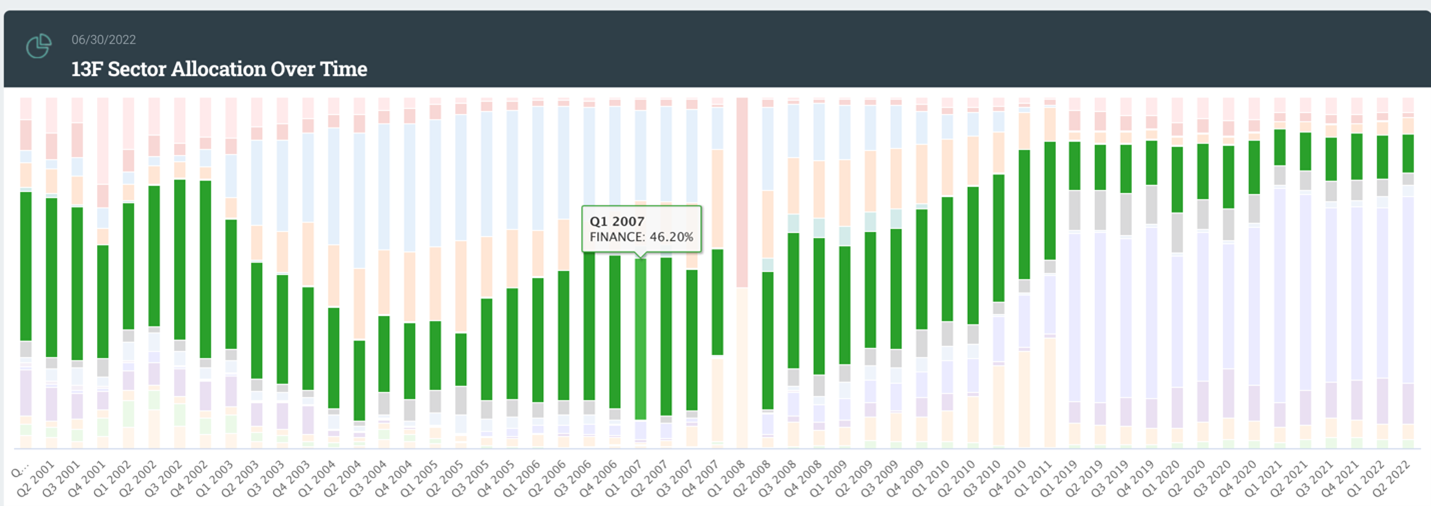
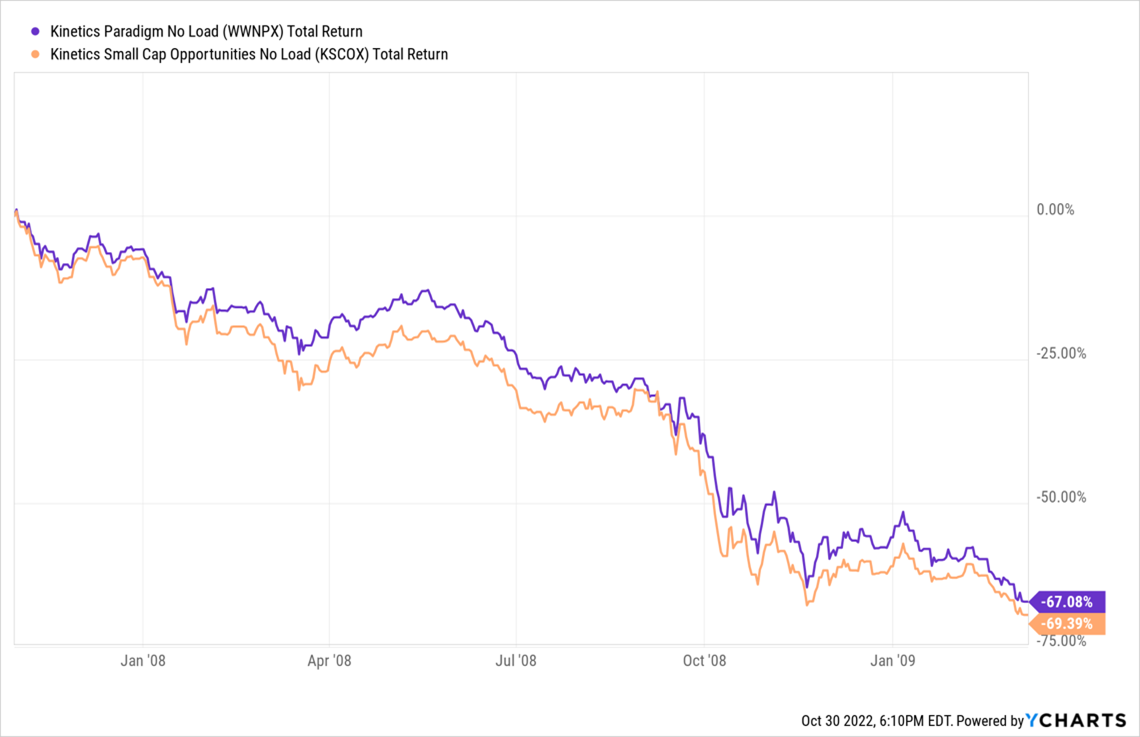
Devesh Shah highlights the strategy of the Horizon Kinetics funds, whose success is (a) amazing and (b) leveraged to the fate of a single stock. Sometimes that turns out to be a brilliant move in the long term. Devesh thinks through how to assess your risks in this case.

Mark Freeland returns to the thankless task of helping investors, most especially new investors, think through the morass around last year’s hottest idea: ESG investing. Even though politicians and marketers have both swooped in, Mark assures that all is not lost.

Lynn Bolin works through the waves that the Fed’s actions are causing and recommends the strategies and funds that might make the greatest sense in the New Year. (Ours, not the Celtic one.) He suspects there will be value in longer-dated Treasuries and rebalancing back toward equities.

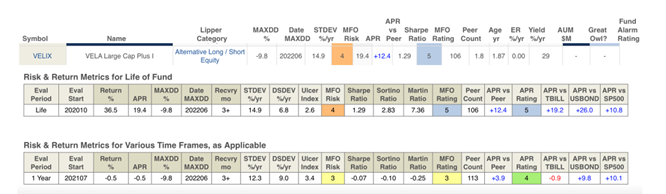
Dennis Baran returns with a profile the Vela Large Cap Plus Fund, a value-conscious large cap fund that can deploy a modest short position (the portfolio must be 80% net long and usually is 90% or above) to dampen losses and reward longer term investors.

And The Shadow, stealthily vigilant, reports on dozens of bits of industry news and changes in Briefly Noted.

My contribution is limited to the reminder that better times will return, but not necessarily for the winners of the past decade. Research Affiliates, a major investor and research firm, offers a free asset allocation tool that projects the forward-looking real 10-year returns for several dozen asset classes.

Who ends up on top?

Projected 10-year real (inflation-adjusted) returns, by asset class

International value 10.9%
Emerging market equities 8.7
European equities 8.1
US small caps 5.9
International growth 5.3
REITs 4.9
International small 4.7
US large value 4.7
US large growth 1.9
US bond market 0.7
Commodities 0.2

GMO’s gloss on those projections would be “too damned optimistic …except for emerging markets value stocks, where we project a 10.6% real returns and international small caps, which we think are about a percent higher.”

Which is to say: FAANG-less portfolios might rule.

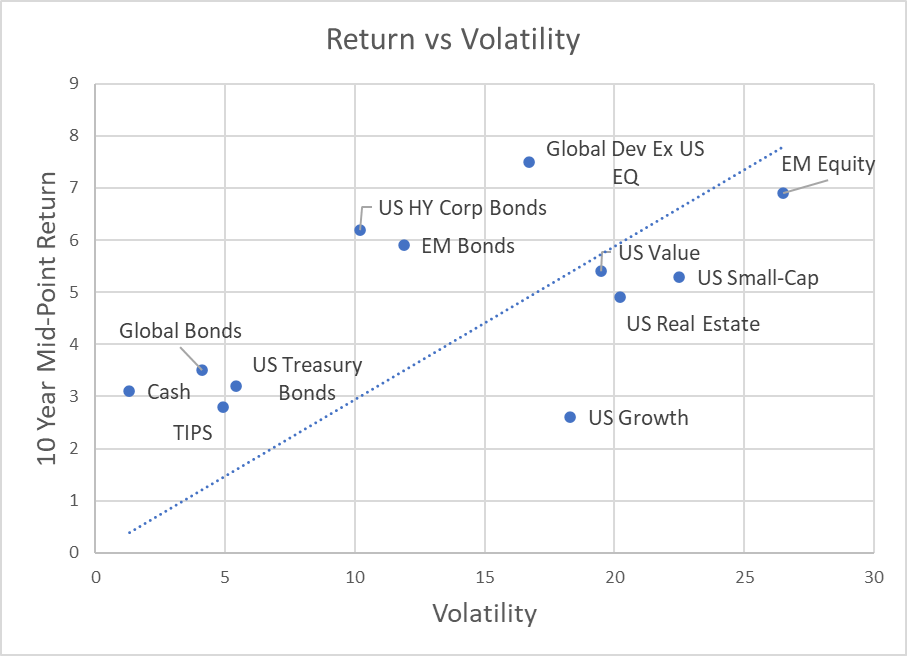
Research Affiliates also offer projected Sharpe ratios since some asset classes have volatility way out of line with their returns.

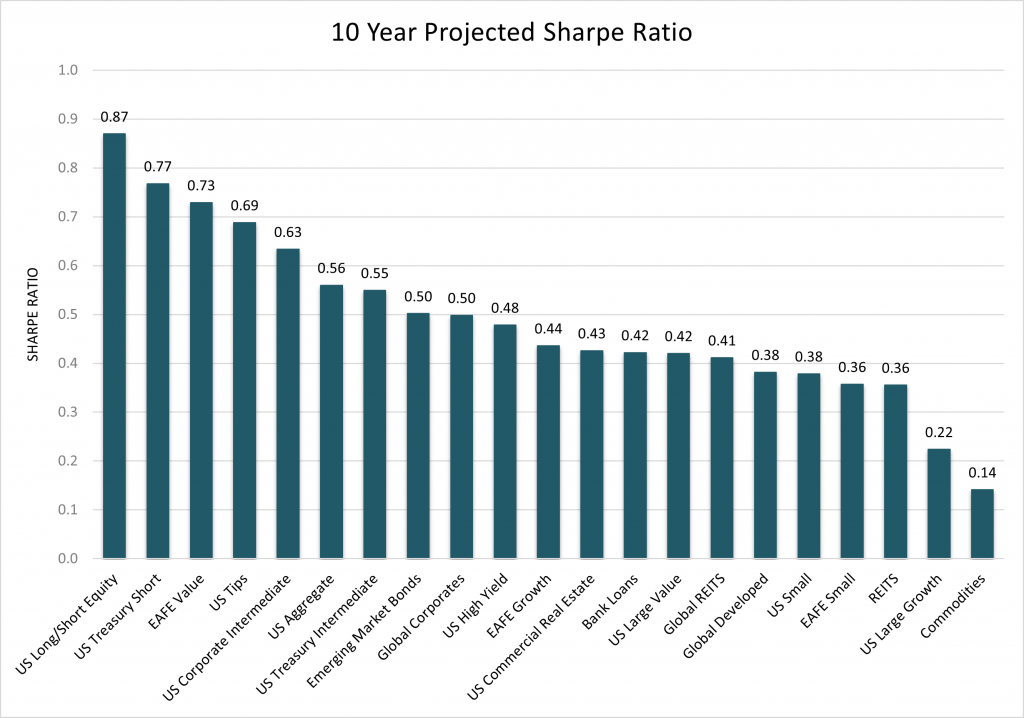
If RA is right, the best bang for your buck will come from a long/short equity position, short-term US Treasuries, and international value stocks. The least attractive niche: REITs, large-cap growth stocks, and commodities.

In December, we’ll explore the evidence for an impending resurgence of small cap stocks, most particularly those at the corner of High Quality and Value, and we’ll offer three fund suggestions for each of the most promising asset classes.

The TBO Capital

MFO has become the home of victims of a remarkable investment scam. “TBO Capital” claimed to be a private healthcare fund with rock-solid credentials, eye-watering returns, and a host of reasons to believe they were legitimate, including Linked In profiles and allied websites.

All of which were fraudulent and all of which disappeared from the web at the same moment. To date, Google News reports zero stories on the crime.

MFO members smelled something fishy back in July and started a skeptic’s thread.

Fundoholic, July 31
Anybody heard of or done business with? It’s a private Healthcare fund. I can’t seem to find anything on them…except from them..ha! Claims good returns but…? Any experiences? Thanks

Sven, July 31
Why do you trust this company? Many investors got burned badly by Bernie Mandoff. Even then, he fabricated many of his private reports.

Fundoholic, July 31
Who said I trust anyone? If you read it you’d know I was merely trying to see if anyone has any experience with them.

Crash, August 1
nope, none. never heard of them.

msf, August 1
Oodles of red flags. Starting with performance that would make Bernie Madoff blush. Not a single losing month from January 2016 through June 2022. (I can hardly wait to see it post July results.) Smooth as silk. Just look at the graph.

And yet, they did look good to hundreds of investors … in the US surely, but perhaps also globally. More recently, victims of the scam have been drawn to us, and MFO now appears (based on Google search results) to be the web’s leading source of information on the scam. There’s a long, detailed, well-researched, and ultimately painful discussion thread that lays out the crime and a separate (private) discussion board that serves as a nexus for a group (30+ and counting) cadre of defrauded investors.

To date, victims of the scam have contacted local authorities (“not our jurisdiction”), state authorities (some interest), their banks (banks of first deposit, with varied results), FINRA (“definitely not our problem”), the SEC (which appears to be pursuing the question and have interviewed many of the folks, but who are reluctant to say anything), the FBI (which might be getting prodded by the banks)

If you’re a regulator, the thread might serve as a useful source of corroborating evidence and additional victims. For journalists and investment advisors, the thread will offer both story leads and cautionary tales. For any of us, it might give us a chance to do good and to study the anatomy of a financial crime.

Thanks!

New Year’s blessings to our indispensable regulars, from the good folks at S&F Investment Advisor in lovely Encino to Wilson, Gregory, William, the other William, Brian, David, and Doug.

Many thanks to John (we’re so glad to know you’re here), Barry, and to the Ellie and Dan Fund for a really generous gift. You are wonders, one and all.

As a quick heads-up, we’ll include a short fundraising appeal in our December issue. In the face of a market meltdown and miscellaneous madness, it’s been a pretty thin year, and traditionally most of our contributions have occurred in the last 30 days of the year.

I hear tell that there’s an election coming up. Here’s a parting thought: “vote like your future depends on it, because it does. Vote for good people who seem more interested in solving problems than in howling into the dark because we need them more and more.”

See you soon!

david's signature

What is the color of your portfolio?

By Mark Freeland

One can take a cold, analytical approach to environmental (and other) concerns. One can also be motivated by an emotional connection. Being a generally dispassionate investor, I took last August to reconnect with nature, to hug a few trees, as it were.

I visited South America, going early morning birding in the Amazon,
swimming (snorkeling) with the fishes (and sea lions and tortoises) in the Galapagos,
and watching the llamas (pronounced “yamas”) hopping around in the Andes. Making them the original Yamahoppers

Regardless of why people are concerned about the environment, it’s not hard to understand why many view climate change as an existential threat, regarding all else as secondary. In October 2022, an international team led by Oregon State University researchers concluded that the Earth’s vital signs have reached “code red,” with 16 of 35 planetary vital signs they use to track climate change at record extremes. Especially for younger people, the sense of inheriting an irreparably damaged planet is remarkably widespread, with two-thirds of younger adults reporting that their concerns intrude on daily life and are damaging their mental health. For such investors, it may be best to look at funds that focus exclusively or primarily on companies actively working to improve the environment. For others, the environment may just be one of many concerns driving their portfolio.

This issue has become deeply entangled – hopelessly, some fear – in politics and marketing. Marketers anxiously rushed to market “green-lite” funds that sort of did something kinda … you know, green, in the desperate attempt to capture investors’ eyes and wallets. And just as the tide of lite-green funds reaches its max, conservative politicians rail against the idea of contaminating a purely financial decision by considering externalities such as the environment. Nineteen states have begun an inquiry into Morningstar’s conduct, and that of its Sustainalytics subsidiary and have moved against BlackRock for using “the hard-earned money of our states’ citizens to circumvent the best possible return on investment …”

For those who have not been obsessing about the color of their investment portfolio, what follows is an approachable review of some of the issues and opportunities you face in trying to decide whether, and if so, how to align your portfolio with your other priorities.

Building an ESG portfolio

Depending on how a fund or rating service defines ESG, the process of constructing a portfolio may vary. It generally involves some or all of these steps: evaluating companies in terms of environmental, social, and governance factors; combining these evaluations to either “score” companies or to define an acceptable universe of companies from which to select investments; selecting and weighting companies for a fund’s portfolio.

The choice of how each step is done and how stringently standards are applied results in a wide assortment of ESG-labeled portfolios. These range from funds where the label is little more than marketing to funds strongly focused on, to use a buzzword of the day, “impact.”

ESG factors can be evaluated through a purely financial lens and/or with an eye toward impact, e.g., carbon footprint, waste reduction, etc.

Risk exposure

Taking a purely financial perspective means looking at a company’s ESG risks and the actions it takes to mitigate those risks. An example of an institution that looks at companies only from this perspective is Sustainalytics (a Morningstar subsidiary). This short YouTube video gives an overview of its approach.

ESG financial risks vary from industry to industry. The fossil fuel industry obviously has a great deal of environmental risk exposure. Social media companies face social risks from privacy concerns, hate speech propagation, and more. The theory is that despite these differences, these risks and how the companies mitigate them can be quantified in purely financial (dollar) terms. ESG risk is treated as just another investment factor to consider, like momentum or company size.

Often a pure risk assessment methodology is applied using lax standards. As explained in this recent NY Times Op-Ed article, when the focus is on financial risk, companies like Exxon (XOM) can wind up with high ESG marks.

There is nothing inherently wrong with incorporating ESG risk into financial evaluations of companies. In this day and age, one would expect no less of a fiduciary. It is the branding of this run-of-the-mill risk assessment as ESG that is questionable. This is why the SEC is proposing more extensive disclosures by funds that market themselves as ESG.

Relative impact

Other methodologies do look at the impact that companies have. They may compare companies on an absolute scale, e.g., which company has a smaller carbon footprint independent of its business. Or they may grade companies on a curve, looking at how good they are relative to their industry peers. Effectively they accept the “best of the worst.”

Shell is included in many ESG lists, as it is one of the better (less bad) fossil fuel companies. The linked WSJ article describes how promising Shell’s plans are relative to other oil companies. A question is how well and how quickly companies fulfill their promises. A recent study reported by NPR says that Shell, along with Exxon, Chevron, and BP, are largely just pledging action, “and the companies remain financially reliant on fossil fuels.”

These are fossil fuel companies, after all, so that last comment is to be expected. Still, it gives one pause to think that some of these companies would be praised simply because they’re not as bad as their peers.

Old style screens

Rating institutions or fund companies often take a hybrid approach, incorporating financial scoring and exclusionary screening. One would expect an approach incorporating a fossil fuel screen to rule out companies like Shell. But there are chinks in this armor as well. With energy companies doing so well (at least until a few months ago), funds have been under pressure to reevaluate their screens.

The Financial Times recently wrote that the “Energy crisis prompts ESG to rethink on oil and gas. … Six percent of European ESG funds now own Shell, compared with zero percent at the end of last year, according to Bank of America. … ‘We believe [some] ESG funds are revisiting the cost of exclusion [of energy companies’ giving their underperformance in the first half of 2022” … [said BofA]”.

It went on to mention a new European law designating gas and nuclear energy as sustainable. That is consistent with the Biden administration providing new subsidies for existing nuclear facilities. From a relative perspective, gas and nuclear can be cleaner than oil and coal. (Interesting bit of useless trivia: geothermal energy comes primarily from radioactive decay; only a small portion is gravitational.)

The 20% solution

If one looks hard enough, one can find some really odd companies in ESG funds. Blackrock Sustainable Advantage Emerging Markets Equity Fund (BLZIX) even opened a position in PetroChina earlier this year (comparing its July 31st 1st quarter report with its April 30th annual report).

It’s not a large position, but it certainly raises eyebrows. My best and only guess at this point is that funds are free to invest 20% of their assets in almost anything, even if it goes against the fund’s objective. Most of the time, these quirks are not something to be concerned about, but it is still worth a quick look to see what’s lurking in your fund.

Absolute impact

Some fund companies, rather than relying on major institutions like MSCI and S&P, do their own research and are intrinsically committed to ESG objectives. Domini speaks of its “deep research in environmental and social issues.” Calvert says it “has one of the industry’s largest and most diverse teams of ESG professionals, spanning research, engagement [‘to drive positive change’], and investment solutions. Parnassus combines exclusionary screens with in-house ESG analysis and active engagement.

This is just a list of some of the usual suspects. It is not an endorsement. It’s also not intended to imply that these companies never make missteps. Parnassus continued to own Wells Fargo for at least a couple of years after the bank’s cross-selling scandal came to light. Arguably it tried to work with Wells Fargo until it felt that it could do no more. One of the seemingly contradictory aspects of active engagement is that in order to influence a company, you need to own shares. A lot of shares.

Parnassus immediately began using its substantial holding in the firm to engage top executives. We met with Wells Fargo management – including the CEO and key independent Directors – multiple times to share our perspective on events and suggest potential remedies. We also voted our proxy shares according to our responsible investment policies …

It is important to note that aside from exclusionary screens, even funds focused on making a positive impact may invest in “dirty” companies. They look at what companies are doing now to improve (as opposed to making promises) and how much of an impact that has. A large manufacturing company making significant improvements can have a bigger impact than a low greenhouse gas emissions financial services company reducing emissions further.

Conclusions

In July, Morningstar published a story describing and comparing four ESG indexes: MSCI USA Extended ESG Focus, FTSE4Good U.S. Select, S&P 500 ESG, and Calvert US Large Cap Core Responsible Index. While it doesn’t discuss the scoring method these indexes use (relative scoring), it details the specific screens used by each of the indexes and compares relative performance.

It has no surprises. The less one excludes from a fund or index, the closer its performance tracks that of its benchmark, here the S&P 500. Long-term performance tends to be neither better nor worse, just a little different.

If you have a particular concern, an industry you want to avoid, or one you want to invest in, you may be better off looking for funds specifically using your desired screens. A site that can help identify such funds is InvestYourValues.org

After doing some research for this piece, I’m not all that confident that investing in a fund simply because it is labeled ESG is much better than investing in a random fund. Look at the top holdings and sectors in a fund. If anything looks strange, dig in deeper to see how the fund decides which companies it invests in. Or invest through a family that exists to invest “responsibly” rather than through one that offers ESG funds for its investors as just some more choices.

Kinetics Mutual Funds: Five Star funds with a Lone Star Risk

By Devesh Shah

The great charm of traditional index funds is that they offer broad market exposure at a low cost. Critics deride their diversification as “diworsification,” where a portfolio automatically contains too little of the really great stuff and too much of the really poor stuff. Bold and confident managers have staked their careers – or at least their investors’ fortunes – on their ability to find one or two great (and greatly misunderstood) companies and then pour resources into them.

At its peak, the legendary Sequoia Fund entrusted 36% of its portfolio to a single stock, Valeant Pharmaceuticals. That turned out to be a poor idea when Valeant was exposed for running a scam. The idiosyncratic Bruce Berkowitz, who has never encountered the notion of self-doubt, has staked 76% of the Fairholme Fund’s portfolio on a single stock, the St. Joe Company, which has returned 0.65% annually over the past 15 years. Third Avenue Focused Credit Fund, former president David Barse’s brainchild, came into the summer of 2015 with something like one-third of its assets invested in illiquid securities, so-called “Level 3 securities.” As we reported then:

There are two things you need to know about illiquid securities: you probably can’t sell them (at least not easily or quickly), and you probably can’t know what they’re actually worth (which is defined as “what someone is willing to buy it for”). A well-documented panic ensued when it looked like Focused Credit would need to hurriedly sell securities for which there were no buyers. Mr. Barse ordered the fund’s assets moved to a “liquidating trust,” which meant that shareholders (a) no longer knew what their accounts were worth and (b) no longer could get to the money.

The firm lost something like $3 billion on the decision, and firm-wide assets are 90% below their peak. On the upside, Ron Baron’s faith in Tesla Motors is reflected by his decision to invest so heavily in Tesla that the stock occupies over 50% of Baron Partner’s portfolio despite Baron’s decision in 2021 to sell shares.

Confidence has consequences. Concentration has consequences. Sometimes good. Sometimes bad. Quite frequently spectacular.

In this essay, I would like to walk readers through one of the most confident and concentrated positions in the retail fund world, the case of Horizon Kinetics which has placed a spectacular bet – firm wide – on a single stock. My argument is not that their bet is imprudent or that it will harm their investors. Instead, my argument is that the managers’ decisions carry the potential for spectacularly atypical performance. Investors, current and prospective, need to understand the decision that their managers have made, need to understand its potential consequences, and to assess its appropriateness for their portfolios. To help you get there, we’ll by explaining who the players are, what they’ve done, what implications it might carry, and how a prudent individual investor might weigh it all.

Horizon Kinetics (“Kinetics”), an asset manager offering a range of investment products – mutual funds, ETFs, SMAs, alternative investments, etc. – is having a very good year. The managers predicted and planned for the return of inflation. The 2nd Quarter commentary is a must read. One of their investments – Texas Pacific Land Corp (“TPL”) – has been a huge winner since they started buying the stock in Q1 of 2019. What makes their portfolio an interesting case study now (and also highly risky) is the amount of TPL stock Kinetics has come to hold. TPL’s position size could lead to glory or seriously hurt the asset manager and the funds it manages.

Who is Horizon Kinetics?

From the website:

Horizon Kinetics LLC is a fundamental value, contrarian-oriented (fact-based) investment adviser. Founded on the belief that a short-term investment approach, widely adopted with the modernization of financial markets, ultimately produces sub-optimal returns, we believe that investors are better served not by taking more risk (emphasis by author) but by extending their investment time horizon, which affords far wider ranges of opportunity and valuation than are available to time-constrained investors.

The asset manager has been around since at least the mid-1990s, and the founding partners – Murray Stahl, Steven Bergman, and Peter Doyle – continue to play significant investing and management roles.

How much money do they manage?

According to their website, Horizon Kinetics Asset Management is an independently owned and operated investment boutique with approximately $5.3 billion in assets under management as of March 31, 2019….

Whalewisdom.com (who have kindly offered Mutual Fund Observer a complementary subscription) is a website that tracks funds and companies states: Their last reported 13F filing for Q2 2022 included $4,775,957,000 in managed 13F securities.

Kinetics website says: Horizon Kinetics Asset Management LLC (“HKAM”) serves as investment adviser to Kinetics Mutual Funds, Inc. (the “Funds”), a series of nine mutual funds with combined assets under management of $1,564M as of December 31, 2021. Significant firm and employee capital is invested alongside our investors.

How have their mutual funds performed in 2022 and in the last 5 years?

Source Ycharts.com

Kinetics mutual fund returns are spectacular. As a comparison, note that the S&P 500 is down 17% for the year thus far and has a 5-year annualized return of 8.6%. Thus, Kinetics funds have beaten “the market” significantly and very much earned their 2% Gross Expense Ratios. The funds have also crushed their peers.

Since investors are tempted to chase past winners by allocating cash to winning funds, it’s important to understand the source of those victories. Understanding past returns is a way to decide if the returns are sustainable.

What does the asset manager’s portfolio look like?

Whalewisdom.com tracks the Horizon Kinetics portfolio at the Asset Manager level (including all their reportable investments). This is a snapshot of Kinetics’ top positions as of June 30th, 2022:

Source: Whalewisdom.com 13F filing summary

TPL accounts for a glaring 46.91% of the Manager’s total holdings. As of Q2, that was worth $2.2 billion, and since then, the rally in TPL stock has led to the position being worth $3.2 billion. It seems like the TPL stock holding accounts for the lion’s share (maybe, more than 100%) of the past returns for the asset manager. More information about their other holdings and the accompanying rationale can be found in their Commentary linked above.

The Kinetics funds have uniformly high-to-huge allocations to TPL.

MFO Premium database and search engine

The eyebrow-raising position sizes of 63.7% in the Kinetics Spin-Off funds do not diminish the very large position weights in other funds: 57.2%, 60.7%, 46.3%, and 16.6%. The most surprising position is that Texas Pacific Land has a 21.5% position weight in the Horizon Kinetics Internet Fund!!

Horizon Kinetics, the asset manager, is the LARGEST shareholder in The Texas Pacific Land Corp, holding just short of a fifth of the company. The next three holders are Index Funds – Vanguard, Blackrock, and State Street.

Source Whalewisdom.com

Concentration Risk

Regardless of how good of a company The Texas Pacific Land Corp might be or what Horizon Kinetics investment philosophy might be, is it worth it for one position to be 46% of the asset manager’s portfolio? This is what we call CONCENTRATION RISK. Kinetics philosophy, “investors are better served by not taking more risk,” is perhaps not entirely aligned with a large, risky position in one stock. Yet, it’s easy to understand why they hold it: to make money.

Source: Ycharts

The stock is up 70% this year alone. Who would want to miss that? Yet, profitable as the stock is, a mutual fund with daily liquidity needs to ask – is this a lot of concentration in stock?

Apologists might argue that Buffett has 40% of Berkshire Hathaway’s portfolio in a single stock, Apple, so perhaps our concern is overblown. The observation is true, but the Berkshire case is not comparable.

First, there are vast differences in the stocks’ liquidity. TPL has a market cap of $17 billion, while Apple has a market cap of $2.5 Trillion. Each day, 1% of Apple trades in the market (about $25 Billion), while just over $100 million of TPL trades (or less than 0.6%) is traded in the secondary market. More to the point, if the largest shareholder of TPL needed to sell $1 billion on the stock, would it be that easy to sell? Who would Kinetics sell the stock to? At what price?

Secondly, Berkshire operates under different rules than a mutual fund does. Kinetics’ has a responsibility to exchange fund shares for cash on demand. Meanwhile, Berkshire Hathaway has permanent capital and float.

Similarly, they might argue that other successful funds had uber-concentrated positions. The Baron Partners Fund once committed over 50% of its portfolio to Tesla and made a mint on the investment. Ron Baron had made $6 billion in profits on Tesla. Citywire’s John Coumarianos reported, “In January (2021), Morningstar downgraded the $7bn Baron Partners fund (BPTRX) from Bronze to Neutral because of its then 47% stake in the electric automaker.” 

A few months later, founder Ron Baron became concerned over the impact of the position. On March 8th, 2021, Ron Baron told CNBC that he sold the share due to “risk management. . . where [the stock] became a very large percentage of two funds that I manage – became over 50% of those funds’ assets – and I thought risk mitigation was appropriate.” Despite that selldown, Tesla’s subsequent price appreciation means it’s back to 52% of the portfolio.

Position concentrations have consequences. Running a fund management business with daily liquidity has consequences. Clearly, fund investors who want to maximize returns must be celebrated, provided the gains can be banked. Ron Baron was able to sell Tesla and book profits. Will Murray Stahl be able to do that with the TPL position? He is not only the biggest investor but also sits on the Board of Directors at TPL. He must be working overtime trying to figure out an exit plan. Or, maybe, he is not worried at all and is confident that investors in his fund actually want him to take such bets. If you are an investor in the funds, you better be on board with this concentration risk.

Texas Pacific Land Corp: a “Pure Play in the Permian Basin.”

The website: Texas Pacific Land Corporation is the corporate successor to Texas Pacific Land Trust, which was formed in 1888. TPL is one of the largest landowners in the State of Texas, operating under two business segments: Land and Resource Management and Water Services and Operations.

It had a Quarterly Net Income of $119mm. Its last 12 months’ net income is $379mm. Let’s assume the forward 12 months’ income will be $500mm. At a market cap of $17.9 Billion, it trades at north of a 35 multiple to Earnings.

Neither do I understand the fundamentals of this company, nor do I know how to value the stock. My focus is simply on the fund that holds it and the accompanying risks to investors.

The blog – The Texas Pacific Land Trust Investor – has a very detailed and thoughtful commentary on the company and stock and makes for an interesting read.

Horizon Kinetics has thought a lot about what kind of company thrives during inflation. They’ve concluded that companies with tangible assets are a starting point. But these mining companies can have high expenses from labor and energy. Instead, they prefer asset-rich companies to earn royalties by renting out the land and earning a slice of the revenue. TPL fits that profile perfectly. 53.22% of TPL’s portfolio is to be invested in “Real Estate” as of Q2, 2022.

Source: Whalewisdom.com

Going for the Jugular

There is something admirable about fund managers who take a contrarian, research-based, long-term stand in order to go for the jugular. But there comes the point when the outcome becomes binary. They better win because otherwise, they are going to lose.

History offers lessons for the careful reader. Before the 2007-2008 crisis, the financial sector was considered a money machine. Kinetics’ position in the Financial sector circa Q1 2007 was 46% of their overall portfolio.

Source: Whalewisdom.com

In the bloodbath that ensued, from Q4 2007 to the lows in March 2009, two Kinetics funds went down by two-thirds in price.

Source: Ycharts

Position concentrations in any one sector (and especially one stock) can be extremely injurious to the portfolio’s health. Investors need portfolio managers with conviction to make money, but such conviction also brings risk. And sometimes, the risk doesn’t go in one’s favor.

The Past Need Not Repeat.

Human ingenuity cannot be underestimated. There is no reason to believe that the fund managers at Kinetics are going to repeat the mistakes of the past. This time around, it does look like inflation is stickier, energy prices will be higher for longer, and what they own is prime Permian property. All good, but they need to figure out how to bank some of their gains. In the current risk-reward setup, the problem is that the role of luck has become way too big for the fund holders of Kinetics. One mistake, and the floor is unknown. Diversification may not make one very wealthy, but it does prevent the worst-case scenario. With large concentration risk, you are either right or wrong. No in between.

Conclusion

I am not savvy enough to know the future path of inflation, energy prices, TPL’s business model, Kinetics investing acumen, and the various creative paths that can be pursued to exit the position. But there are certain rules of portfolio management and position concentration, which, once transgressed, are enough of a precondition for investors to become hyper-alert.

When investors invest in a fund, they assume the fund manager is on the same side. But that is complicated to know. Do we want a fund manager maximizing profits or a fund manager managing risks prudently? Sometimes, the goals are mutually exclusive.

If they manage to pull a rabbit, Kinetics is on its way to the Hall of Fame of investment returns in an otherwise awful market year. If Lady Luck decides not to cooperate, the risk for investors in Kinetics funds could be substantial. At the minimum, the large position concentration size of TPL in Kinetics portfolio seems diametrically opposite to their belief that investors are better served not by taking more risk…

Kinetics Fund investors be hyperalert.

Federal Reserve Rate Hikes – The Next Nine Months

By Charles Lynn Bolin

2023 Sleeping Bears in Waiting

We are in a classic late stage of the business cycle with the Federal Reserve raising rates to reduce demand in order to control inflation. What is different this time is that the inflation is likely to be higher for longer because it is a global issue resulting from a combination of factors, including COVID-related supply chain disruptions and related stimulus, an extended period of low-interest rates and easy monetary policy, and the Russian invasion of Ukraine that, in addition to being a tragic loss of lives, also disrupted supply chains. I look at the base case of the Federal Reserve raising the Fed Funds (FF) target rate in November and December and holding the rate relatively constant next year. The next six to nine months are key to determining if inflation is falling, the impact of rising rates on the economy, and the probability and severity of an anticipated recession.

This article is divided into four sections:

Economy (Employment, Inflation, Consumers, Earnings)

Federal Reserve (Rates, Yield Curve, Recession)

Risks (Solvency, Valuations)

Strategy (Treasury Ladders, Bond Funds, Stock Market)

Economy

Key Point: The economy is relatively strong but slowing. The Federal Funds rate is significantly below the inflation rate. The Federal Reserve will most likely continue raising rates aggressively this year and slow down increases next year until inflation moderates.

In “Odds of Recession in Next 12 Months Now 63 Percent in Survey of Economists,” Zach Schonfeld, at The Hill, reported that 63% of economists in a Wall Street Journal survey believe there will be a recession starting in the next twelve months. Personal Consumption Expenditures (PCE) make up about 68% of the gross domestic product. Advance Retail Sales (RSXFS) provide useful insight into PCE. These two metrics have been relatively flat since June and suggest that the economy is slowing, but a recession is not starting during the next few months. YCharts has a chart of recession probabilities showing that the probability of a recession in August 2023 is twenty-five percent.

The spread between inflation and the Federal Funds rate is near a fifty-year high. The Personal Consumption Expenditures Price Index (PCEPI) available in the St. Louis Federal Reserve database has been relatively flat for the three months ending in August. Howard Schneider at Reuters reported in “Exclusive-Fed’s Bullard Favors’ Frontloading’ Rate Hikes Now, With Wait-And-See Stance In 2023,” that St. Louis Fed President James Bullard believes rate hikes should be front-loaded to contain inflation, and the estimates of recession risk may be distorted, in part by inflation.

Smells Like Recession: Fitch Says an Early ’90s-Style Slowdown Is Just Around the Corner” in Fortune by Prarthana Prakash describes rating agency Fitch’s projection that the gross domestic growth will be a low 0.5% next year. Fitch expects a short, mild recession because the financial system is in relatively good shape. Azhar Igbal and Nicole Cervi at Wells Fargo describe an accurate method of estimating the severity of a recession in “One Spread to Rule Them All: Is Recession Coming?”. They conclude, “if the 10-year/1-year spread is inverted for 12 consecutive months or longer, there is an 80% chance that the upcoming recession will be longer than historical standards.” This metric is not signaling a severe recession but is worth monitoring over the next six to nine months.

Federal Reserve

Key Point: The short end of the yield curve will be a key indicator of the timing of the Federal Fund rate raises and cuts as well as the severity of the next recession.

The mandates of the Federal Reserve are often oversimplified to maintaining full employment and low inflation, but there are additional responsibilities of ensuring the safety and soundness of the nation’s banking and financial system, protecting the credit rights of consumers, maintaining the stability of the financial system, and containing systemic risk in financial markets among other financial services. These can be found in more detail at the Board of Governors of the Federal Reserve System.

The Federal Funds rate is the primary tool of the Federal Reserve to achieve its objectives. It is set by the Federal Open Market Committee (FOMC) and is the rate at which commercial banks borrow and lend their excess reserves to each other overnight. The median forecast from the September FOMC is to raise the Fed Funds rate to 4.4% by the end of the year and plateau at 4.6% next year without rate cuts until 2024. Wells Fargo provided its “US Economic Outlook: October 2022” and updated its forecast for two rate hikes before the end of the year and two smaller ones in the first quarter, as shown in Figure #1.

Figure #1: Wells Fargo Projection of Federal Funds Rates

Figure #2 contains a comparison of what the yield curve was doing during the 2004 to 2007 rate hikes in six-month increments compared to 2022. The inset in the middle shows the earlier yield curves (thin lines) to the current yield curve (thick black line). The Federal Reserve continued to hike rates until longer duration rates were flat, with the Federal Funds (FF) rate around July 2006. The rate was held relatively constant through September 2007, when the yield curve became strongly inverted, and the Fed began lowering the FF rate in November 2007. Currently, the short end of the yield curve is not inverted, and the Fed is tightening with the longer end of the yield curve inverted.

Figure #2: Federal Funds Rate Changes and Yield Curves

Source: Created by the Author Using the St Louis Federal Reserve Database (FRED)


I created Figure #3 to show a range of likely interest rates along the yield curve before the curve fully inverts, warning of an imminent recession. The blue-shaded area lies between the current yield curve and the yield curve as of June 2006. I expect the Federal Funds rate to rise close to 4.4% by the end of this year and possibly to 5% by mid-2023. Intermediate (one year to five years) rates may be close to plateauing. After the next two rate hikes, this year may be a good time to extend the duration of Treasury ladders into the two-to-five-year range. When the short end of the yield curve inverts, the risk of recession rises, and the Federal Reserve is likely to contemplate easing rates.

Figure #3: 2022 Yield Curves with Possible Range of 2023 Rates

Source: Created by the Author Using the St Louis Federal Reserve Database (FRED)

Source: Created by the Author Using the St Louis Federal Reserve Database (FRED)

Risks

Key Point: Solvency of companies with low-profit margins and high valuations are two risks examined.

Zombie companies are those that don’t generate enough profits to service their debts, and with rising borrowing costs for high-yield debt, the number of zombie companies is increasing. Giovanni Favara, Camelia Minoiu, and Ander Perez-Orive at the Federal Reserve estimate in “US Zombie Firms: How Many and How Consequential?” that in 2020 approximately nine percent of public companies were zombies. According to Will Daniel at Fortune, David Trainer, the CEO of the investment research firm New Constructs, believes there are now roughly 300 publicly-traded zombie companies. The number of zombie companies may now be around 13%, as estimated by Goldman Sachs. The American Bankruptcy Institute shows that Commercial Chapter 11 Bankruptcies have been rising since May compared to last year.

John Butters, Vice President and Senior Earnings Analyst at FactSet, updated the “S&P 500 Earnings Season Update” on October 21st, with twenty percent of the companies reporting actual results. The blended earnings results for those that have reported and estimates for the remaining companies for the earnings growth rate for the third quarter is 1.5% compared to 2.8% at the end of the third quarter (September 30th). For perspective, Multipli estimates that the price-to-earnings ratio of the S&P500 has fallen from thirty-six percent at the beginning of 2021 to twenty now. It is still historically high and falling rapidly.

In Figure #4, I composite several popular methods of estimating stock market valuations, including market capitalization to gross value added, Tobin Q Ratio, Cyclically Adjusted Price to Earnings Ratio, Dividends in relationship to the 10-year treasury, and the Rule of 20. A strongly positive value is favorable, and a strongly negative value is unfavorable. These various methods take into account economic productivity, asset replacement costs, business earnings cycles, interest rates, and inflation.

Figure #4: Stock Market Valuations

Source: Created by the Author Using the St Louis Federal Reserve Database and S&P Dow Jones Indices


Both the bear markets in 2000 and 2008 were severe. The recession associated with Technology was mild, and the recession associated with the housing bubble and financial crisis was severe. Whether the US experiences a mild or severe recession, I believe the bear market has further to extend as earnings disappoint and valuations compress.

In their Monthly Economic Outlook, Vanguard estimates that US large-cap equity returns will average a historically low 4.0% to 6.0% over the next decade. If correct, a five percent yield on US Treasuries is very attractive. In Figure #5, I used Vanguard’s mid-point estimate of 10-year returns and volatility to show returns versus volatility. The chart shows that Global Developed Markets have higher potential returns than US stocks which is due to valuations.

Figure #5: Vanguard Estimated 10-Year Returns vs Volatility

Source: Created by the author using Vanguard Monthly Economic Outlook


Strategy

Key Point: The first half of 2023 offers an opportunity to extend the duration of fixed income. A recession and associated bear market offer opportunities to rebalance to bring stock allocations up to target and to perform a Roth Conversion.

My target allocation to equities is fifty percent within a range of thirty-five to sixty-five percent depending upon the business cycle, and is currently near my minimum of thirty-five percent. My allocation to money market funds, short-term treasuries, and short-term certificates of deposit has increased to over twenty-five percent. I have timed maturities of fixed-income ladders to provide a steady flow of money to reinvest depending upon market conditions.

Here are some of the funds that I favor over the next year after satisfying my needs for buying fixed income.

  • Columbia Thermostat (CTFAX/COTZX). As of September 30th, it had about 35% allocated to stocks, up from 10% on August 15th. The further stocks fall, the more it allocates to stocks which may work out well if a recession does occur next year. The weighted average bond maturity is 7.9 years.
  • Of the traditional mixed asset funds, I like actively managed Vanguard Global Wellesley (VGYAX). It is a global mixed asset value-oriented fund with a stock-to-bond ratio of about 40/60 and about sixteen percent allocated to US equities. I plan on increasing allocations as the interest rate increases slowly.
  • Fidelity New Millennium (FMILX, FMIL). It has lost 7% year-to-date compared to 20% for the S&P 500. I will increase allocations when the market falls further in 2023. For more information, please see Fidelity Actively Managed New Millennium ETF (FMIL) in the MFO September Newsletter.
  • If a recession does occur next year, then I will be adding growth and technology funds as well as beat-down funds as the yield curve indicates a recovery is on the horizon.

Closing

I keep a ten-million-dollar bill from the Reserve Bank of Zimbabwe in my office to remind me of the potential dangers of inflation. The next six to nine months will provide insight into inflation, the probability of a recession occurring, and the severity of the recession.

As I wrapped up this article, I ran across “JPMorgan President: Recession’ Price to Pay’ to Beat Inflation” in Newsmax Finance. The article is about JPMorgan President Daniel Pinto, who grew up in Argentina and experienced hyperinflation. He believes that the Federal Reserve is following the correct path of monetary tightening. Mr. Pinto believes that a recession will occur, but the severity remains in question. He concludes earnings expectations are too high, as well as some market valuations and does not believe that market is bottoming out yet.

Worst Year Ever

By Charles Boccadoro

All fund risk and return metrics, ratings, and analytics were uploaded to MFO Premium today, 31 October, Halloween 2022. We used Lipper’s Friday data drop to get an early peek … and today markets seemed tame enough, so numbers should be pretty close to month’s end.

October was a decent one for equity funds, especially value. The Dow was up an extraordinary 14%. But still not enough to get back above water. Well, unless you consider Berkshire Hathaway (BRKA) a mutual fund, which many savvy investors do … it’s up 4-5% year-to-date (YTD). The Dow: -8%.

Here’s a quick summary, YTD, showing retractions of some key equity indexes from MultiSearch/PreSet Screens/Reference Indexes, worst on top:

On the fixed-income side, it’s been the worst year ever for bond funds. Few bond funds today existed 40 years ago, which nominally marks the beginning of the (now finished) bond bull market; therefore, most investors have never experienced anything like the retractions this year in bond funds. For perspective, the popular BlackRock iShares Core US Aggregate Bond ETF (AGG) was launched 19 years ago.

Today, of 109 core bond mutual funds and ETFs that are at least 10 years old, 106 have experienced their worst calendar year returns ever … significantly worse. Below are some notable examples. (Those highlighted in blue are MFO Great Owls, which means they are as good as it gets.)

BlackRock iShares 20+ Year Treasury Bond ETF (TLT) is down 33%. As is Vanguard Long-Term Treasury Inv (VUSTX). Both are down 40% from their highs 27 months ago. Dan Ivascyn’s Allianz PIMCO Income Inst (PIMIX) is down -11% … twice as bad as its 2008 retraction.

Bottomline: The Great Normalization continues … with the current bear now in its 10th month.

If there is a silver lining, bond yields are finally going up.

We will update ratings this weekend with the final month-ending October data.

Vela Large Cap Plus I (VELIX)

By Dennis Baran

Let’s be blunt!

Why bury the lead?

“90% of everything is crap.”


That’s Ric Dillon, the fund’s PM, quoting Theodore Sturgeon (1918-85), a science-fiction author frustrated by a prevailing thought of his time– that works of science fiction are universally bad.

His defense of his chosen field, argued in a New York University lecture hall, can be boiled down to a simple argument.

  • The law can be universally applied.
  • To movies, tv shows, scientific studies, politicians, opinions
  • And yes– to stocks

Why It Matters

While a broad generalization, Sturgeon’s Rule is a helpful reminder that investors should focus on owning funds with high quality and those, which in Mr. Dillon’s opinion, achieve higher returns with lower risk in the long run.

Go Deeper

Objective and strategy

The VELA Large Cap Plus Fund invests primarily in long and short positions in US large capitalization stocks with a targeted exposure of 80-100% of net assets.

The fund invests in companies that the Adviser believes are undervalued securities and shorts securities that are overvalued or have worse prospects than other investment opportunities.

It will also utilize derivatives to generate additional income in an attempt to limit the potential risks from short selling and for downside risk management.

The fund’s primary benchmark is the Russell 100 Index; its secondary is the S&P 500.

The fund’s long positions and their equivalents will generally range between 100% and 140% of the value of the fund’s net assets.

The fund’s short positions will generally range between 0% and 40% of the value of the fund’s net assets.

Adviser

Advisor VELA Investment Management, LLC

Founded in 2019, The Adviser also manages five Separate Account Strategies plus open-ended VESMX (a small cap value fund), VEITX (an international fund), and VIOIX ( an equity-oriented fund.

The family is rated Top by Mutual Fund Observer Premium (MFOP.)

Managers

The fund utilizes a full team approach. The PMs retain analyst responsibilities and use the title along with PM. Seven PMs total and four associates/analysts support the team as well. 

Ric Dillon, CFA, one of the firm’s founders, serves as CEO and CIO and is joined by Lisa Wesolek, and Jason Job, CFA.

Together, they bring more than 90 years of combined investment experience to VELA.

They believe that vertically integrated wealth and asset management services and a strong grounding in a valuation-centric investment philosophy would uniquely enable the firm to meet their goal of delivering long-term results for their clients.

Early in his career, Mr. Dillon served as a portfolio manager for Loomis, Sayles & Company in Detroit, where it became the top-ranking office in the company with the large cap and Large Cap Plus value funds.

The Large Cap Plus fund that he started ranked No. 1 in its Lipper category after its first 12 months of existence.

In the 1990s, he founded Dillon Capital Management, serving as President and CIO until Loomis, Sayles & Company acquired the company, where he returned to work as a portfolio manager.

In 2000 he founded Diamond Hill Investments a public company (DHIL) based in Columbus, Ohio. During his tenure as CEO there, Diamond Hill ranked in the top 1% of all public companies in the US in terms of shareholder total return, with an annualized total return of 27%.

He retired from Diamond Hill Capital Management, Inc. as a portfolio manager effective June 30, 2018 and served as a portfolio manager for the Diamond Hill Long-Short Fund since its inception in June 2000, an experience he brings to VELIX.

Mr. Dillon received an MBA from the University of Dayton, an MA in Finance, and a BS in Business Administration from Ohio State University.

Kyle Schneider, CFA

Mr. Schneider is the co-portfolio manager of the Large Cap Plus Strategy and a research analyst. Prior to joining VELA, Kyle was a research analyst at Diamond Hill Capital Management covering healthcare.

He has industry experience since 2007, including various roles at Citigroup.

Kyle holds the Chartered Financial Analyst (CFA) designation, an MBA from the University of Chicago, where he graduated as a Wallman Scholar with High Honors, and a BS in Finance from The Ohio State University.

Go Deeper

Lisa Wesolek, CAP®, a co-founder of Vela with Mr. Dillon, serves as President and Chief Operating Officer and brings special expertise.

She has held senior leadership positions across firm operations, sales, client service, marketing, product development, finance, mergers and acquisitions, brand initiatives, product solutions and data-driven initiatives in the investment industry.

Also, she has worked with mutual funds, mutual fund complexes, mutual fund Boards, Institutional and Retail investors inclusive of all investment type structures such as hedge funds, hedge fund of funds, ETFs, separate accounts, commingled funds, private equity funds, all active funds and index funds in her thirty-plus year career.

She received an MBA from Ohio State University and a BS in Finance from Franklin University.

Strategy and closure

The managers anticipate closing the fund at 5B AUM.

Active Share 89% (Source Fact Check)

Management’s Stake in the Fund

Although limited evidence states that an invested board of trustees is a powerful predictor of risk-adjusted returns, none of the independent trustees have invested in the fund.

Among interested trustees, Lisa Wesolek has invested over 100K and Jason Job 10-50k. As of the January 14, 2022 SAI, no interested trustees owned shares of the fund. Lisa Wesolek owns 100K+ and Jacob Job 10-50K.

Opening date

September 30, 2020

Minimum investment

$2500

All of the Vela funds are offered at Vanguard with a $20 TF. I “lobbied” Vanguard to have them available because I knew that they could meet their listing requirements, which they did.

 Schwab offers the fund for a $49.95 TF.

Expense ratio

Gross and net 1.87%. The total operating expense ratio inclusive of short dividends, interest charges, and the expense ratio of the MMF sweep is 1.87%. The assets under management are $53 million, as of July 2023. 

Comments

The story behind the VELA name and original inspiration comes from Vela (pronounced “vee-luh”), a constellation in the southern sky whose name is Latin for the sails of a ship. 

Vela was originally part of a larger constellation, the ship Argo Navis, which was one of the 48 classical constellations first listed in the 2nd century.

This historical connection further parallels their time-honored investment approach.

A description of the word “VELA” as an acronym: A Valuation Centric approach, practiced by Experienced Investors with a Long-Term Temperament, guided by company policies designed to create an Alignment of Interests with our clients.

 At VELA, the employees only invest in the firm’s strategies alongside their clients. They pay the same fees our clients pay in the mutual fund.


While Morningstar shows the fund as a large cap blend, it’s also categorized by Refinitive as an alternative long-short equity product.

However, it’s very important to note that while the managers do not object to being viewed as an alternative product, the fund’s net exposure is 80% at a minimum and typically in the 90%s, which is different from most long/short equity products that feature a wider range of net exposure.

Go Deeper

For example, as of September 30, 2022

  • Cash was 13.7%
  • Long positions 93.53
  • Short positions -8.18%
  • Options .92%

Because Refinitiv does not include a large cap blend category,  we’ll examine the fund in the Alternative Long-Short category.  

As of 202210, the category features 119 funds in the category by best APR lifetime.

Accordingly, its 13.2 APR ranks 5th in the category.

VELA Fund Returns (as of September 30, 2022, %)

  Inception YTD One-year Since inception
VELIX 09/30/2020 -13.44 -6.80 13.19
Russell 1000   -24.59 -17.22 4.12
S&P 500s -23.87 -23.87 -15.47 4.83

VELIX Lifetime Risk-Return Metrics Since 202010

  Maximum drawdown Standard deviation Downside deviation Average APR Sharpe ratio Martin ratio Sortino ratio Ulcer index
VELIX -15.3 15.7 8.7 13.2 .81 2.81 1.46 4.5
Lipper peer group -16.6 13.4 9.0 4.0 0.27 1.16 .56 6.6
S&P500 -23.9 18.9 12.9 4.8 0.23 0.49 .33 8.8

Why It Matters

  • Its Risk-Return Metrics are 96% better than its category and the S&P 500.

Comments

In structuring the fund, Mr. Dillon notes that about 20% of asset managers achieve returns which meaningfully outperform both the relevant benchmarks and passive indexes over the long term.

He has taken each of those instrumental characteristics in achieving returns among the top quintile into each account in structuring VELA.

Second, fundamentally outperformance requires a portfolio which differs substantially from the index.

Thus, active managers like VELA are likely to produce short-term results different than passive alternatives, which are designed to mirror a given index.

Third, a valid investment approach is also necessary, and some approaches that are not time-tested may lack efficacy over the long term.

VELA’s valuation-centric philosophy was pioneered by Benjamin Graham nearly 100 years ago and taught to Warren Buffett, who has refined and popularized this philosophy for more than 60 years.

A core tenet of Graham’s philosophy is the belief that good businesses with sound fundamentals will continue to grow over the long term.

In the short term, financial markets are often driven by “noise” or emotional volatility as investors react based on limited information.

Conversely, the managers’ experience suggests that over time, the same markets tend to revert toward a more rational mean which is more closely aligned with each company’s underlying value.

Finally, most importantly, outperformance requires an active manager to align their business interest with the client’s return objectives.

Firm size, fees charged, and employee accounts are typically sources of misalignment.

To best align the firm’s interests with those of their clients, each VELA colleague commits to investing solely in VELA strategies for each asset class in which the firm participates.

VELIX Valuation-Centric & Long-Term Oriented Approach

Based on this idea, Mr. Dillon and his team actively seek out companies with experienced management teams, favorable industry position, and strong balance sheets.

Starting with a large investable universe, they apply a rigorous research process to narrow their focus to the companies in which they have the highest long-term conviction.

They invest when the price they can pay for those companies offers an attractive, risk-adjusted expected return based on their estimate of intrinsic value.

While prices may fluctuate over the short term, they believe these companies will likely continue to show positive growth over time.

Alignment of Interests

Of equal importance to the individual investment decisions they make on behalf of their clients are the organizational choices and commitments which guide their management of investment portfolios.

Most importantly, the business should be structured so that the motivations of the investment manager are aligned with clients’ interests.

In Mr. Dillon’s experience, incentive conflicts most often occur with regard to portfolio size, fees charged, and employee accounts.

With respect to portfolio size, managers’ revenues increase by growth in assets under management, and such growth may continue past a point which is beneficial to existing clients.

Similarly, fees and market impact costs will negatively impact a client’s returns.

Employee accounts can create misalignment, such as devoting time to one’s own account, which is time not utilized for clients’ accounts.

Firm Size

“Size is an Anchor to Performance” ~ Warren Buffett

The above quote directly captures a paradox of investing: good firms attract clients; however, if not disciplined in closing investment strategies, their growing assets under management will eventually diminish returns to investors.

Why It Matters

Each strategy needs to be limited in size so the portfolio manager can execute without undue burdens of market impact costs.

As assets in a portfolio grow, so does the likelihood that a given transaction will meaningfully impact the price of a security.

For example, if you decide to purchase the shares of a stock that is currently at $10.00, and when you finish your average cost is $10.25, then the market impact cost is $.25, or 2.50%.

Assuming this as an average for all transactions, and the portfolio turnover is 20% per year, the market impact costs are .50% annually (2.50% x 20% = .50%).

When added to a management fee of 0.75%, this becomes a meaningful figure.

At VELIX current size, the managers have a broader investible universe than their larger peers with minimal market impact costs.

  • As of September 30, 2022, VELIX size was $30.4M
  • Total firm AUM were $$278.5M.

Bottom Line

VELIX offers investors the opportunity to use a conservative and successful large cap blend fund from a management team with a strong track record and credentials from a firm aligned with its shareholders.

  • It’s one reason I own it.
  • It’s worthy of your consideration.

Fund website

www.velafunds.com offers complete information about their funds and strategies.

Briefly Noted . . .

By TheShadow

Aristotle Capital Management is to buy Pacific Asset Management, the specialist credit manager with about $20 billion AUM from Pacific Life. Afterward completion, Aristotle will be renamed Aristotle Pacific Capital.

Lazard US Convertibles Portfolio is in registration. The principal investment strategy is to invest in convertible securities economically tied to the United States. The portfolio managers/analysts will be Arnaud Brillois, Andrew Raab, Emmanuel Naar, and Zoe Chen. Open share total annual portfolio operating expenses after reimbursement will be 1%.

Natixis Investment Managers is selling its liquid alternatives manager, AlphaSimplex, to Virtus Investment Partners. 

Matthews Emerging Markets ex China Active ETF is in registration. The principal investment strategy is to invest in emerging market countries, excluding China. The lead manager will be John Paul Lech; the co-manager will be Alex Zarechnak. Expenses have not been stated at this time.

Neuberger Berman has converted its $196 million Neuberger Berman Commodity Strategy Fund into the Neuberger Berman Commodity Strategy ETF.

Parnassus Growth Equity Fund is in registration. The principal investment strategy is to invest in large-sized growth companies. Andrew S. Choi will be the lead portfolio manager, Shivani Vohra will be the portfolio manager. Total Annual Operating after Expense Reimbursement will be .84% for investor share class; institutional share class will be .63%. 

Vanguard International Explorer Fund has eliminated TimesSquare Capital Management, LCC, as one of its investment advisors. Following a transition period, the current investment advisors will be Wellington Management Company LLP, Schroder Investment Management North America Inc., and Baillie Gifford Overseas Ltd. The benchmark utilized by the fund is being changed in an effort to improve investors’ ability to assess performance relative to peer funds.

Small Wins For Investors

The JPMorgan Small Cap Equity Fund will re-open to investors effective October 26. The fund is rated four stars by Morningstar. The fund has been closed to most new investors since December 30, 2016. The fund is managed by Don San Jose and Daniel J, Percella. Mr. San Jose has been with the fund since 2007, with Mr. Percella joining the fund in 2014.  

Closings (and related inconveniences)

On October 25, 2022, Eaton Vance Emerging Markets Debt Fund closed to new investors.

RiverPark Short Term High Yield Fund closed again to new investors on October 12, 2022. That was pretty much inevitable since it’s a limited capacity strategy with a remarkably appealing risk-return profile. It’s repeatedly posted the highest long-term Sharpe ratios of any fund in existence, and we spent time in both September and October urging folks to check it out.

Old Wine, New Bottles

Transamerica High Quality Bond Fund is being reorganized into the Transamerica Short-Term Bond Fund. The reorganization is expected to occur in the fourth quarter of 2022.

The Dustbin of History

Catalyst Pivotal Growth Fund will liquidate on or about November 3,

Catalyst Interest Rate Opportunity Fund will liquidate on or about November 3,

Ken Heebner, 82 and the manager of Capital Growth Management LP, which oversees and manages three mutual funds, has decided to close up shop and liquidate the three mutual funds he managed. CGM Focus Fund, CGM Mutual Fund, and CGM Realty Fund will cease operating on November 30, 2022.  

Mr. Heebner began managing the CGM Mutual Fund in 1981. During the mid-1990s, he managed the CGM Realty Fund, CGM Focus Fund, CGM Mutual Fund, CGM Development Fund, CGM American Tax Free Fund, and CGM Fixed Income Fund. The CGM Development Fund was eventually reorganized in 2008 into the CGM Focus Fund. Both the CGM American Tax Free Fund and CGM Fixed Income Fund were liquidated by June 14, 2002.

The $24 million Inspire Faithward Large Cap Momentum ETF loses faith on November 28, 2022.

Victory NewBridge Large Cap Growth Fund will liquidate on or about December 28.

Sometime in Q4 2022, Transamerica High Quality Bond will be absorbed by Transamerica Short-Term Bond . The date is not final because of the need for shareholder approval.

Valkyrie Balance Sheet Opportunities ETF was snatched away on Halloween Day, 2022.

VECTORSHARES Min Vol ETF will become even less volatile on November 20, 2022, the date of its liquidation.

Walthausen Focused Small Cap Value Fund will close to investors on or about November 21.

Manager changes

Which fund? What changes, when?
BlackRock Fixed Income Global Opportunities (77 flavors of the fund, counting all of the domestic and international share classes!) BlackRock Strategic Income BlackRock Sustainable Total Bond (and 18 other funds) Bob Miller, head of America’s fundamental fixed income, leaves in early 2023. Mr. Miller is responsible for $107 billion in fixed income assets, and so a half dozen other people are being shuffled or promoted in anticipation of his departure.
Columbia Small Cap Growth Dana Kelly joins Wayne Collette and Daniel Cole. Since taking the reins of the fund in 2006, Mr. Collette has had nine co-managers.
Engine No. 1 Transform Climate ETF Portfolio Managers: Christopher James, Eli Horton, and Molly Landes will be jointly and primarily responsible for the day-to-day management of the Fund’s portfolio.
Fidelity Advisor Strategic Income Fund Daniel Ushakov has joined as a co-manager.
Fidelity Mid-Cap Stock John Roth, who has been with Fidelity for a quarter century, intends to retire on December 21. He’ll be succeeded by Nicola Sherwood.
Fidelity New Millennium Fund Fidelity New Millennium ETF John Roth, who has been with Fidelity for a quarter century, intends to retire on December 21. Daniel Sherwood will take over
Janus Henderson International Opportunities Co-manager Dean Cheeseman is out after about 3.5 years on the fund, replaced by George P Maris. The move is interesting primarily because it reflects company-wide layoffs that will eventually eliminate about 100 professionals.
MFS Research International Portfolio Effective December 31, 2022, Victoria Higley will no longer serve as a portfolio manager. On that same date, Nicholas Paul becomes the manager.
PIMCO Total Return Bond (and about 10 others) Scott Maher is taking a personal leave of absence. PIMCO has declined to elaborate on what that means. During said absence, CIO Dan Ivascyn fills in on the team.
Vanguard International Explorer Fund   The Board of Trustees booted TimesSquare Capital Management, LLC as an investment advisor to the Fund and reallocated the assets they’d managed to two existing advisers, Wellington Management and Baillie Gifford Overseas.  
Vaughan Nelson Small Cap Value Fund Effective March 31, 2023, Stephen A. Davis has elected to retire and will no longer serve as a portfolio manager.  Chris D. Wallis will continue as the lead portfolio manager of the Fund, and James Eisenman will remain co-manager.
Virtus Stone Harbor Emerging Markets Corporate Debt Fund, Virtus Stone Harbor Emerging Markets Debt Fund, Virtus Stone Harbor Emerging Markets Debt Allocation Fund, Virtus Stone Harbor High Yield Bond Fund, Virtus Stone Harbor Local Markets Fund William Perry is stepping down from all of the funds on March 30, 2023
Virtus Zevenbergen Innovative Growth Stock Fund Effective December 31, 2022, Leslie Tubbs, CFA will retire. Succession plans have not yet been announced.