Monthly Archives: April 2022

April 1, 2022

By David Snowball

Dear friends,

Spring is a time when we celebrate the small and uncertain signs of hope. Weighed down by the exhaustion of war and politics, pandemic and winter, we look happily at the first crocus to spring which shoulders its way through the autumnal leaf mold. We’re reluctant to invest too much in it, knowing that winter has not yet suffered its final defeat. (Here, anyway. Last Wednesday’s upper 60s was followed by Thursday’s measurable snow.)

And still, it’s in our nature to hope. That’s what makes the prospect of tomorrow bearable. And so I hope that the 1.7 million new jobs created so far this year, and the fall in unemployment to 3.6%, is a signal of sustainable economic vitality.

I hope that the Ukrainian people prevail quickly. Their fortitude in the face of heartbreaking losses heartens many. The suffering now is immense and the rebuilding will consume decades, but that’s an argument to act rather than to despair. Consider donating, as we’ve done on several occasions in the past month, to the UN Commission for Refugees or one of the groups vetted by Charity Navigator. There are small children who will remember the conflict for the rest of their lives; I’m hopeful that they have cause to remember the unstinting kindness of strangers as well.

In this issue …

My colleagues engage in a sort of wide-ranging conversation while inviting you along.

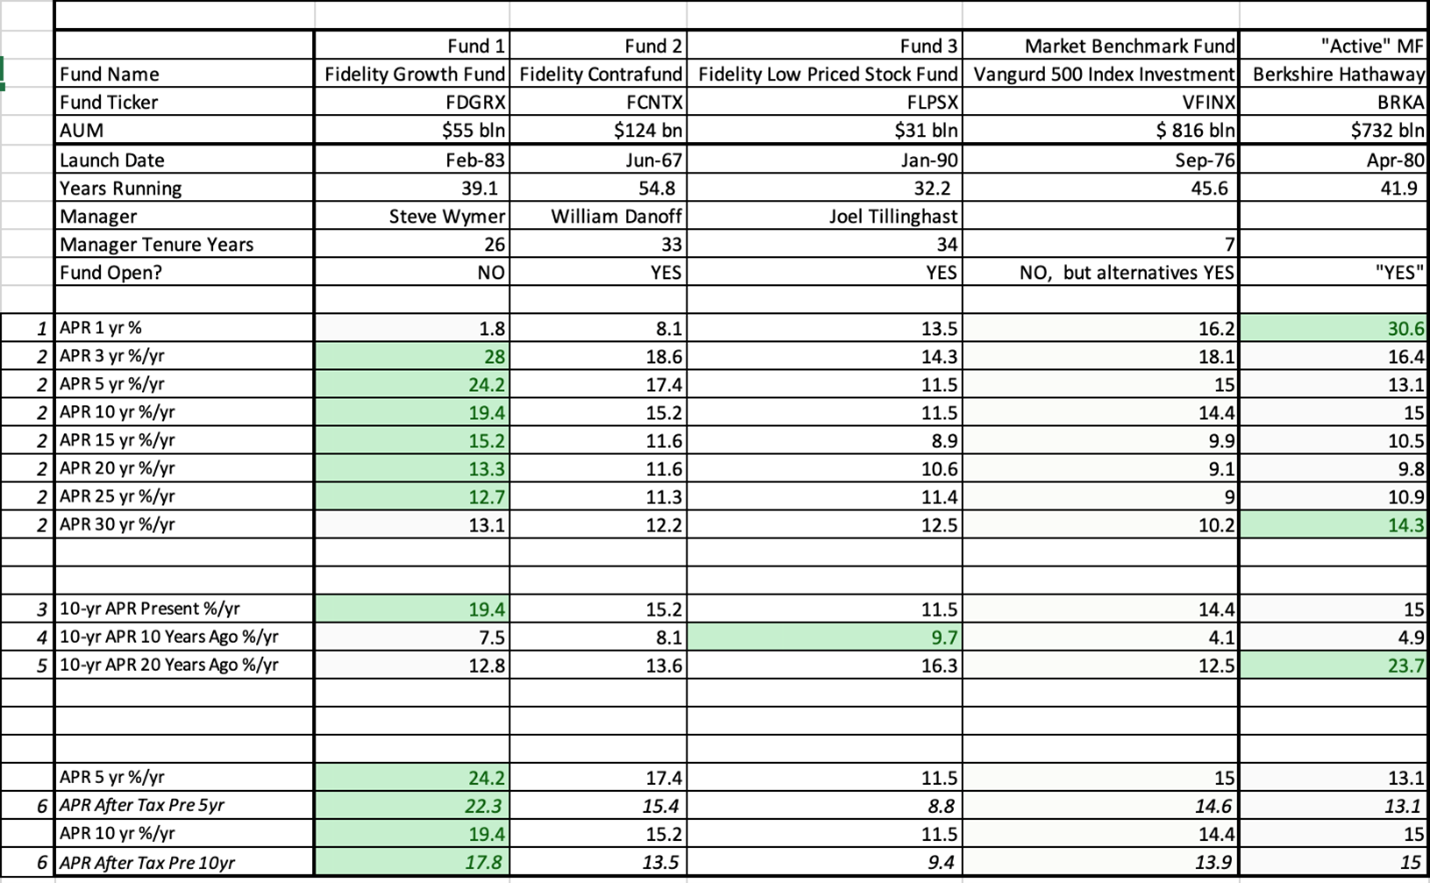
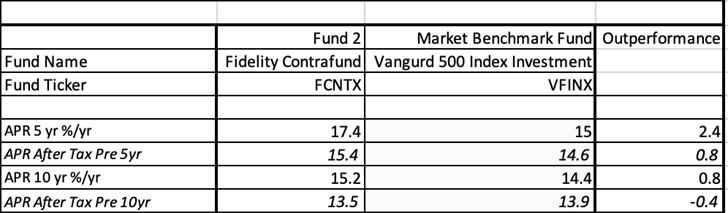
Devesh Shah takes a long look at Peter Lynch’s claim that Fidelity’s active funds crush their passive counterparts. I suspect Devesh’s response might be fairly summarized as, “not so much, really. And you certainly can’t count on it continuing.” Devesh’s own portfolio, he notes, holds nary an active fund, though he allows that he’s still examining the evidence.

Mark Freeland weighs in with a long and careful piece about what indexes – the driver of index funds – actually are, and aren’t, and how they come to be.

David Snowball shares his side of the conversation, walking through his take on the limits of passive investing and a strategy for constructing a more actively managed portfolio that gets you where you want to go.

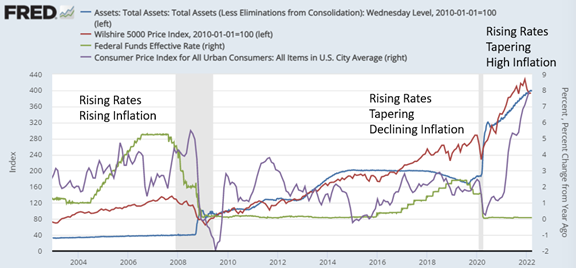
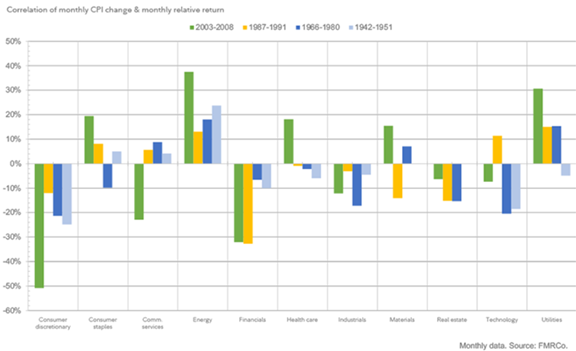
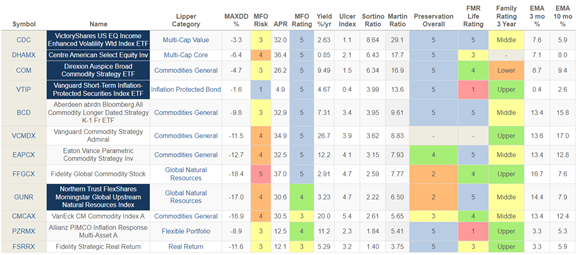
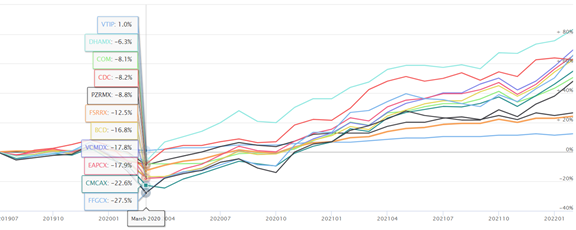
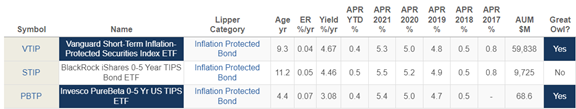
Lynn Bolin offers a really solid analysis of which resources are best buffered against the effects of inflation (or, indeed, capable of profiting from it) and highlights the sectors and funds to favor when investing in the face of inflation.

Charles Boccadoro takes on the conventional wisdom: high inflation means high-interest rates means long-term bond funds crash means … run away!!! While recognizing the challenge, he offers reason to have a bit more faith in the long-term funds.

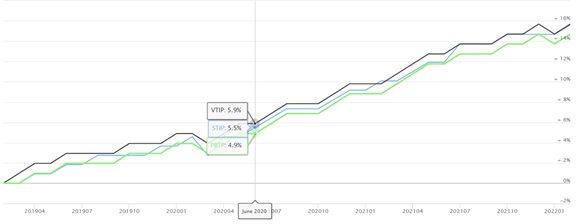
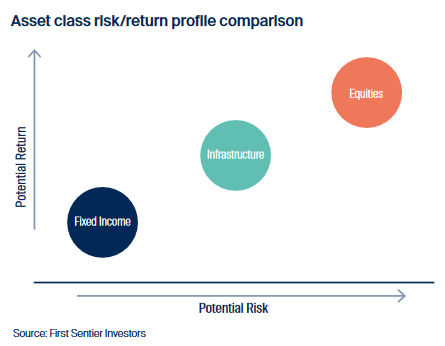
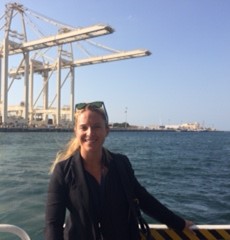
Speaking of inflation, we share an Elevator Talk with Jessica Jouning, one of the managers of the First Sentier American Listed Infrastructure fund. “Infrastructure” is all that stuff that makes our version of civilization possible: power grids, cell towers, solar farms, roads, railroads, waste treatment plants, and all. Some infrastructure is the responsibility of governments, some is funded by private investors, and others by corporations listed on US exchanges. First Sentier invests in the latter and seems to be the only infrastructure fund that targets only resources in the US.

The Shadow catches us up with the comings and goings in the fund industry, including one instructive fund liquidation, small wins, and new funds.

We hope you enjoy it and connect with the folks who produce it for you. We’re all linked in the articles we write!

Two thumbs up

Thumbs up: There are 2600 taxable bond and allocation funds. Only 75 of them are above water as of March 30, 2022. Those include four of the five CrossingBridge and RiverPark funds advised or sub-advised by David Sherman and the team at Cohanzick, as well as their Pre-Merger SPAC ETF. Their remaining fund, Responsible Credit, is down just 0.3% which places it in the top 3% of its peer group. With 84% of its funds and ETFs in the black, no other sponsor is close.

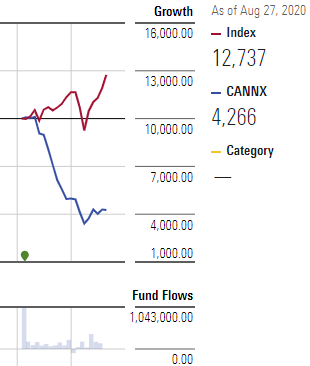
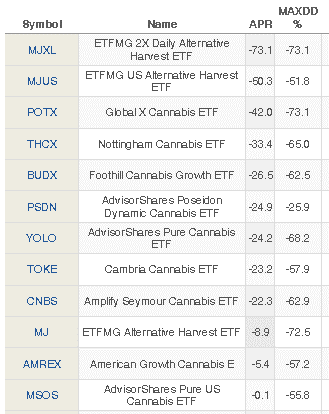
Thumbs up: Morningstar just downgraded Cathie Wood’s ARK Innovation ETF to an analyst rating of “negative.” The fund is down 58% since its peak in February 2021. Morningstar astutely notes that there are “few signs of improving its risk management or ability to successfully navigate the challenging territory it explores” (Robby Greengold, 3/29/2022). Good call, guys! Even before its epic collapse, Mr. Greengold warned that “its lone portfolio manager, inexperienced team, and lax risk controls make it ill-prepared to grapple with a major plot twist” (3/30/2021). MFO issued similar warnings while most of the financial media fawned over Ms. Woods’ genius, posting daily expositions of her latest moves. That should serve as both a warning (of the value of relying on unvetted sources whose qualifications come down to publishing a blog with a dramatic name) and a celebration (of people who have some principle greater than “more clicks”).

In Memoriam

We note, with sadness, the passing of two monumental figures.

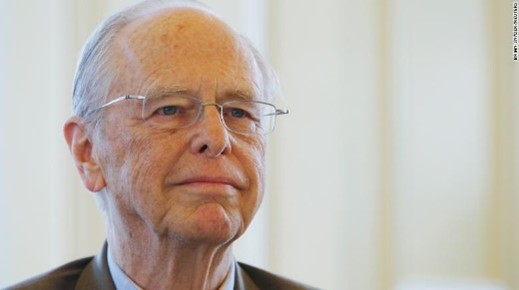
Photo: Brian Snyder of Reuters

Edward “Ned” Johnson III (1930-2022) died on March 23, 2022. Mr. Johnson was CEO of Fidelity Investments, a firm started by his father Edward (1947) and now led by his daughter Abigail, for 37 years. He also managed Fidelity Magellan before surrendering those responsibilities in 1977 to some guy named Lynch.

Fidelity was started as a sort of glorified family office to manage the family’s considerable investments. (The Johnsons have been in Boston since 1635 and made a fortune in the department store business.) Ned utterly transformed the firm, driving it into prominence in the 1960s with aggressive stock funds, and in the 1970s and 80s with star manager funds. At the same time, he was an early champion of money market mutual funds to offer investors better-than-bank returns with effectively no downside risk. During his tenure as CEO (1977-2014), Fidelity’s assets grew from $4 billion to $7 trillion. (Put more starkly, from four billion to seven thousand billion.) At his death, Fidelity had nearly $12 trillion in assets under management and his family owned half of the spectacularly profitable business. He was, very quietly, a champion of the arts and an incredibly generous philanthropist.

Mr. Johnson is survived by his wife of 62 years, three children, seven grandchildren, and several million shareholders.

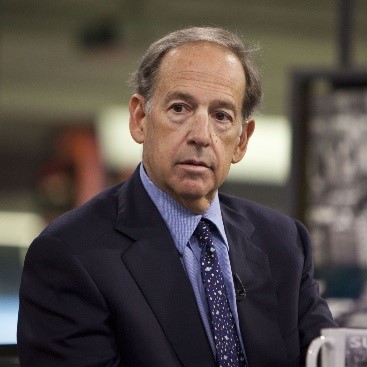
Michael F. Price (1951-2022) died on March 14 after a lengthy illness. As an investor, Mr. Price was the antithesis of Ned Johnson. Mr. Johnson’s family was fabulously wealthy; Mr. Price’s ran a clothing shop. Mr. Johnson’s mantra was something like “go (or go-go) for the growth.” Mr. Price sought profit elsewhere, by investing in distressed businesses whose management might be pressured to unlock the value that was already present. He explained that “Max taught me that if you really wanted to find value, you had to dig through stuff no one else wanted to look at.” Seth Klarman, himself a famous value investor and founder of the Baupost Growth hedge fund, observed that watching Price taught him that “the more obscure and murky the security sounds, the higher the chance it will be interesting.” Mr. Price’s most famous coup was forcing Chase Manhattan Bank to “sell divisions or take other actions” to raise the stock price; with the firm’s purchase by Chemical Bank, Price’s investors realized a 70% return.

In 1974, he accepted a job as a research assistant to Max Heine, of Heine Securities. He and Mr. Heine managed three value funds, the Mutual Series, and did so brilliantly. Together they tended to end up on lists with the likes of Warren Buffett, Peter Lynch, T. Rowe Price (the guy, not the company), John Templeton, and Benjamin Graham.  In 1982, he became a full partner and, in 1988, with Mr. Heine’s passing, bought the firm and became the president and chairman. He grew the firm’s assets from $600 million to $16 billion and, in 1996, he sold the Mutual Series to Franklin Templeton Investments. He stepped down as manager two years later. In 2001, five years after the sale, he left entirely and launched his own company, MFP Partners, LP.

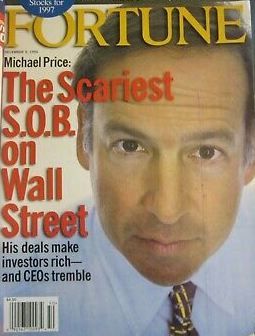
Inherent in his investment style was the need to confront recalcitrant corporate leaders on behalf of their shareholders. In disrupting the clubby world of corporate leadership, he was awarded the sobriquet “the scariest SOB on Wall Street” (Fortune cover, 12/1996).

Hedda Nadler, president of Mount & Nadler which provides public relations for financial services firms, knew Mr. Price for decades and disagrees with the label.

We had the privilege of being PR counsel to Mutual Series Funds, working with Max Heine and Michael Price since 1980. That relationship continued until 1996 when Michael sold to Franklin Templeton.

Michael was always loyal and caring about the people around him, including us. He was especially devoted to his mentor Max and had a big portrait of him hanging in his office.

We continued to have lunch together every several months which was only interrupted by the pandemic. He’d regale me with stories about undervalued stocks he found and Mutual Series alums.

While a Fortune cover called him ‘the meanest SOB on Wall Street’, the Michael we knew was kind, generous, and a mensch. He was low key, a devoted family man, and very loyal.

The world is a lesser place without Michael.

Price was married and has four children.

Thanks, as ever …

To Charles, Devesh, Mark, Lynn, and Bill, who are doing some really remarkable work for MFO. Reach out to them if something they’ve written strikes you and let them know.

Thanks especially to The Few, The Proud, The Regulars: Greg, William, another William, Brian, David, Wilson (thank you, sir!), and Doug. And we’d never forget our new contributors, Jonathan, Joseph, and Trev.

Wishing you all a joyful month, and looking forward to celebrating our 11th anniversary with you in May,

david's signature


Not a Great Time for Bond Fund Investors … But There’s Hope

By Charles Boccadoro

A quick sampling of recent headlines …

  • Morningstar author Sandy Ward: “Bond Investors Facing Worst Losses in Years. With inflation still running hot, bond prices are sliding as the market looks for faster Fed rate hikes.”
  • Bloomberg reporter Ye Xie: “… an unparalleled bond rout wiped 13% off a Bloomberg global index of government debt since its peak in January 2021 as the central banks unwound their pandemic-era stimulus.”
  • Wall Street Journal reporter Sam Goldfarb: “Bond Market Suffers Worst Quarter in Decades. Rout has robbed investors of traditional haven as stocks and many other markets swing sharply.”

And from MFO’s Discussion Board

  • David Sherman of Cohanzick Management posted: “Fixed income has definitively been a total return blood bath since 3Q21 …” (His funds, however, have held up exceptionally well so far.)
  • And from another voice on the board: “I’m throwing all my bond fund proceeds into cash until I can figure out where to invest it!”

Looking at first quarter 2022 performance of some notable bond funds: 

  • DODIX, Dodge & Cox Income Fund, long-time MFO Great Owl and Morningstar Gold rated core bond fund, down 5.2%. (And down 7% from its peak last fall.)
  • PIMIX, Dan Ivascyn’s Allianz PIMCO Income Fund, largest multi-sector income fund by far and merits Morningstar’s Gold rating, down 4.2%.
  • AGG, BlackRock iShares Core US Aggregate Bond ETF, down 5.9%. (It too down 7% from fall peak.)

Such drawdowns are the norm for stock fund investors, but not bond fund investors. The latter have enjoyed 40 years of generally declining interest rates, which tend to make most bond prices rise and hence the descriptive: “40-Year Bond Bull.”

Using MFO’s MultiSearch screening tool, we’ve generated calendar year returns and a growth chart for the three bond funds mentioned above (DODIX, PIMIX, and AGG). Since the Great Financial Crisis (GFC) of 2008, returns have been quite satisfactory. Granted, not every year, but pretty much. Even if 2022 turns out to be a down year for say DODIX, don’t the two consecutive 9% positive years of 2020 and 2021 get remembered?  While PIMIX is not delivering the double-digit returns that made it the largest multi-sector income fund, its last negative year was 2008 … 13 years ago!

Every asset class has down periods. I honestly don’t understand how buy-and-hold investors can expect otherwise. Oil had years of underperformance. It traded below zero in 2020! Constructs like Ivy Portfolio, All-Weather Portfolio, Permanent Portfolio, and the simple Equity/Bond Balanced Portfolio attempt to diversify across multiple asset classes that (usually) are not highly correlated in order to mitigate the down periods, smooth-out the ride, and provide higher risk adjusted returns.

There are nearly 1400 surviving bond mutual funds and ETFs available in US today, at least three years old. Examining performance since their inception through February 2022, about 800 or 60% of bond funds have never delivered less than zero across any three-year rolling period, based on month ending total return. What’s more, 70% have never returned less than -1% per year and 75% not less than -2% per year. Not great, but not terrifying either (unless inflation is out of control). 

Narrowing the universe to core bond funds, of which there are 150 survivors, the results are even more encouraging: 86% of core bond funds, or 6 of every 7, have never returned less than zero across any three-year rolling period! Below are the top ten by life-time annualized percent return (APR):

Several of these funds are old enough to experience periods of rising rates and inflation. To get some insight, we next examine the last Taper and Normalization period, from May 2013 to December 2018, when Fed announced plans to begin tapering bond purchases and attempted to raise the Fed Funds Rate above zero closer to historical norms. It climbed to 2.4% before capitulating. Basically, the Fed wanted to unwind its zero interest rate policy (ZIRP) and its quantitative easing (QE) efforts initiated during GFC. Guess what? All 109 surviving core bond funds delivered positive returns across all three-year rolling periods in that five and a half year stretch toward normalization … 100%. Here are the top ten core funds by return for that period:

Note that Stephen Liberatore’s TIAA-CREF Core Impact Bond Fund (TSBIX) is atop the list. Regular Discussion Board contributor bee recently posted an excellent interview with him on WealthTrack.

Our MultiSearch tool has several unique evaluation periods enabling evaluations like this one of rising interest rates. (Full list available on Definitions page under Display Period heading.) All MFO risk and performance metrics and ratings through March 2022, should post tomorrow evening Saturday, 2 April or early on Sunday, 3 April..

One last thing: Anyone who plans to hold an investment grade (IG) bond to maturity should not care about interest rate risk. So, why all the fuss? Perhaps part of it is fear of seeing red due to mark-to-market pricing in our Schwab accounts. But if investors held IG bonds in their safe deposit box, while receiving the promised dividends, they would not care! With perhaps the caveat of liquidity risk, investors should view bond funds similarly. (But do be If I’m wrong, please let me know.

As we weather the near-term storm caused by the Fed’s second attempt to normalize this past decade, I’m hopeful that investors, especially retirees, can soon earn more than zero on their CDs and other risk-free assets. 

Recipe-based investing

By Mark Freeland

Step One: Find the right recipe.

Indexes are recipes. By that, I mean they’re really precise sets of instructions that direct you in what ingredients, in what amounts, need to be treated, in what way to achieve a particular, predictable outcome. In investing, as in cooking, recipes are relatively recent inventions. Once upon a time, both activities were dominated by the notion that “experienced old guys do their thing, the rest of us watch in awe.”

Take luce or tench or fresh haddock, & boil them & fry them in olive oil. And then take vinegar and the third part sugar & onions minced small, & boil all together, & mace & cloves & cubeb. And lay the fish in dishes & pour the sauce above & serve it forth.

How much luce or tench or haddock, boiled and fried (?) for how long? With cubeb? Uhhh … The problem was clear: it required a lot of trust, failed often, and couldn’t be explained even when it succeeded. Recipes explained how a particular dish was prepared, though that didn’t automatically make the dish good. Just predictable. Peanut butter and jelly macaroni? It is a thing. Easy to make. And not good.

A cold Salty Dog? Easy to make, quite good.

And so, cooks began experimenting, codifying, and testing. The goal was predictably, consistently good results – sacrificing the occasional bit of genius to avoid the more than occasional “well, it sounded like a good idea at the time” moments.

Investing, likewise. Indexes are created by recipe and offer predictability in lieu of accidents, happy or not.

I had these recipes that say do this, do that. Who MAKES these rules? Emeril Lagasse

MSCI, mostly, Emeril. MSCI calculates around 160,000 investable indexes. Each is a set of instructions for enacting a different investment recipe, though many of the recipes are variations.

Soon after Russia invaded Ukraine, and it closed its stock market, a question was raised about how index funds would handle Russian stocks. The short answer was that index funds track indexes, so it depends on what the index does. That is why this piece is about indexes as opposed to index funds.

Below, I will describe what indexes are and how they’ve changed. That will be followed by a discussion of what goes into an index. Next is a brief example of how markets are segmented. No section does more than touch the surface. The intent is to provide a sense of what indexes are and the underlying complexity of what, at first blush, seems very simple. The bottom line is that understanding the objective and construction of indexes can help in choosing which index in a given space best matches your perspective and meets your needs.

1. A description of indexes

There doesn’t seem to be an official or universally accepted definition of an index. Instead of putting a stake in the ground, we can take a brief look at how the meaning or use of indexes has changed.

1a. Basic role of indexes

Traditionally, an index is a measurement or calculation of an average or typical “something.” That something could be an attribute of the environment, like the temperature-humidity index (THI). Or it could be something that affects our pocketbook, like the consumer price index (CPI). Or what is most important for readers here, it could be the performance of an investment market.

Such indexes are largely indicators, not necessarily precise figures. When the government reports that the CPI has risen 7.9% in the past year, it is not saying that everyone has seen their expenses go up by that amount. It’s a typical figure, determined by averaging the types of items that people purchase, and at average prices.

That’s what Charles Dow did in the late 1800s when he constructed the first indexes, the Dow Jones Railroad Average (now the Dow Jones Transport Average) and the Dow Jones Industrial Average. He selected representative stocks that could be used to gauge the overall performance of the economy.

This was more a window into financial markets than into the economy, which is viewed only indirectly. These days we have better indicators for the economy, such as GDP and employment figures. As the stock market and economy grew in the 20th century, the sampling size of his indexes was increased, first from twelve to twenty by 1916 and to its current thirty in 1928.

An obvious question is what amount of sampling is necessary to give a good indication of the stock market as a whole? Enter other indexes. Standard & Poor’s (then Standard Statistics Company) introduced its first stock index with 233 stocks in 1923. That gradually grew into the better-known S&P 500 Composite Index. Back when the S&P 500 started in 1957, it covered 90% of the value of NYSE-traded stocks. So it could serve as a reasonable index for the whole market. Even now, S&P writes that “The S&P 500 is highly regarded as a proxy for the U.S. equity market”. Though today it is better taken as a proxy for the large-cap segment of the market.

It’s not just the size of the sample that matters, but what is being sampled. Taking a broad sample is why the S&P 1500, the Russell 3000, and the Wilshire 5000 can all serve as reasonable indicators for the whole U.S. market, though each misses various small corners of the market.

1b. Indexes as benchmarks for funds

For a long time, there wasn’t much difference between defining the market as the total value of all stock companies and defining the market as the total value of stock one could actually buy on the open market. (This is commonly referred to as free float.)Two factors came together to change this.

One was the increasing use of the market by dot.com companies in the 1990s. They would sell only small portions of their stock in IPOs. High demand for these stocks could, and did, distort prices. Some of that demand came from index funds. Originally small when created in the 1970s, index-tracking investments grew to the point where they could affect small companies that were selling only a small percentage of their stocks.

Index providers responded by changing how they weighted companies. They moved away from the more economy-oriented practice of weighting companies by their total value and toward the more investment-oriented practice of weighting companies by the amount of investible stock they had outstanding. First, FTSE (1999), then MSCI (2000), and S&P (2004), these providers and others changed over to indexing investible markets.

What one sometimes reads is that the change in market definition to investible market was because investors want to know how they can expect their investments to perform. So they only want to know about the shares they can invest in. This has some superficial appeal but may ultimately strike one as unsatisfying. The impact of a company on the economy (harkening back to an original purpose of indexing) depends on the size of the company, not the percentage of its stock in circulation.

Weighting by investible stock value rather than outstanding stock value has its own potential for distortions. A CEO with restricted stock could at some point dump those shares and suddenly, substantially increase the number of investible shares in the market. While I accept the wisdom of the entire industry shifting over to free float, that does not come without its own set of issues.

Right before S&P converted to free float for its domestic indexes, it put out a paper explaining why it was hesitant to do so. It addressed the liquidity issue – difficulty in indexes tracking companies with low float percentages – by noting that it already excluded low liquidity companies from its indexes. It also made mention of how indexes are supposed to be barometers of an entire market, not just the investible portion. Call it confirmation bias, but it was nice to run across this piece.

Another change that index providers made to accommodate index funds was the introduction of buffers. If one wanted to construct a large-cap index, originally, one would just include all companies larger than a given size and exclude all smaller companies. While that’s a solid, clean approach, it has the potential for creating churn in index funds. A company sitting on the boundary might be included in an index for one period but then excluded in the next. This could go on repeatedly with multiple companies.

To reduce the churn, index providers introduced the concept of buffers. A buffer is a region encompassing stocks from both sides of a dividing line. For example, if the dividing line between mid and large caps were $15 billion, then a buffer zone might range from $13 billion to $17 billion.

One way of using this buffer zone (as described by Gus Sauter) would be to leave a mid-cap company in the mid-cap index until it grew completely out of the buffer, i.e., attaining a market cap of $17 billion. An effect of this approach is that the classification of a company becomes path-dependent. It matters how the company got to where it is. Two companies with the same market cap could appear in different indexes. Engineers and physicists might recall hysteresis (effectively, lag).

Another way to use a buffer would be to gradually reduce the weight of a company in one index and increase it in another as it moves through the buffer. So our mid-cap company would have 100% weight in the mid-cap index until it grew to $13 billion in size. Between $13 billion and $17 billion, its weight would be prorated between the two indexes. Finally, at $17 billion, it would be weighted completely in the large-cap index. In actual practice, this type of buffering is generally used in dividing companies between growth and value, not between market cap categories.

2. Index components

Index providers use a large variety of factors to decide whether a company is eligible for indexing, in which market(s) it belongs, whether it is actually used in calculating an index value, and if so, what weight it is given. A few factors have already been introduced, including market capitalization, free float, liquidity, and growth/value.

2a. Eligibility for index inclusion

Eligibility only defines the market or universe that the index is measuring. When deciding which index one wants to track, how a provider defines stock eligibility may be an important factor to consider.

The providers often use the same criteria but with different values. For example, S&P requires a company to have at least 10% of its stock publicly available (free float) to be eligible for inclusion in its small-cap index (S&P 600). In comparison, Russell has just a 5% free float eligibility requirement for inclusion in the Russell 2000 index.

In addition, some providers may add criteria that some other providers don’t use.S&P requires companies included in the S&P 1500 (and by extension, the S&P 500, 400, and 600) to be “financially viable.” That is, the companies must have had positive GAAP earnings over the past quarter and over the past year. This tends to give S&P indexes a bit of a quality bias, especially in small caps where a greater percentage of companies may not be profitable. (S&P has no viability requirement for its total market index.)

2b. Actual inclusion in an index

Most index providers specify rigid rules for including companies in one of their indexes. For example, the Russell 3000E index contains the 4,000 largest eligible companies in the US., or all, if fewer than 4,000 companies are eligible. The Russell 3,000 is then the top 3,000 of these; the Russell 2,000 consists of companies 1,001-3,000, and so on.

Mechanical rules like these are unambiguous but can be subject to biases. Some sectors may tend to have smaller companies than others and thus get underrepresented this way. For example, in VRRTX (Vanguard’s Russell 3,000 index), only 2.17% of its portfolio is invested in basic materials, while in the total market, using VTI (Vanguard Total Stock Market ETF) as a proxy, basic materials represent 2.48% of the market.

Another approach is that taken by Standard and Poor’s. Regarding indexes as market indicators, it tries to select securities for inclusion that accurately represent the market as a whole. It has a committee of human beings to review index components and may remove a component for “lack of representation.” On the positive side, this can result in a better “barometer” of the market. In the S&P 1500, using SPTM (SPDR S&P 1500 ETF) as a proxy, basic materials represent 2.61% of the portfolio. This is a bit closer than the Russell 3000 allocation to the “true” value of 2.48%.

The downside of the human approach is that it may make wrong decisions. In December 2000, S&P decided that it needed to add “new economy” stocks to the S&P 500 and remove “old economy” stocks. Many people remember what happened next. Over the next twelve months after being replaced in the index in 2000, the deleted stocks returned 16.55% (median) / 21.77% (mean), while the replacement stocks returned -22.62% (median) / -24.88% (mean).

3. Segmenting the whole market

Markets can be sliced and diced in various ways – by market capitalization, by style (growth/value), sector or theme, country or region. Then there are alternative weightings. For example, equal weighting may be rationalized by asserting that what is being measured is stock mispricing which is equally likely on all stocks. So to measure this, all stocks must be weighted equally. Then there are “smart beta” indexes. At some point, these become active strategies in sheep’s clothing—a subject for another day.

This section will be limited to just one way of segmenting the market. Since we began with the question of Russian stocks, we can look at how providers define developing market indexes. It is instructive to compare how FTSE and MSCI view emerging markets.

FTSE has three categories of emerging markets: Advanced Emerging, Secondary Emerging, and Frontier. Classification is based on six different criteria, some with subparts. It’s a complex matrix, with factors including per capita income, regulatory environment, advanced trading features, accessibility to foreign investors, efficient clearing. FTSE created a fine-grained set of standards so that it could closely track each country’s progress.

Based on per capita income and on the size and sophistication of the Korean market, FTSE classified Korea as a developed country in 2009. It did this while acknowledging that foreign investors still faced some difficulties in investing in the country.

Russia had been classified as Secondary Emerging while also on a watch list for potential reclassification as an Advanced Emerging country. After sanctions were imposed on March 2, FTSE removed Russia from all its indexes. Russian stocks were no longer being traded, so very simply, they were ineligible for inclusion in any FTSE index.

MSCI handles emerging markets a bit differently. It has just one bucket for them, Emerging Markets. It classifies a country as emerging based on the country’s per capita income, size of its market, and accessibility of that market to foreign investors. It is because of that last factor that MSCI, unlike other index providers, classifies Korea as an emerging market.

If a country is in some important way unique, MSCI puts it into its own standalone index. Certainly, Russia’s situation is unique. MSCI reclassified Russia as a standalone market, effective March 9.

4. Conclusion

Indexes are primarily indicators of how a market or market segment is performing. How those markets are defined and measured varies significantly from provider to provider. The better one understands these differences, the better one can choose an index and an index fund that performs as one expects.


On Active vs Passive Equity Mutual Funds

By Devesh Shah

When I came across a quote by Peter Lynch on how passive fund investors were making a mistake, I had two choices: to sweep his comments under the rug or evaluate the validity of them. In the article below, we will look at:

    • Lynch’s argument
    • My researched reasons for preferring passive investing.
    • The role of confirmation bias and how it can hurt or help investors.
    • The results of a careful analysis of the performance of Mr. Lynch’s preferred funds
    • Finally, a few conclusions.

The takeaway: Outperforming MFs do exist but their taxable distributions are a larger drag than expected.

We’re inviting you to join the conversation by completing our first-ever poll: the MFO active/passive preference snapshot, which you’ll find below. We’ll post results after our first week and then again in our May issue.

Peter Lynch Interview

“The move to passive is a mistake,” said Peter Lynch, the legendary one-time manager of Fidelity’s Magellan Fund. According to an article by Tom Moroney and Joe Shortsleeve of Bloomberg Quint from December 7th, 2021, Mr. Lynch also said in a radio interview, “Our active guys have beat the market for 10, 20, 30 years, and I think they’ll keep on doing it.” In reference, he cited three current Fidelity managers: Steve Wymer of the Growth Company fund, Will Danoff of the Contrafund, and Joel Tillinghast of the Low-Priced Stock Fund.

My Investment Portfolio and Aversion to Active Mutual Funds

Upon reading this article, I took a big swallow. A cursory glance at my investment portfolio confirmed what I already knew: I own no actively managed mutual funds.

Having been involved in the market for many decades and also having talked to friends who have invested in stock for far longer, I have formed strong biases. I believe a very limited set of investors have an edge in stock picking, and that these investors tend to work at hedge funds because of the superior compensation payouts. I also have a great degree of difficulty in predicting which MF will do well in the next market cycle because few funds have outperformed in all types of market cycles.

Furthermore, I rationalized my biases by backing them up with market research:

    1. Active MFs have higher fees compared to index funds.
    2. Active MF performance lags the index over the long term. The SPIVA reports show that 8 out of 10 Equity Mutual Funds underperform the US Equity Index benchmarks when the observation window is stretched out to a 10-year period. For the year 2021, 8 out of 10 actively managed equity funds underperformed the US index.
    3. Individual fund success does not last.  An academic research paper by Prof. James Choi and his graduate student, Kevin Zhao, “Did Mutual Fund Return Persistence Persist?” (2020) finds that “significant performance persistence does not exist in the 1994-2018 period.” Also, this NY Times article for a quick read.
    4. Poor tax management is common: Annual taxable distributions and dividends by actively managed MF are significant. For those with MF investment assets in taxable brokerage accounts, taxes on distributions are a significant drag on performance. Michael Lane, Head of iShares U.S. Wealth Advisory, reports:

      for the 10 years ending in 2019, taxes on distributions reduced returns on the average annual performance of actively managed U.S. Large Cap Blend mutual funds by 1.79 percentage points. Over the same period, the average expense ratio of that category was 0.89%. In other words, while investors are increasingly focused on fund fees – as they should be – the average impact of taxes has been nearly double that of the expense ratio. (“Don’t let taxes drag you down,” BlackRock Advisor Center, 5/26/21)

    5. Opportunity Cost: While periods of outperformance do not last, periods of serious underperformance are common and last for long. Overlooking this opportunity cost requires a certain level of faith in the investment manager.
      (When I read David Snowball’s commentaries of selected funds, I can see his meaningful conversations with certain fund managers have allowed space for his faith to grow. This is perhaps an important reason for active MF managers to make themselves more available.)
    6. Active bond funds didn’t protect in down markets: I owned a lot of active bond managers. Low-interest rates for a decade seduced me to invest with them. Their source of higher carry was mostly driven by credit risk and illiquidity. For some reason, I expected them to skirt an equity market crash. When in March 2020, I saw my bond funds down 15-20%, I was disappointed. I didn’t sell out of those funds into stocks as I was hoping to. Realizing I was the greater fool to expect a free lunch, I eventually exited those active bond funds. (In the 2022 market sell-off, the active bond funds seem to be predictably suffering. There is little outperformance adjusted for the duration.)
    7. Flow of Funds and the Sage of Omaha’s future widow’s portfolio: The amount of money flowing into passive investing from active over the last ten years must be a few trillion dollars. Warren Buffett has said that when he dies, he would like his widow’s assets to be invested 90% in the S&P 500 Index and 10% in T-Bills. Cumulatively, the high fees and underperformance of most actively managed equity MF have been quite clear for all to see.

    None of this is to say that active fund management does not work; only that I could not make it work for me. Others might have a different and more promising story. My aversion to active MF investing makes me a strange bedfellow in the Mutual Fund Observer community. But it also allows me an opportunity to learn from others who have faith.

    Confirmation Bias

    Peter Lynch’s contradictory comments about my biases and research came unannounced and forced me to think: “What is his incentive to call the passive crowd wrong?” I wondered. “Is this an advisor to Fidelity talking or is there genuine merit in his argument?”

    I peered inside my own mind. By ignoring Mr. Lynch’s message and looking only for research that supported my existing bias and thesis, I would be engaging in the behavioral shortfall known as Confirmation Bias.

    Here is Daniel Kahneman, author of Thinking Fast and Slow, as quoted in an article by Drake Bear in The Cut: “Where does confirmation bias come from? Confirmation bias comes from when you have an interpretation, and you adopt it, and then, top-down, you force everything to fit that interpretation.”

    Confirmation Bias makes us seek out like-minded people, who share our opinions, our views on the world, and on investments. Confirmation Bias means I look up and down for facts that will make me feel better about my already established investment thesis. It means overlooking every contradictory fact because it would be inconvenient to my way of thinking. All investors are susceptible to Confirmation Bias because there is a fine line between deeply believing something and questioning that belief by putting it to the test. Most people find it difficult to learn and invest well.

    For example, there are believers and non-believers in cryptocurrency. Whichever side one is influenced by, that’s the “correct” side. Every dialogue has the feel of pushing people deeper into their established biases.

    Precisely, therefore, in the field of investing, talking to people who see things dramatically differently from us can often bring us the greatest benefit. It can save us from our biases and self-selected group think. To avoid Confirmation Bias, if I am truly bullish on a stock or an investment idea, I find the biggest bear and listen to his/her arguments.

    I have learnt that I usually learn from these conversations and temper my bullish or bearish enthusiasm. And on rare occasions, I have strengthened my own convictions and bet bigger, because I know the opposite thesis is weaker.

    I will admit that it’s hard to undergo this ego-crushing exercise. It’s far easier to block out the other voice. It is so much more comfortable to just see my version of the world as correct and every other version wrong.

    Taking President George W. Bush’s “You are either with us, or against us” may work in geopolitics, but it is a disaster recipe for an investor. Being open-minded is more lucrative.

    As inconvenient as it was, I knew that Mr. Lynch was a legend, his words were counter to the music in my own head, and that I ought to go find out if he was correct. I might change my mind and learn something.

    The Analysis

    Using the MFO Premium search engine, I analyzed the three aforementioned Fidelity funds. For good measure, I added the Vanguard 500 Index Fund, and also Berkshire Hathaway A shares (my proxy for a well-run actively managed investment). The detailed results table is highlighted at the end of the article along with some technical explanations. Here is a quick analysis:

      1. The Fidelity Growth Company: Mr. Lynch was correct. This fund has absolutely crushed the market benchmark and even Berkshire Hathaway over the last 20-30 years. Unfortunately, the Fund is closed to New Investors as of April 2006.
      2. The Fidelity Low Stock Fund: This fund did very well in the 90s but NOT since then. It is not one of the funds that have beat the market over the last 10 and 20 years. Mr. Lynch was wrong here.
      3. The Fidelity ContraFund: Mixed results.
          1. The fund is Open and has generally beaten the Market Indices.
          2. This outperformance has been driven by significant active movement within the portfolio.
          3. The distributions from the active trading have tax consequences.
          4. Adjusted for taxes, the fund’s outperformance has disappeared against the market.
          5. This active fund might work for tax-deferred accounts.
      4. Berkshire Hathaway: Many investors are critical of Warren Buffett for not paying a dividend or distribution. But thanks to NOT paying a distribution, adjusted for taxes, this stock has started outperforming. This, despite the generally noted inability of Berkshire to use its large cash pile for suitable elephant investments.

    Conclusion

    Have I answered the question I started with on active vs passive? Has the analysis affirmed my existing biases or made me change my opinion about anything?

      1. The Fidelity Growth Company’s massive outperformance is a good wake-up call for me. I learnt that superb and consistent outperformance exists in a Mutual Fund, even in today’s benchmark-driven passive market.
      2. The Contrafund is interesting because it both outperforms and underperforms the market benchmark fund at the same time. Its outperformance is from Danoff’s investment acumen, and the underperformance from the high taxes on distribution the fund pays. On a related note, Morningstar just downgraded Contrafund (3/22/22) in recognition of the enormous constraints imposed on a manager whose strategy (which covers Contrafund, clones, and related accounts) has grown to $250 billion.
      3. David Snowball had an interesting take on the Contrafund. Danoff has trained a lot of analysts. How come none of them have performed as well outside of the Contrafund? Maybe Danoff is Betting on the Contrafund means hoping Danoff sticks around.
      4. I am now open to the idea that there is a select number of fund families (Primecap, Fidelity, Wasatch, Grandeur Peak to name a few) where the investor has a higher shot than the average actively managed mutual fund. I am open to reading and learning more about successful MF managers so I can form faith.
      5. For most of my investment assets, I still feel comfortable in the warm blanket of passively managed index funds. Only after I have substantial faith in a fund management team would I consider moving my assets, and I would be in no rush to do this.

    Remember: join the conversation by completing our quick, easy and anonymous MFO active/passive preference snapshot

    For readers who enjoy looking at the detailed data behind my arguments, I’ve reproduced the results of a side-by-side comparison of the short- and long-term performance of Mr. Lynch’s favorite funds. And because taxes sting, I’ve also included their tax-adjusted performance. For each metric, the fund with the single highest performance is flagged with a green box.

    Detailed performance record: three Fidelity stars, the S&P 500 and Mr. Buffett

    What is APR: It is the Annual Percentage Return of a fund including the Price and Dividend Return, as well as the fees paid.

      1. APR 1yr %: Total fund Return over the last 12 calendar months (March 2021-Feb 2022).
      2. APR 3yr %/yr.: The total returns are taken for the last 36-months and then recalculated to form an average compounded annual return for the period. This has the effect of averaging the good years with the bad years to give us an approximate number the fund delivered to its investors over the 3-year period. This same calculation is done for the APR 5, 10, 15, 20, 25, 30 in the MFO search engine (or in most financial websites).
      3. 10-yr APR Present %/yr: The fund’s 10-year total return when annualized on average from Mar-2012 to Feb-2022.
      4. 10-yr APR 10 Years Ago %/yr: The fund’s 10-year total return when annualized on average from Mar-2002 to Feb-2012.
      5. 10-yr APR 20 Years Ago %/yr: The fund’s 10-year total return when annualized on average from Mar-1992 to Feb-2002.
      6. APR After Tax Pre 5yr: The fund’s 5yr APR %/yr is adjusted down to account for the taxable distributions made by the fund. The assumption is the investor is holding the fund in the taxable account and is taxed at the highest marginal ordinary income tax rate at the federal level. No tax is subtracted at the State and Local level.
        The After-Tax APR numbers are reported by the funds to the SEC since the early 2000s. This measure was added recently to MFO Premium. Existing fund holders of actively managed mutual funds receive distributions in a tax year when:

          1. A fund’s stock holdings pay dividends
          2. A fund liquidates positions with short-term and long-term capital gains
          3. Other fund holders exit their fund investment and force the fund to liquidate positions.
      1. Fund holders in the Contrafund have been receiving such distributions and it’s been eating into their total returns.

Two cheers for active management!

By David Snowball

Devesh and I have an ongoing conversation about the value of active managers. He thoughtfully runs through the arguments – from consistency to tax efficiency – that led him to conclude, “not much value there.” Cool and sensible.

If you want to join the conversation but start with somewhat greater sympathy for the role of active managers, you might consider five arguments.

  1. Measuring an investment by whether it “beats the market” is irrational. It is, nonetheless, the starting point for all criticisms of active management. And, to be clear, those criticisms can get a bit heated. One financial planner wrote to ask whether a piece I’d contributed to on mid-cap funds more reflected the fact that I was “bought off or just stupid.” (Having checked my modest savings account, I concluded that “bought off” couldn’t explain it.)

    I’ll repeat the argument I made in “Bright Guys Saying Dumb Things” (2019):

    There is no stupider or more destructive obsession in the investing world than this: so how often does your guy beat the market? This is the fantasy football version of investing: we win not by winning but by adding together a bunch of random, unconnected data points and declaring that the person with the biggest piles o’ points won.

    Earth to Investors: Fantasy Football is Fantasy. It’s not a model for managing your money. In personal finance, you win if and only if the sum of your resources is equal to or greater than the sum of your needs.

    If you beat the market ten years in a row and the sum of your resources is less than the sum of your needs, you lose.

    If you trail the market ten years in a row and the sum of your resources is greater than the sum of your needs, you win.

    Our guess is that winning requires investments that you understand and can stick with in the long term, ideally calibrated to a calculation of your long-term needs. In my case, for example, I win if my retirement portfolio returns 6% per year. If my 6% returns “trail the market,” I still win. If I “beat the market” but make less than 6%, I lose.

  2. You are much more destructive to your portfolio than your managers are. We panic; we get greedy. We lose focus; we hyper-focus. We pretend we have special insights and, worse yet, act on those delusions. You know all those weird little cloud computing / AI and robotics / disruptive fintech / hemp and pot / obese America / vegan funds and ETFs that have been launched in the last five years? Morningstar “research shows that options for thematic funds—ranging from artificial intelligence to cannabis—have seen a surge in recent years, with $806 billion in assets under management as of the end of 2021” (Morningstar, 3/22). Morningstar tracks the impact of our delusions in their annual “Mind the Gap” studies. The average investor underperforms the funds they’re invested in – active or passive – by 1.75% annually through our ill-timed impulses. The gap is greatest in the sexy sectors and alternative funds (about 4% per year lost) and smallest in boring old allocation funds (0.7% lost).

  3. There is no such thing as “passive investing.” The only truly passive approach to investing would be to assign every person, preferably at birth, fractional ownership of all of the world’s equity, debt, and commodity market. We could call it The One Fund. The total global equity market is about $100 trillion, global debt is $130 trillion and $250 trillion is in real assets.

    There would be no other options and you’d sell none of it until you reached your “decumulation date.”

    A truly passive portfolio would be 9% US equities, 12.5% international equities, 18% government debt, 9% corporate debt, and 51% real assets.

    Just 9% US equities!! Twice as much in God-forsaken foreign stocks? Tons of bonds in a 30-year-old’s portfolio? A toll road in Nepal? (WTF!) You wouldn’t like that, would you? That’s understandable.

    Welcome to active management. As an investor, you (or your representative) actively manage your strategic asset allocation (that is, your long-term exposure to stocks, bonds, and so on), your tactical asset allocation (your exposure to them right now, which might vary based on your position on the greed-fear spectrum), and your security selection (Fund A, ETF B, call option C, Stock D). Each of those decisions represents an active bet on your part that one set of options will be more satisfying than another.

    And, contrary to the general perception, index funds are not passive portfolios. They represent a series of complex and active decisions, bets, if you will, made by their portfolio managers. The difference is that the portfolio managers reside at MSCI or Standard & Poor’s rather than in the offices of your fund or ETF provider.

    By one tally, MSCI calculates 3.5 million potential investible indexes. There are 652 distinct index funds, with expense ratios ranging from 0.0 – 2.01%, tracking US equities alone. They have reported portfolio turnover rates ranging from 0 – 4700%.

    But the S&P 500 is …! It’s an actively managed, low turnover fund. The active management occurs at Standard and Poor’s, which updates the fund’s portfolio quarterly. The S&P500 is not a collection of America’s 500 largest stocks. It’s 500 stocks that a committee at S&P has chosen to represent the US market, constrained by a combination of liquidity, profitability, American-ness, and trading rules (which kept Berkshire Hathaway out of the index for decades) and human judgment. Their selection process is opaque and answerable to none. Motley Fool (2019) published a nice walk-through of the process. About 25 stocks per year are booted from the S&P 500, though it’s been as high as 60.

  4. The charm of the best passive funds is that they make predictable mistakes cheaply. The S&P 500 is, predictably and by design, a momentum-driven portfolio. If everyone is rushing to buy Tesla (or, this year, Occidental Petroleum) regardless of the health of its business model or the valuation of its stock, the S&P 500 will rush to buy Tesla. If everyone is dumping Moderna, the S&P 500 will rush to sell Moderna. But, really, that’s about the only sort of mistake the fund will make; it doesn’t pretend to have special insights that other, lesser beings lack. (See, by contrast, Sequoia Fund and their decision to bet 36% of their portfolio on Valeant Pharmaceuticals or Third Avenue Value Fund’s commitment of 40% of their assets around 2010 to Hong Kong property stocks.)

    Sensible investors can access an S&P 500 portfolio for between 0 – 61 basis points.

  5. 80% of active funds could be liquidated with no loss to anyone except possibly their managers. That’s actually a founding principle of MFO and a carryover from our predecessor, FundAlarm.

    Funds can be justified as an investment imperative or a business necessity. By “investment imperative,” I mean that the strategy is really useful, innovative, and rewarding. By “business imperative,” I mean that the fund was launched because the adviser needed a fund like it to “offer a complete suite of investment options” and, hence, to keep investors from taking their money elsewhere. Assuming that an S&P 500 Index fund is a good idea – an assumption I’m happily willing to make – the world needs about three S&P 500 funds. That would be enough to produce a useful downward pressure on expenses. But it has 38 S&P 500 funds, with some offering seven distinct share classes. Thirty-five of those funds, in over 100 share classes, could be liquidated with no loss except to the companies who need them to “keep assets in-house.”

    The situation is a lot worse in the realm of active funds. For example, there are 186 separate active funds (some with 16 share classes) investing in US large-cap core stocks, few of which even pretend to add any value for their investors. The five largest active large-cap core funds have correlations to the S&P 500 index of 0.95-0.99. That’s intentional because these funds are business necessities: their imperative is to keep assets in-house, not to do something interesting or distinctive. Put simply, a lot of jobs – and a lot of corporate bonuses – depend on the ability of the managers to hold onto assets. The simplest way to hold onto assets is to avoid getting noticed: never get out-of-step with the index, never act boldly, never take chances. So, they don’t.

So why cheer at all for active funds? At base, I rely on active managers to make prudent risk adjustments on my behalf. There was a time when I thought that checking my investments daily and tweaking them frequently was a good use of my time. I no longer do and, quite likely, I should never have. There are simply too many other things demanding my available brain space – mental bandwidth, so to speak – for me to consistently monitor and adjust market exposure.

Risk management works in the long-term and across market cycles

None of the 50 domestic equity funds and ETFs with the highest 25-year Sharpe ratio are passive products. Of the top 100, only four are passive products. (There are 113 index funds that have been around for more than a quarter-century.)

Shift to a 15-year period, when passive funds and ETFs were much more common and included the major market disruptions of 2007-09, only 14 of the top 50 domestic equity funds and ETFs measured by risk-adjusted returns, were passive. Of the top 100, 17 were passive.

Shift to the Period of the Party, the last ten years in which the most accommodative Fed policy in history created “the market on opioids,” and you still get only 24 passive funds in the top 50 by risk-adjusted returns.

In selecting funds, I’ve looked for several characteristics that allow me to get comfortable with my portfolio and leave it alone, with funds typically remaining there for decades rather than months. Among the characteristics:

  1. A strategy that I understand well, in preference to algorithms and black boxes.
  2. A clearly articulated understanding of the manager’s role in controlling risks, in preference to managers who have “pedal to the metal” as their mantra.
  3. A track record for the manager, rather than just the particular fund, that spans multiple market cycles, in preference to strategies that have proven they work when markets are rising.
  4. An independent streak, which allows managers to explain why I wouldn’t be better off in a low-cost index fund.
  5. The ability to invest in more than one asset class, rather than being locked into 80% of the portfolio always in the asset class in the name. That’s a “give them the latitude to zig from time to time” preference.
  6. Substantial, widespread, and consistent insider investment – by the managers surely, but also by their families, staff, and boards of trustees ideally. One manager admitted, “I hate losing my own money, but it’s deadly if I lose my mother-in-law’s.”

Bottom line

You need to understand what it’s going to take for you to win. That means starting with the “sum of your resources greater than the sum of your needs” calculation, rather than a “beating the market and brag to my brother-in-law” one. (Tools like T. Rowe Price’s Retirement Income Calculator do a phenomenal job of letting you estimate your options and prospects.)  From there, determine the long-term strategic allocation you need; how much of your portfolio needs to be exposed to market risks in order for you to have a decent chance of winning? (Our various articles on the stock-light portfolio are a decent part to start.)

Mr. Buffett famously announced that he thinks his wife’s portfolio, as he’s gone, should be 90% Vanguard 500 Index and 10% short-term Treasuries. Uhhh … does anyone else wonder why Warren Buffett’s wife should have any money invested in the stock market? Astrid Menks was born in 1946; she and Mr. Buffett were wed in 2006. At the point of his departure from this realm, she’ll be in her late 70s or 80s and will have … oh, a couple billion in her savings account. One wonders how much capital appreciation she will need in order to comfortably meet her needs.

Think about who, if anyone, is going to try to “tilt” the portfolio to deal with short-term traumas. Then, finally, pick the securities that make it all work. For Devesh, the right answer is a series of indexed products spread across complementary asset classes, and cheers to him for it! For me, it’s a stock-light portfolio of actively managed boutique funds whose managers have a bit of flexibility. For you, it’s quite likely something different from – and, for you, better than – the choices we’ve made. The key is not being trendy, popular or market-beating. The key is reaching the finish line, perhaps bruised but with arms raised in triumph.

Managing Risk During Inflation

By Charles Lynn Bolin

I have expressed my intention to retire in the next few months with the specter of stagflation looming. I have studied the 1960s to 1970s stagflation period since I lived through these times and know that they are secular. Federal Reserve Chairman Jerome Powell recently described the potential for inflation to last for an extended period of time:

the risk is rising that an extended period of high inflation could push longer-term expectations uncomfortably higher, which underscores the need for the Committee to move expeditiously as I have described. (Powell Says ‘Inflation Is Much Too High’ And The Fed Will Take ‘Necessary Steps’ To Address,” CNBC, 3/21/2022)

This article describes how conservative investors may prepare for this evolution in the investment environment. I’ll walk through five sets of ideas.

    1. Evaluating Similar Time-Periods (for what worked then)
    2. Financial Physics (low and volatile returns ahead)
    3. Hard or Soft Landing? (can the Fed perform magic?)
    4. Categories and Funds Favored to Outperform (real assets, steady demand, cash)
    5. Conclusion

I would like to give a hat tip to Charles Boccadoro for developing the new graphical analytical tools which I used in this article. Thank you.

1. Evaluating Similar Time Periods

Key Point: During similar time periods of inflation, rising rates, and/or quantitative tightening, commodities, global natural resources, precious metals, real return, inflation-protected bonds, global infrastructure, utilities, consumer staples, and value have performed relatively well.

The Fed’s current policy trajectory is likely to lead to stagflation, with average unemployment and inflation both averaging over 5 percent over the next few years — and ultimately to a major recession. (Larry Summers’ new warning: Fed heading for ‘stagflation and recession’,” MSN, 3/16/2022)

Figure #1 shows the Consumer Price Index (purple), Federal Funds rate (green line), Federal Reserve Assets rising with quantitative easing (blue), and the behavior of the S&P 500 (red line) for the past twenty years. We begin a new period with the Federal Reserve raising rates, and tapering its balance sheet to slow the economy in response to inflation. Expect higher volatility.

Figure #1: Inflation vs Fed Funds Rate and Federal Reserve Assets (QE)

Source: St. Louis Federal Reserve (FRED), Board of Governors, Wilshire, BLS

Table #1 shows the similarities and dissimilarities between the current environment and five other periods. The grey areas show similarities to the current economy and market. The red font indicates areas of concern. Yes, this time is different! There are several points to highlight:

    • Valuations are high relative to inflationary periods.
    • Short term rates are being increased from a low base.
    • Total Public Debt to GDP has quadrupled since the 1970s to 125 percent of GDP.
    • The Budget Deficit has increased from less than 2% of GDP to 12%.
    • Stocks only outperformed inflation by less than 2% during the 1970s.
    • Dividends were a larger share of the returns than the paltry dividend yield today.
    • Net imports are a much larger percent of GDP than during the 1970s.
    • Commodities slightly outperformed large cap stocks during the 1970’s, and are doing well this year.

Table #1: Metrics During Selected Time Periods

Source: Created by the Author Using MFO and St. Louis Federal Reserve (FRED)

Table #2 contains the average performance of Lipper Categories during the selected time periods with the exception of the two most recent periods which are based on the two hundred funds that I track. They are color-coded by the highest (blue) and lowest (red) performers. The Category is shaded by the ones that I expect to hold up well over the remainder of the late stage.

Table #2: Category Performance During Selected Time Periods

Source: Created by the Author Using MFO Premium screener

2. Financial Physics

Key Point: Conditions favor higher inflation, and valuations are probably going to compress. Returns from stocks are likely to be low and volatile over the next decade.

The economic and financial impact of the Russian invasion of Ukraine represents a stagflationary shock for the global economy… Stagflation, an economic environment of stagnant growth and rising inflation, was once a long-tail risk, but now appears to be a real possibility…

Failing to see an easy off-ramp for the crisis [in Ukraine], the disruptions to energy markets may prove longer than initially anticipated, raising the uncertainty in the fight to rein in inflation and likely extending its duration.” (Jeffrey Rosenberg and Tom Parker, “A Stagflationary Shock,” BlackRock, Systematic Fixed Income Market Outlook, Spring 2022)

Ed Easterling, the founder of Crestmont Research, distinguishes between markets and the economy in what he calls Financial Physics. Mr. Easterling wrote Probable Outcomes and Unexpected Returns: Understanding Secular Stock Market Cycles, both great books that describe secular bull and bear markets and the role of inflation. Figure #2 shows the Financial Physics concept which he explains as:

Since Real GDP has been relatively constant over extended periods of time and all other factors are driven by inflation, a primary driver of the stock market is inflation — as it trends toward or away from price stability. Given the current state of low inflation and the likelihood of it either rising (inflation) or declining (deflation), P/E ratios are expected to decline, in general, for a number of years. As P/E ratios decline and EPS grows, the result will be another relatively nondirectional secular bear market. (Financial Physics, 2022 update)

Figure #2: Financial Physics

Source: Crestmont Research

Commodity prices tend to rise as production approaches capacity as shown in Figure #3. The velocity of money is also shown and is basically the rate at which money changes hands. In spite of massive stimulus, the velocity of money has continued to slow until after the 2020 recession and since then has flattened as the money starts to circulate more which coincides with inflation rising.

Figure #3: Inflation vs Capacity and Money Velocity

Source: Created by the Author Using St. Louis Federal Reserve (FRED)

Martin Pring, chief investment strategist at Pring Turner Capital Group, a California advisory with $183M in AUM, and author of Investing in the Second Lost Decade: A Survival Guide for Keeping Your Profits Up When the Market Is Down (2012) wrote Impending Super Cycle Commodity Signal Argues Against Transitory Inflation in October 2021 where he laid the potential for a secular bull market in commodities as shown in Figure #4.

Commodity prices look poised to signal a new secular bull market, which would likely broaden out to result in the highest more generalized inflation rates since the 1970’s… If that proves to be the case, the implications for stock investors would be tremendous. One obvious effect would be an improvement in relative performance by earnings driven sectors, especially commodity sensitive ones. More importantly, history shows, that as secular commodity bull markets mature, their consequential economic distortions trigger secular bear markets for stocks in general.

Figure #4: Commodity Secular Markets

Figure #5 from Stocks to Commodities Ratio shows an interesting comparison of the S&P 500 and the Producer Price Index by Commodity: All Commodities (PPIACO). Commodities tend to perform well relative to stocks during periods of higher inflation.

Figure #5: Stocks to Commodity Ratio

COVID has wreaked havoc on the production of commodities for the past two years, and the effects are still detrimental. Most commodity production is capital intensive and requires long lead times. After a decade of low inflation and relatively low commodity prices, it will take time for new production to ramp up. Rhiannon Hoyle, who writes about mining and commodities from The Wall Street Journal’s Australia-New Zealand bureau, observed:

Underscoring the constraints facing miners in responding to shortages, the International Energy Agency estimates that it takes more than 16 years on average from the discovery of a potential mine site through to first production. (“Ukraine War Threatens Commodities Supply and Miners Can’t React,” WSJ, 3/23/22).

Russia is a major exporter of the following commodities. While this production may not be entirely removed from the markets there will be a major shift in global supply chains as new sources are developed.

    1. Mineral fuels including oil: US$211.5 billion (43% of total exports)
    2. Gems, precious metals: $31.6 billion (6.4%)
    3. Iron, steel: $28.9 billion (5.9%)
    4. Fertilizers: $12.5 billion (2.5%)
    5. Wood: $11.7 billion (2.4%)
    6. Machinery including computers: $10.7 billion (2.2%)
    7. Cereals: $9.1 billion (1.9%)
    8. Aluminum: $8.8 billion (1.8%)
    9. Ores, slag, ash: $7.4 billion (1.5%)
    10. Plastics, plastic articles: $6.2 billion (1.3%)

Russia’s Top 10 Exports

3. Hard or Soft Landing?

Key Point: The yield curve has been flattening showing an increased risk of a recession over the next few years.

Looking beyond the March meeting, we expect higher inflation and concerns about inflation expectations to continue to weigh more heavily on Fed officials than downside risks to growth in the coming months. As a result, our baseline forecast remains that there will be rate hikes at consecutive Fed meetings and a meaningful further tightening of policy throughout the year. This faster pace of tightening raises the risk of a hard landing further down the road and suggests a higher risk of a recession over the next 2 years. (PIMCO, Tug Of War: The Fed Begins A RateHiking Cycle As Inflation Trumps Uncertainty, 3/17/22, SA registration required)

Dr. Nouriel Roubini gave advance warning of the financial crisis and has been warning of stagflation for some time. He was a professor of economics at New York University’s Stern School of Business. He has worked for the International Monetary Fund, the US Federal Reserve, and the World Bank. He is the author of Crisis Economics: A Crash Course in the Future of Finance (2010). He combines the effects of 1970s stagflation with the 2007 financial conditions to warn of a “Minsky Moment”:

We are thus left with the worst of both the stagflationary 1970s and the 2007-10 period. Debt ratios are much higher than in the 1970s, and a mix of loose economic policies and negative supply shocks threatens to fuel inflation rather than deflation, setting the stage for the mother of stagflationary debt crises over the next few years…

As matters stand, this slow-motion train wreck looks unavoidable. The Fed’s recent pivot from an ultra-dovish to a mostly dovish stance changes nothing. The Fed has been in a debt trap at least since December 2018, when a stock- and credit-market crash forced it to reverse its policy tightening a full year before Covid-19 struck. With inflation rising and stagflationary shocks looming, it is now even more ensnared. (Nouriel Roubini, “Conditions Are Ripe For Repeat Of 1970s Stagflation And 2008 Debt Crisis,” The Guardian, 7/2/21)

Wells Fargo economists argue that the probability of recession is low for this year but increases by the end of next year:

Today’s environment leads us to believe recession risks are unusually elevated; we put the odds of the U.S. economy contracting at some point between now and the end of 2023 at 30%. Our base case remains that the Fed tightens policy further over the next year or two without generating a recession… We see a significant likelihood that a technical recession is avoided, but growth slips below trend and the labor market treads water. That, however, may require living with above-target inflation somewhat longer if the FOMC re-weights its priorities as economic growth and the labor market look shakier. (Sarah House, et al., The Great Escape – Will the Fed Be Able to Wring Out Inflation Without a Recession?, 3/25/22)

4. Categories and Funds Favored to Do Well

Key Point: I favor commodities, commodity producers, real return funds, global infrastructure, value, utilities, and consumer staples in the current environment. Cash is not trash.

Historical analysis shows that value exposures have tended to outperform in a rising yield environment as it coincides with rising inflation… In a rising rate environment, traditional bonds can lose value, but investors should not write off fixed income exposure altogetherExposure to broad commodities can provide diversification in a multi-asset portfolio and can potentially hedge against interest rate risk. (BlackRock, Maneuvering Through the Fed’s Hiking Cycle, 3/17/22, SA registration required)

The fantastic chart from Fidelity below shows how well sectors have performed in four different inflationary regimes. Energy and utilities are the most consistent winners followed by consumer staples. Health care and materials are inconsistent winners. The most consistent losers are consumer discretionary, financials, industrials, real estate, and technology.

Figure #6: Sector Performance During Inflation Regimes

Source: Top Sectors Amid Inflation, Fidelity

Commodities can be volatile and I look for a diversified approach to protecting against inflation. Table #3 contains funds that have done well over the past two years which may help protect against inflation.

Table #3: MFO Metrics of Top Inflation Protection Funds – Two Years (Since March 2020)

Source: MFO Premium fund screener

Figure #7: Fund Performance of Top Performing Inflation Protection Funds

Source: MFO Premium fund screener (with cool new graphing!)

The following are strategies from funds shown as representative examples of differences in Lipper Categories. Commodity funds invest in commodity price futures while Global Natural Resources invest in companies that produce commodities. Real Return Funds are more diversified and often less volatile. I favor Flexible Portfolios where the fund manager has the discretion to improve risk adjusted returns by investing across diverse asset classes.

Flexible Portfolio: PIMCO Inflation Response Multi-Asset Fund (PZRMX)

The fund invests in a combination of Fixed Income Instruments of varying maturities, equity securities, affiliated and unaffiliated investment companies…, forwards and derivatives, such as options, futures contracts or swap agreements, of various asset classes in seeking to mitigate the negative effects of inflation. It may invest up to 25% of its total assets in equity-related investments.

Real Return: Fidelity Strategic Real Return Fund (FSRRX)

Allocating the fund’s assets among four general investment categories, using a neutral mix of approximately 25% inflation-protected debt securities, 25% floating-rate loans, 30% commodity-linked derivative instruments and related investments, and 20% REITs and other real estate related investments…

Commodities General: Parametric Commodity Strategy Fund (EAPCX)

The fund invests primarily in commodity-linked derivative instruments backed by a portfolio of fixed-income securities. The fund’s portfolio of fixed-income securities is generally comprised of U.S. Treasury securities and money market instruments…

Global Natural Resources: Fidelity Global Commodity Stock Fund (FFGCX)

Normally investing at least 80% of assets in stocks of companies principally engaged in the energy, metals, and agriculture group of industries.

VictoryShares US Equity Income Enhanced Volatility-Weighted Index ETF (CDC)

I include CDC because it is up 1.4% year to date as of March 17th. It is currently invested (approximately 65%) in utilities, financials, and consumer staples.

The Fund seeks to achieve its investment objective by investing, under normal market conditions, at least 80% of its assets directly or indirectly in the securities included in the Nasdaq Victory US Large Cap 100 High Dividend Long/Cash Volatility Weighted Index…

The Index combines fundamental criteria with individual security risk control achieved through volatility weighting of individual securities. In accordance with a rules-based mathematical formula, the Index tactically reduces its exposure to the equity markets during periods of significant market decline and reallocates to stocks when market prices have further declined or rebounded. The term “Enhanced” in the Fund’s name refers to a feature of the Index that is designed to enhance risk-adjusted returns while attempting to minimize downside market risk through defensive positioning, as described below.

The Index follows a rules-based methodology to construct its constituent securities:

    • The Index universe begins with the stocks included in the Nasdaq Victory US Large Cap 500 Volatility Weighted Index, a volatility weighted index comprised of the 500 largest U.S. companies by market capitalization with positive earnings over the last twelve months.
    • The Index identifies the 100 highest dividend-yielding stocks in the Nasdaq Victory US Large Cap 500 Volatility Weighted Index.
    • The 100 stocks are weighted based on their daily standard deviation (volatility) of daily price changes over the last 180 trading days. Stocks with lower volatility receive a higher weighting and stocks with higher volatility receive a lower weighting.

Short-Term Inflation-Protected Bonds (VTIP, STIP, PBTP). These funds are up over 0.75% year to date as of March 17th.

Table #4: Annual Inflation-Protected Bond Performance

Source: MFO Premium fund screener

Figure #8: Short-Term Inflation Protected Bond Performance

Source: MFO Premium fund screener

Closing

“Unfortunately, history isn’t on his [Fed Chairman Powell] side. Inflation is much further from the Fed’s objective, and the labor market, by many measures, is tighter than in previous soft landings. Yet the Fed starts real interest rates – nominal rates adjusted for inflation – much lower, in fact deeply negative. In other words, not only is the economy traveling above the speed limit, the Fed has the gas pedal pressed to the floor. The odds are that getting inflation back to the Fed’s 2% target will require much higher interest rates and greater risk of recession that the Fed or markets now anticipate. (“Odds Don’t Favor the Fed’s Soft Landing,” WSJ, Grep Ip, March 24, 2022)

My storyline remains that we are entering the late stage of the business cycle with valuations and inflation unusually high. Inflation will remain elevated for the next year or two at a minimum and the Federal Reserve will raise rates in response. A hard landing with a recession is more likely than a “soft landing”. I will casually reduce risky assets as indicators suggest doing so is prudent.

Investors should maintain diversified portfolios because the future is uncertain. I put 75% of portfolios in stable long-term funds, with 25% in a tactical sleeve, and limit categories to 5%. Commodities, equity of commodity producers, real return funds, utilities, and consumer staples are part of the tactical sleeve but will be scrutinized as a recession approaches.

Investing in commodities, real return funds, and utilities greatly reduced the volatility in my portfolio this year as the inflationary shock pushed prices up. This year, I have continued to rotate into inflation beneficiaries as I believe the trend will continue for some time. I have also reduced funds that are not responding well to rising rates as this trend will continue while there is high inflation. I have raised cash above normal levels to reduce risk and uncertainty as well as to take advantage of future opportunities.

Elevator Talk: Jessica Jouning, First Sentier American Listed Infrastructure Fund (FLIAX)

By David Snowball

Since the number of funds we can cover in-depth is smaller than the number of funds worthy of in-depth coverage, we offer one or two managers each month the opportunity to make a 300-word pitch to you. That’s about the number of words a slightly manic elevator companion could share in a minute and a half. In each case, I’ve promised to offer a quick capsule of the fund and a link back to the fund’s site. Other than that, they’ve got 300 words and precisely as much of your time and attention as you’re willing to share. These aren’t endorsements; they’re opportunities to learn more. 

It’s someday.

You remember how often people have looked problem and said, “yep, we’re gonna have to get to that someday.”

Someday is here.

That was driven home by the January 2022 collapse of the Frick Park Bridge in Pittsburgh. You may have seen the picture:

I am from Pittsburgh. Went to Pitt, but couldn’t afford a dorm room, so I lived at home and took the Port Authority’s 61B bus to school every day. Over that bridge. In that bus.

(Technically, a long-defunct predecessor of that bus which nonetheless is the 61B Braddock-Swissvale line.) As I looked at the images, I thought something like, “oh my God, that entire bridge just collapsed in the hollow. Jeezus.”

Welcome to infrastructure failures. Infrastructure is all of the stuff that connects other stuff and makes modern life possible: roads and railroads, water treatment plants and bridges, but also cell tower networks and data centers, airports, and solar farms. For the average citizen, it’s out of sight, which means, for the average politician, it’s out of mind. That’s shorthand for “not in the budget this year, but we’re going to have to get to that … someday.” The American Society of Civil Engineers estimates that the US needs about $2.6 trillion in investments just to catch up with deferred infrastructure maintenance. (Including, now, putting my bridge back.) Trillions more will be needed in next-gen infrastructure to deal with the effects of the climate crisis (Goldman Sachs estimates $16 trillion by 2030), from raising miles of rail lines above new floodplains to upgrading the 640,000 miles of 40- to 50-year-old high-voltage transmission lines ($500 billion), which will be necessary to carry the 1,600 gigawatts of power that might be generated by clean new solar and renewable energy farms (another $2 trillion-ish). The rollout of 5G networks alone will drive over $1 trillion in new investment over the next five years.

Much of that investment will be private, that is, made by corporations rather than governments. That raises an interesting investing opportunity, as well as providing a public good.

Infrastructure investments tend to have a series of characteristics that set them apart from other equity or real estate investments. Brookfield Asset Management, which has nearly $700 billion in assets under management, highlights the distinctive investment characteristics of the infrastructure class:

Given their essential nature, these assets often provide investors with stable and secure cash flows, downside protection, diversification from other asset classes, inflation protection, and long-term liability matching. By focusing on essential operating assets, an infrastructure strategy should be resilient in most economic environments. While we believe that infrastructure is compelling for investors across a variety of market conditions, today’s climate appears to be particularly rife with opportunity. (Infrastructure Investing: Why Now? July 2021)

The combination of downside protection (both from income and from the fact that they’re necessary investments to maintain essential services) and upside potential (because demand is soaring and there’s a big backlog of projects already) arguably place the infrastructure asset class in the midpoint between other classes: higher returns than bonds, lower volatility than stocks, potentially with a higher Sharpe ratio than either.

The Australian firm First Sentier Investors has launched the first fund dedicated exclusively to infrastructure investments in the United States. Since its inception (through 3/30/2022), a $10,000 opening investment would have grown by 32.9%. In the same period, the S&P 500 rose 23.5%, and the Morningstar global infrastructure peer group gained 17.8%. That’s a substantial lead, and it’s consistent with the performance of its older sibling, First Sentier’s Global Infrastructure strategy, which since inception, returned 6.4% annually against its benchmark’s 4.2%.

We had the opportunity to speak with one of the fund’s managers about their strategy and its potential role.

The version that headquarters prefers

Jessica Jouning is part of a 10-person team responsible for the American Listed Infrastructure Fund. My suspicion is that she’s… not like the rest of us. She had all of the credentials that one might hope for. Bachelor of Commerce (with Honors) from the University of Queensland. She joined First Sentier in 2010 and has rather more than ten years of experience as an investment analyst, including spending six months in the Global Equities team based in London, an internship at Macquarie Risk Management Group, and a long stint as a member of the Unlisted Infrastructure, Global Resources and Global Fixed Interest and Credit teams in Australia.

The version that shows her day job is way more interesting than mine.

She’s also an infrastructure nerd with responsibilities for railroads and waste disposal, having sort of graduated from covering data centers and ports. A native of New Zealand, she’s also been a commercial helicopter pilot and a scuba instructor and has sailed around the world three times. She is, she reports, “a naturally curious person” and a member of a team that “butts heads sometimes, optimists and pessimists working together to get good outcomes.”

Rather than guess about what Ms. Jouning is thinking, we posed the same question to her that we do to all managers: “before you launched FLIAX, we already had 40 global infrastructure funds on the market, some with a record of 15 or 20 years plus 140 others that focus more broadly on real estate. Why on earth do we need one more choice?” Here are Jessica’s 300 or so words explaining her team’s rationale.

Many people might think that because our fund is new, we’re new at investing in American listed infrastructure. That’s simply not correct. We launched our global listed infrastructure strategy over 15 years ago, and it now has over $10.5 billion in assets. We’ve got over a thousand people working at First Sentier Investors, and we’re responsible for $182 billion in assets.

Since the global infrastructure strategy’s inception, we have been tracking and investing in American listed infrastructure; half of the global fund is in US companies. When we launched the new fund for US investors, we didn’t take up coverage of any extra stocks; we simply focused more on the American investments.

We think American listed investments are special. Infrastructure assets commonly have defensive characteristics of high barriers to entry, strong pricing power, less cyclical, structural growth stories and predictable cash flows that foster stable income and total returns over time. The US is behind the rest of the world in infrastructure ranking. That’s the opportunity. There’s a lot of infrastructure spend that needs to happen in America, strong bipartisan support, and no government funding to support it. As a result, US companies are willing to invest in infrastructure.

We like the US because it is business friendly, has light-handed regulation, accounting transparency, a strong judicial system, rule of law, some of the best management teams and good corporate governance.

And we think we bring a global perspective on a US fund. We’re not just looking at American assets. We’re looking globally at US utilities, looking at global best practices. We travel the world meeting with these companies, forming a view on whether they are good investments. It comes down to trying to deliver performance for our clients, so we look for mispricing within the market. From an infrastructure point of view, most global listed infrastructure funds are based in Australia. We think our competitive advantage is stock picking. We’ve been doing this a long time. We have seen CEOs come and go. We meet the management and middle management teams. We meet with the regulators and form our own views. It’s very specialized.

This is a high barrier-to-entry space; physical assets can’t simply be replicated — networks of cell towers or rail lines, for example. And there are a lot of drivers, such as the need for de-carbonization, that will push growth further in the US.

The historical record is that real assets are a good asset class in an inflationary environment, listed infrastructure is the most robust of the real asset sub-classes … and American listed infrastructure has posted some of the best long-term risk and return metrics.

First Sentier American Listed Infrastructure Fund (FLIAX) nominally has a $1,000,000 minimum initial investment. As a practical matter, the adviser has approved investments as low as $10,000 and will continue doing so, especially given the desire to build fund assets to a large enough level to warrant inclusion on platforms beyond Pershing. The greater inconvenience, for the nonce, is that you will need to invest directly through an adviser. The fund charges 0.75%. The First Sentier American Listed Infrastructure is reasonably rich with direct and linked information (and a cool picture). The Insights page offers an exceptional analysis of American listed infrastructure as an asset class (2021). For investors looking for a bigger picture, the advisor’s “Investing in Infrastructure” page broadens the discussion to global infrastructure and real estate investing, though without the level of detail in the America doc.

© Mutual Fund Observer, 2022. All rights reserved. The information here reflects publicly available information current at the time of publication. For reprint/e-rights contact us.


Briefly Noted . . .

By TheShadow

DoubleLine Capital, Jeffrey Gundlach’s $137bn asset management firm, has received approval from the Securities and Exchange Commission (SEC) to launch two active non-transparent ETFs.

The company initially filed for the strategies – the DoubleLine Opportunistic Bond ETF and the DoubleLine Shiller CAPE US Equities ETF – in October 2021. The funds have expense ratios of 0.5% and 0.65%, respectively.

The funds will not disclose assets every day, and while the equities ETF will make investments ‘related’ to the Shiller Barclays CAPE US Sector TR USD index, both will be actively managed.

The funds would be DoubleLine’s first own active ETFs, though it advises four other ETFs, including State Street’s SPDR DoubleLine Total Return Tactical ETF.

Harbor Strategic Growth Fund is being reorganized back into the Mar Vista Strategic Growth Fund. Back in 2016, the Mar Vista Strategic Growth Fund was reorganized into the Harbor Strategic Growth Fund. The new Mar Vista Strategic Growth Fund will have the same investment objective and substantially similar principal investment strategies and limitations. The reorganization is expected to occur in July 2022.

JP Morgan is converting its JPMorgan Inflation Managed Bond, JPMorgan Market Expansion Enhanced Index, JPMorgan Realty Income and JPMorgan International Research Enhanced Equity Funds into ETFs on April 8, 2022, May 6, 2022, May 20, 2022, and June 10, 2022, respectively. JP Morgan was among the last major investment house to hold out against using the ETF wrapper for its strategies.

Wasatch US Select Fund has been filed for registration. The fund will invest in the equity securities, typically common stock, issued by US companies. They expect to invest the fund’s assets across all market capitalization levels, ranging from micro capitalization stocks to larger capitalization stocks. However, they expect the fund to invest a significant portion of its assets in small to midsize companies with market capitalizations of greater than US $2 billion at the time of purchase.

In Manager-changeland:

George Jikovski has left the team managing River Canyon Total Return Bond Fund (RCTIX). The multi-sector bond fund has nearly tripled the three-year returns of its benchmark (4.9% APR vs. 1.38%) and has grown from $170 million in late 2020 to $1.2 billion in 2022.

Mark Finn, the sole manager for T. Rowe Price Value Fund and co-manager of T. Rowe Price Large Cap Value Fund, will retire at the end of 2022. Ryan Hedrick, a Price analyst, will take over the Value Fund on January 1, while Large Cap Value will continue to be managed by John Linehan, Heather McPherson, and Gabriel Solomon. In general, Price handles manager changes more smoothly than just about any large firm. The track record suggests that there’s little cause for concern here.

Westfield Capital Dividend Growth Fund is to be reorganized into the Harbor Dividend Growth Leaders ETF on or about May 17, 2022.

Small Wins for Investors

Morgan Stanley reopened its Inception, Growth and Discovery Portfolios to new investors on March 15.   Both the Inception and Discovery Portfolios funds have been closed to new investors since April 5, 2021. The Growth Portfolio has been closed since May 21, 2021.

On February 25, Vanguard today reported expense ratio changes for 18 funds across multiple ETF and mutual fund share classes, including a wide range of international strategies. The firm continues to return value to investors through lower fund expenses on its path to returning $1 billion in cost savings to shareholders by the end of 2025:

Vanguard fund and ETF expense ratio changes

Name Ticker 2020 fiscal year-end expense ratio 2021 fiscal year-end expense ratio Change (in basis points)
Vanguard International High Dividend Yield ETF VYMI 0.28% 0.22% -6
Vanguard International High Dividend Yield Index Admiral Shares VIHAX 0.28% 0.22% -6
Vanguard Emerging Markets Government Bond ETF VWOB 0.25% 0.20% -5
Vanguard Emerging Markets Government Bond Index Fund Admiral Shares VGAVX 0.25% 0.20% -5
Vanguard Emerging Markets Government Bond Index Fund Institutional Shares VGIVX 0.23% 0.18% -5
Vanguard International Dividend Appreciation ETF VIGI 0.20% 0.15% -5
Vanguard FTSE All-World ex-US Small-Cap ETF VSS 0.11% 0.07% -4
Vanguard International Dividend Appreciation Index Admiral Shares VIAAX 0.20% 0.16% -4
Vanguard FTSE Emerging Markets ETF VWO 0.10% 0.08% -2
Vanguard Emerging Markets Select Stock Fund VMMSX 0.85% 0.84% -1
Vanguard Explorer Fund Investor Shares VEXPX 0.41% 0.40% -1
Vanguard Explorer Fund Admiral Shares VEXRX 0.30% 0.29% -1
Vanguard FTSE All-World ex-US ETF VEU 0.08% 0.07% -1
Vanguard Mid-Cap Growth Fund VMGRX 0.34% 0.33% -1
Vanguard Tax-Exempt Bond Index Fund ETF VTEB 0.06% 0.05% -1
Vanguard Total International Bond ETF BNDX 0.08% 0.07% -1
Vanguard Total International Stock ETF VXUS 0.08% 0.07% -1
Vanguard Total World Stock ETF VT 0.08% 0.07% -1
Vanguard International Value Fund VTRIX 0.35% 0.36% 1
Vanguard International Explorer Fund VINEX 0.39% 0.40% 1
Vanguard Selected Value Fund VASVX 0.31% 0.32% 1
Vanguard Windsor Fund Investor Shares VWNDX 0.29% 0.30% 1
Vanguard Windsor Fund Admiral Shares VWNEX 0.19% 0.20% 1
Vanguard Alternative Strategies Fund VASFX 0.78% 1.28% 50

Closings (and Related Inconveniences)

The $3.6m Cannabis Growth ETF (BUDX) will be liquidated on April 29. It converted its Investor share class to Institutional in May 2021, and we reported the “same portfolio of nine stocks whose P/E ratios run from 828 to (-294).” When it slashed its minimum investment from $100,000 to $2,500, we noted: “there are those who might suggest that ‘growth’ is a misnomer.”

In September 2021, when it converted to being an active ETF, we reminded folks that it had booked annualized losses of 10.8% since inception.

With its dissolution, Morningstar’s estimable Jeff Ptak tweeted:

Cannabis Growth ETF ($BUDX) is to be liquidated on or about 4/29/22. It lost ~72% from incept to Mar. ‘20; then soared 325% over next 11 mos.; only to shed ~65% of its value between Feb. ‘21 and now. All told, lost ~58% of its value since incept.

By way of context, every cannabis-related fund and ETF has lost money since inception:

We offer this as a cautionary tale to the investors who’ve recently poured $80 billion into odd little thematic funds—our suggestion: don’t.

Clough China Fund will liquidate on or about April 22, 2022.

Fidelity is going to liquidate its series of Flex Funds:  Opportunistic Insights, Large Cap Value, Real Estate, Large Cap Growth, Inflation-Protected Bond Index, Short-Term Bond, International Fund, Core Bond, Intrinsic Opportunities, Small Cap, and Mid Cap Growth are to be liquidated on or about June 10, 2022.

Janus Henderson will liquidate its Emerging Markets Managed Volatility, Global Income Managed Volatility, and International Managed Volatility Funds on or about May 20, 2022.  Two of the funds managed by Intertech,  which are being sold to a group including Intech management, Janus Henderson US Managed Volatility and Janus Henderson US Low Volatility funds, are being transferred to Janus Henderson to manage.

JP Morgan Emerging Markets Strategic Debt Fund will be liquidated on or about April 29, 2022.

Loomis Sayles Intermediate Municipal Bond will be liquidated on or about April 28, 2022.