


As we go to press, the S&P 500 is at its highest level in history: 5137. It set a record by passing 5000 for the first time on February 12, then another record high of 5100 two weeks later.
In reality, of course, the S&P is not rocketing upward. The S&P 7-to-10 is, with the other 490-493 stocks as an afterthought. The top 10 stocks contributed 93% of the index’s 2023 gains. Goldman Sachs declares that the “S&P 500 index is more concentrated than it has ever been,” while Amundi, Europe’s largest asset manager and one of the world’s top six, claims it’s merely “at its highest level in over 30 years.” Folks trying to ease anxiety about that point to the fact that the market has been more concentrated before: in the mid-60s, the top 10 accounted for 40% of the market (which then … uhh, crashed), and at the end of the 90s they hit 25% of the market (which then … uhh, crashed).
Torsten Sløk, chief economist at Apollo Global Management, a US private equity firm with over $500 billion in assets under management, seems to think that’s a bad sign. “The top 10 companies in the S&P 500 today are more overvalued than the top 10 companies were during the tech bubble in the mid-1990s” (Daily Spark, 2/25/2024). The Shiller CAPE ratio, which looks at the price of stocks relative to long-term earnings, sits at its third-highest level in 150 years.
For the past 15 years or so, that hasn’t been cause for alarm. The period we describe as The Great Distortion saw stocks routinely gain historically unprecedented valuations and suffer a series of relatively bloodless crashes: the market would crash by a third, then bounce promptly back. The Covid Crash took the market down 34% … and lasted just over one month. Those quick recoveries were driven by TINA: with nominal interest rates near zero, real interest rates below zero, and an infinitely inventive Federal Reserve ready with ever more innovative rescue schemes, cash was trash, bonds were losers, and There Is No Alternative to the stock market.
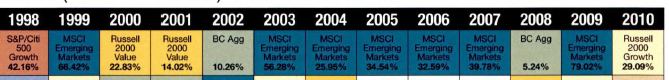
The Callan Table of Periodic Investment Returns offers one way to capture the effect of The Great Distortion. Here are the top-performing asset classes each year prior to The Great Distortion.
And the best asset classes in the years since. (Callan has done some relabeling, so index names in the old chart are replaced by asset class names in the new one.)
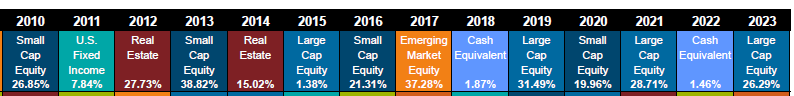
Before The Great Distortion, US large caps won once in 12 years (an 8% win rate, 1998-2009). Afterward, they won four times (a 29% win rate, 2010-present). US equities won three times (twice, small value) in 13 years (23% win rate, with two wins by small value) versus eight times in 14 years (a 57% win rate). Despite frequent crashes, US equities have been two to four times likelier to “win” than previously.
Many argue (likely, hope) that The Great Distortion is ending. Interest rates are in the vicinity of their 100-year average, and the Fed seems disinclined to reward the markets with premature reductions in them. That means that cash offers a real return (one-month Treasuries are offering a 5.5% yield in early March 2024), and bonds have the potential to challenge stocks for investors’ attention.
If you believe that the markets are normalizing, then you might attend to the implications of GMO’s recent asset class forecasts.
GMO, a Boston-based institutional investment firm founded by Jeremy Grantham, has released its latest “if only the world were normal” projections for 5–7-year asset class performance. It’s a monthly exercise, perhaps a public service, that garners some small notice in the investing community. The most recent forecast, like most of its immediate predecessors, is profoundly negative toward US equity investments and relatively positive toward investments in emerging markets.
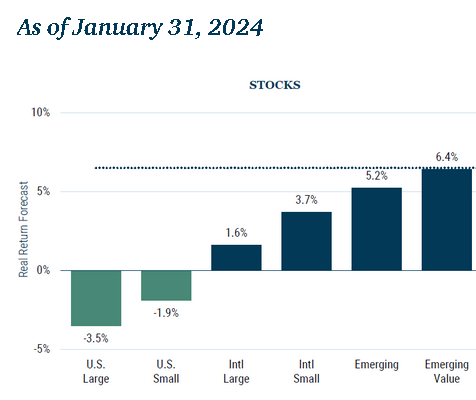
The projections, they aver, are “based upon the reasonable beliefs of GMO” and include a projected inflation rate of 2.3%. That means that the “real” returns projected above are projected asset class returns minus 2.3%.
Two notes:
-
Before The Great Distortion, when the US Fed found an almost-infinite array of ways to prop up the market, GMO’s forecasts were “stunningly accurate.” The correlation between GMO and reality was 0.94%, with GMO tending to be just a bit optimistic in their predictions. Mr. Grantham’s 10-year projection, from the beginning of the century through 2009, was “almost exactly right.”
That “exactly rightness” is reflected in the performance of GMO’s strategies in the years before the Fed rushed to the rescue. Using the fund screener at MFO Premium, I pulled the relative return rankings for all GMO strategies. MFO Premium, MFO’s partner site, offers the most comprehensive set of risk and performance data available to retail investors and smaller RIAs. In this case, we asked, “How many of GMO’s strategies had top 20% returns each year in the early 2000s?” With eight strategies, on average, 1.6 of them would land in the top tier. GMO crushed that threshold almost every year. For the sake of brevity, we’ll show only the even-numbered years:
-
- 2000: 4 of 8 funds had top 20% returns
- 2002: 6 of 8 did
- 2004: 4 of 9 (they added a new EM debt fund)
- 2006: 1 of12 did (most were average to above-average that year)
- 2008: 6 of 13 did
In general, GMO was very right, very often.
-
-
Since The Great Distortion, “the actual performance of the major asset classes over the past decade has been almost perfectly inverse to GMO’s predictions” (“The Perils of Long-Term Forecasting – GMO Edition,” Financial Times, 8/17/2023). US large-cap stocks, the assets most benefited by the Fed’s largesse, “smashed everything.”
Once the Fed blew up the relationship between risk and reward, GMO’s projections became contrarian indicators: everything that was cheap got cheaper, and everything that was expensive got more so.
It happens. Speaking with Pensions & Investments, GMO’s founder Jeremy Grantham explained:
My estimate is something like 85% of the time the market is approximately reasonable, approximately efficient. Close enough. And then 15% of the time, it’s not. That divides something like 11% or 12% crazy optimism and 3% or 4% crazy pessimism. And that seems to be the model. (“Jeremy Grantham’s investment bubble gains extend to his venture capital phase,” PIOonline, 10/31/2023)
Other major investors – not the Krypto Kids, certainly, but folks who have managed through a lot of storms, seem to point in the same general direction as GMO.
J.P. Morgan is only slightly more optimistic about the next five years. They’ve plotted the five-year returns of the S&P based on how high valuations were at the start of the period.
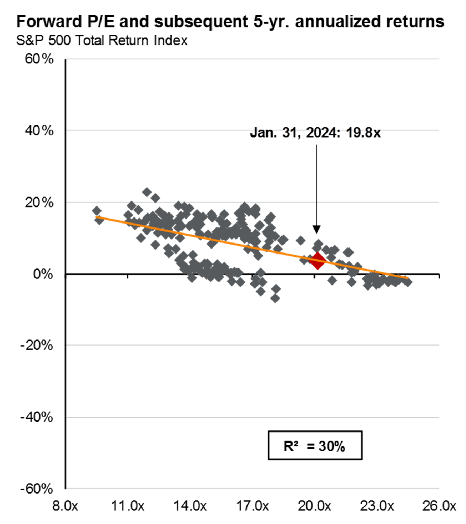
I would read that as “5% before inflation” as their expectation (Guide to the Markets, Q1/2024).
The fascinating Asset Allocation Interactive tool, published by Research Affiliates, offers two projections for the 10-year returns on the US stock market. If valuations matter, they expect real returns of 1.5% per year for a decade with volatility of 15.5%. If, however, valuations are not factored in, and we look only at dividends and growth, then returns soar… to 4% per year. In contrast, returns on EM equity are projected at 7.5% (valuations matter) or 6.8% (only yield and growth matters).
The Implication
The end of The Great Distortion does not mean that stocks are about to crash. It might mean that the securities that benefited the most and the longest from the era of free money and guaranteed Fed protection, US mega-cap growth stocks, have lost their grip. Other assets, not deeply undervalued relative to US large caps, might be expected to outperform with some consistency.
What to do about it?
There are no guarantees, which is the argument for diversification. Because 15 years is an eternity in investing, it’s a concept little-valued by many.
Consider an equal-weight S&P 500 index. These funds place an equal amount in each of the index’s 500 stocks. The flagship is Invesco S&P 500 Equal Weight ETF (RSP), which charges 0.20% and has outperformed the S&P 500.
Consider a fundamental-weight S&P 500 index. These are funds that weight the S&P 500 stocks based on the performance characteristics of the underlying corporation, not their stocks’ popularity. The two Great Owl funds there are Schwab Fundamental US Large Company Index (SFLNX) and Invesco S&P 500 Revenue ETF (RWL).
Consider an actively managed multi-cap fund. These are funds whose managers invest across the size spectrum, sometimes tilting toward larger stocks and sometimes toward smaller ones. Two Great Owl funds to consider are Prospector Capital Appreciation (PCAFX) and Smead Value (SMVLX).
Consider a flexible portfolio fund. These are funds whose managers have the freedom to move toward what they perceive as the market’s most attractive options at any given point. Unlike the funds above, they are often more risk-conscious and oriented toward absolute returns (that is, avoiding negative years). Two Great Owl funds to consider are FPA Crescent (FPACX, the largest single holding in Snowball’s portfolio) and Buffalo Flexible Income (formerly Buffalo Balanced, BUFBX).
Consider adding small international stocks. No funds in this realm earn a Great Owl designation. In place of that, we identified funds with a combination of the highest Sharpe ratios – the standard measure of risk-adjusted returns – and Martin ratios – a measure that strongly weighs downside performance. Three distinguished funds by those measures are Fidelity International Small Cap (FISMX), Driehaus International Small Cap Growth (DRIOX), and Pear Tree Polaris Foreign Value Small Cap.
Consider adding emerging markets stocks. Many of our preferred EM funds, Seafarer Overseas Growth & Income and Seafarer Overseas Value as examples, do not yet have 15-year records. The two most distinguished funds that have crossed that threshold are both passive funds: SPDR S&P Emerging Markets Small Cap ETF (EWX) and PIMCO RAE PLUS EMG (PEFFX). The PIMCO fund uses a Research Affiliates index which has a distinct value tilt.
Performance comparison, 15 years (through 01/2024)
| APR | Return vs peers | Sharpe ratio | US large cap exposure | Great Owl? | Morningstar | |
| Invesco S&P 500 Equal Weight | 16.0 | +2.7 | 0.89 | 35 | Yes | Five stars |
| Schwab Fundamental US Large Co Index | 16.4 | +3.2 | 0.95 | 68 | Yes | Five stars |
| Invesco S&P 500 Revenue ETF | 115.8 | +2.6 | 0.95 | 67 | Yes | Five stars |
| Prospector Capital App | 11.0 | -2.2 | 0.81 | 38 | Yes | Five stars |
| Smead Value | 16.6 | +3.4 | 0.92 | 46 | Yes | Five stars |
| FPA Crescent | 10.2 | +1.7 | 0.83 | 31 | Yes | Four stars, Gold |
| Buffalo Flexible Income | 10.9 | +2.3 | 0.81 | 72 | Yes | Three stars, Gold |
| Fidelity International Small Cap | 11.7 | +1.6 | 0.65 | – | No | Five stars, Neutral |
| Driehaus International Small Growth | 12.2 | +1.7 | 0.66 | – | No | Five stars, Bronze |
| Pear Tree Polaris Foreign Value Small Cap | 12.0 | +0.9 | 0.93 | – | No | Four stars, Bronze |
| SPDR S&P Emerging Markets Small Cap ETF | 9.5 | +1.8 | 0.44 | – | Yes | Five stars, Bronze |
| PIMCO RAE PLUS EMG | 11.5 | +3.8% | 0.47 | – | Yes | Four stars, Bronze |
| US Total Stock Market Index | 15.7 | 0.96 | 71 | No |
Source: MFO Premium data screener. Note: Lipper peer groups differ from fund to fund, so the annual return compared to peers might seem inconsistent from one row to the next. That’s simply different peer groups within the same broad theme (international smaller companies or multi-cap funds).
The Bottom Line
If you believe that The Great Distortion has ended, that inflation is real, and that interest rates will not return to the zero-to-negative range they occupied since 2008, then you might also want to take GMO’s projection more seriously.
That implies relying less on strategies that depend on Fed largesse and market mania and more on strategies that have worked well even while out of favor. We close with Mr. Grantham:
I would say that financial markets are very inefficient, and capable of extremes of being completely dysfunctional. (Stephanie Dahle, “Get Briefed: Jeremy Grantham,” Forbes.com, 1/26/2009)