


David Snowball wrote The Rise of the Active ETFs in the July 2019 Mutual Fund Observer newsletter describing actively managed exchange-traded funds as:
“Active ETFs are a sort of hybrid between more traditional ETFs and actively managed mutual funds. Like traditional ETFs, they trade on the secondary market which means that the advisor doesn’t need to keep cash on hand in order to meet day-to-day withdrawal needs. Some of the expenses traditionally borne by the advisor either don’t exist (ETFs have fewer shareholder reports than, by law, mutual funds do) or are shifted to the brokerage firm. They also offer a structural tax advantage: shareholders aren’t responsible for the yearly tax consequences (and record-keeping) of the manager’s moves; shareholders are taxed only when they sell their shares.”
Actively managed exchange-traded funds are becoming a lot more popular. This article identifies nearly one hundred high-performing actively managed ETFs. This article is divided into the following sections:
- Section 1, Containing the Science Project
- Section 2, Emerging from the Forest into the Trees
- Section 3, Short List of Great Owl Funds
- Section 4, Franklin International Core Dividend Tilt Index ETF (DIVI)
- Section 5, Portfolio of Outperforming Actively Managed Funds
CONTAINING THE SCIENCE PROJECT
Without meaning to turn this into a large science project, I extracted 471 actively managed ETFs that had at least $10 million in assets under management, outperformed their category peers by at least 1.5 percentage points, and had expense ratios of one percent or less. There are actively managed, index, enhanced strategy, managed volatility, and Smart Beta categories with funds often overlapping multiple categories. Through a process of elimination, I narrowed the list down to less than one hundred high-performing funds separated into five tables in this article.
Figure #1 shows that approximately 65% of the outperforming funds are less than seven years old.
Figure #1: Age of Outperforming Actively Managed ETFs
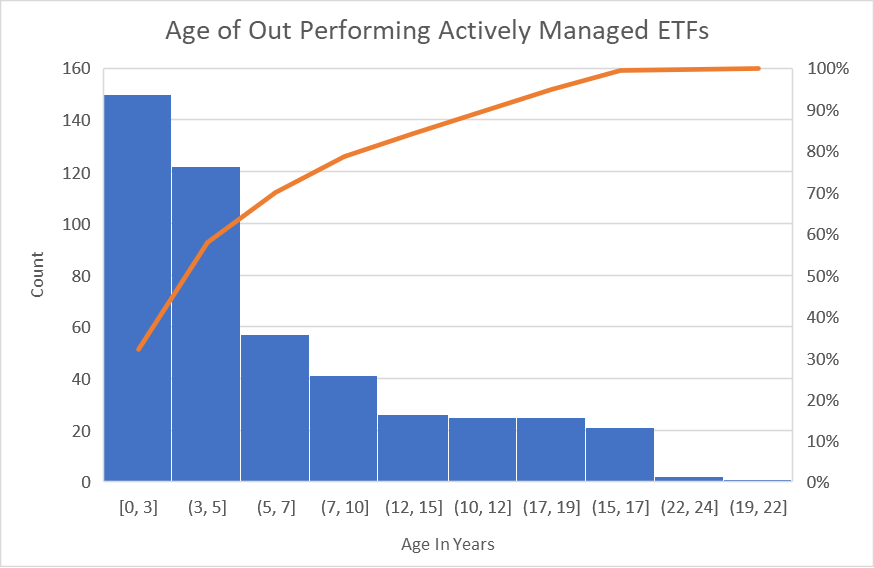
Source: Author using MFO Premium data screener
I will separate the “well-known outperforming actively managed ETFs” with over $5B and look at them separately. Figure #2 shows Assets Under Management versus Age of the remaining 362 outperforming actively managed ETFs with less than $5B in AUM. The regression line identifies 129 “up and coming” future bond and equity stars (above the blue line) that have AUM more than 71 times multiplied by the age in years. There are twenty “unappreciated Great Owl funds” among those that have not attracted investors’ interest (below the dashed line).
Figure #2: Outperforming ETFs with Less Than $5B in AUM
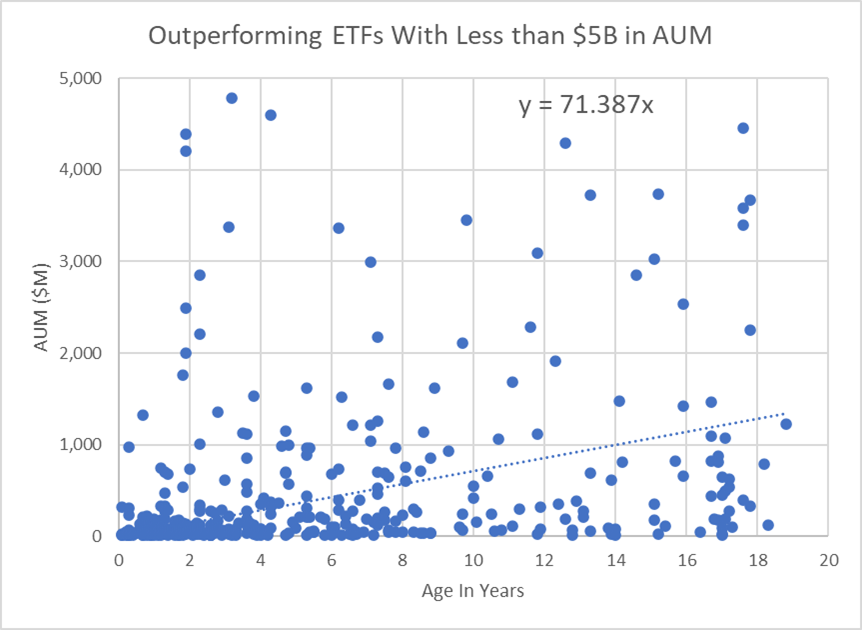
Source: Author using MFO Premium data screener
From Table #1, we can see that funds that are “Smart Beta” or “Fund of Funds” have lower outperformance as measured by “APR vs Peer” than those that are. We will analyze “Fund of Funds” and “Smart Beta” as a separate group.
Table #1: Average APR vs Peer for Life of Fund
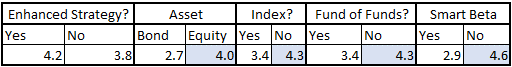
Source: Author using MFO Premium data screener
EMERGING FROM THE FOREST INTO THE TREES
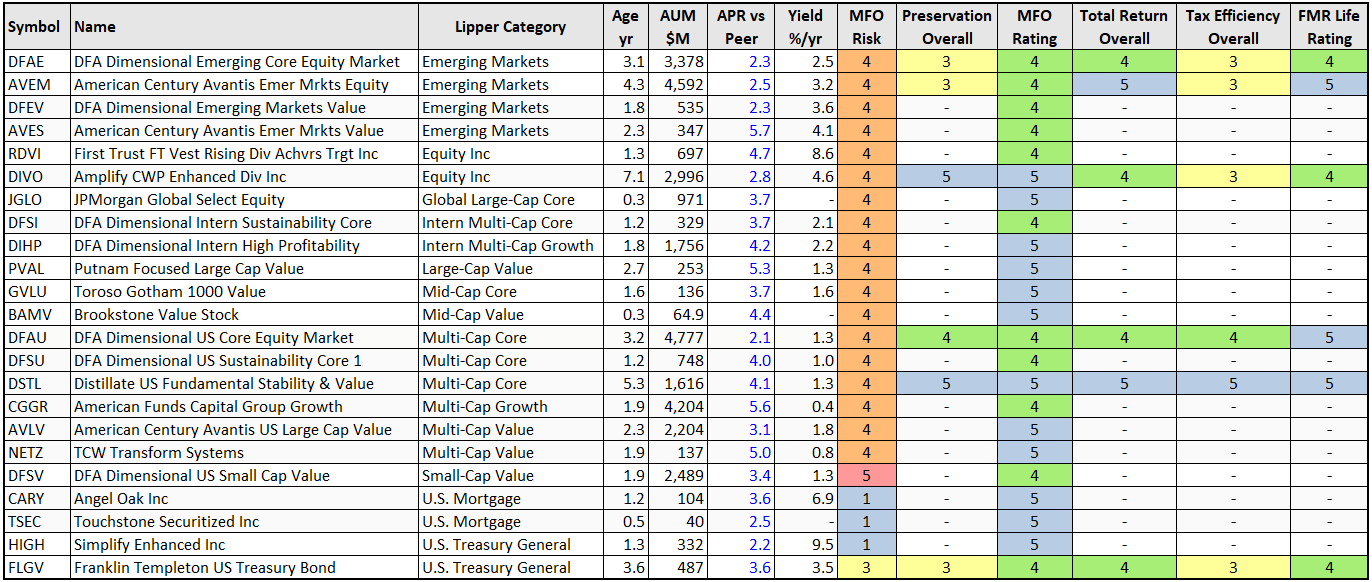
The original 471 funds were pared down to 98 based on “APR vs Peer” and risk-adjusted performance over multiple periods. Table #2 contains the equity funds that investors have recognized as outperformers as reflected by having more than $5B in assets under management.
Table #2: Recognized Outperformers with More than $5B in AUM (Life of Fund)
Source: Author using MFO Premium data screener
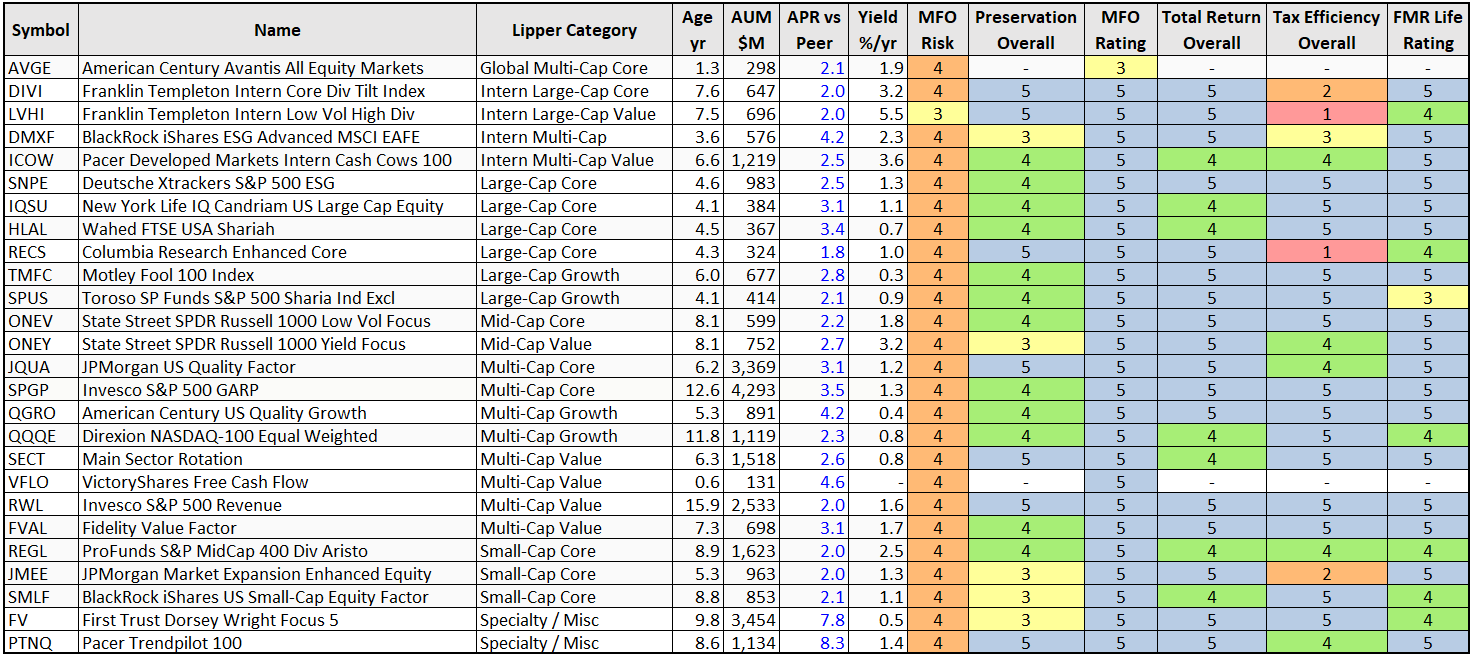
Table #3 contains the outperforming funds that investors are recognizing as “Up and Coming Future Stars” as measured by AUM relative to age. As can be seen, most of the funds have not been in existence for more than three years.
Table #3: Up and Coming Future Stars with Less Than $5B in AUM
Source: Author using MFO Premium data screener
Table #4 contains outperforming funds classified as Great Owls by Mutual Fund Observer that investors have not committed to as measured by AUM relative to age.
Table #4: Under-Appreciated Great Owls (Life of Fund)
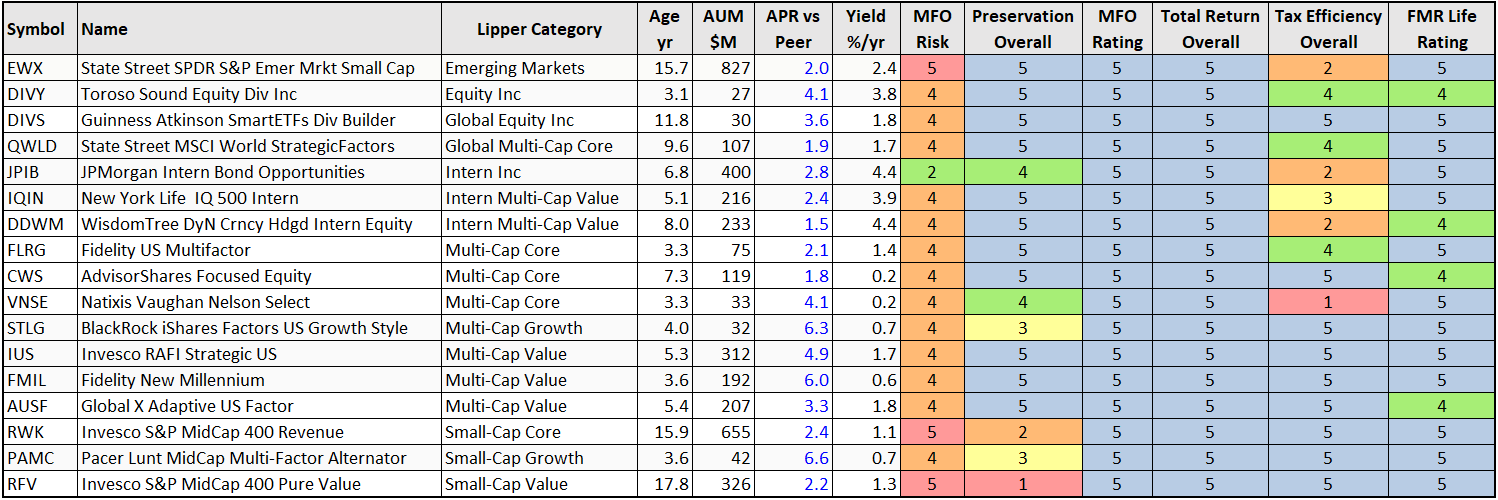
Source: Author using MFO Premium data screener
Table #5 contains only Smart Beta funds and Fund of Funds.
Table #5: Outperforming Smart Beta and Fund of Funds
Source: Author using MFO Premium data screener
Table #6 contains Mixed Asset, Sector, and Options Arbitrage/Strategies and Managed Futures Funds.
Table #6: Other Notable Outperformers
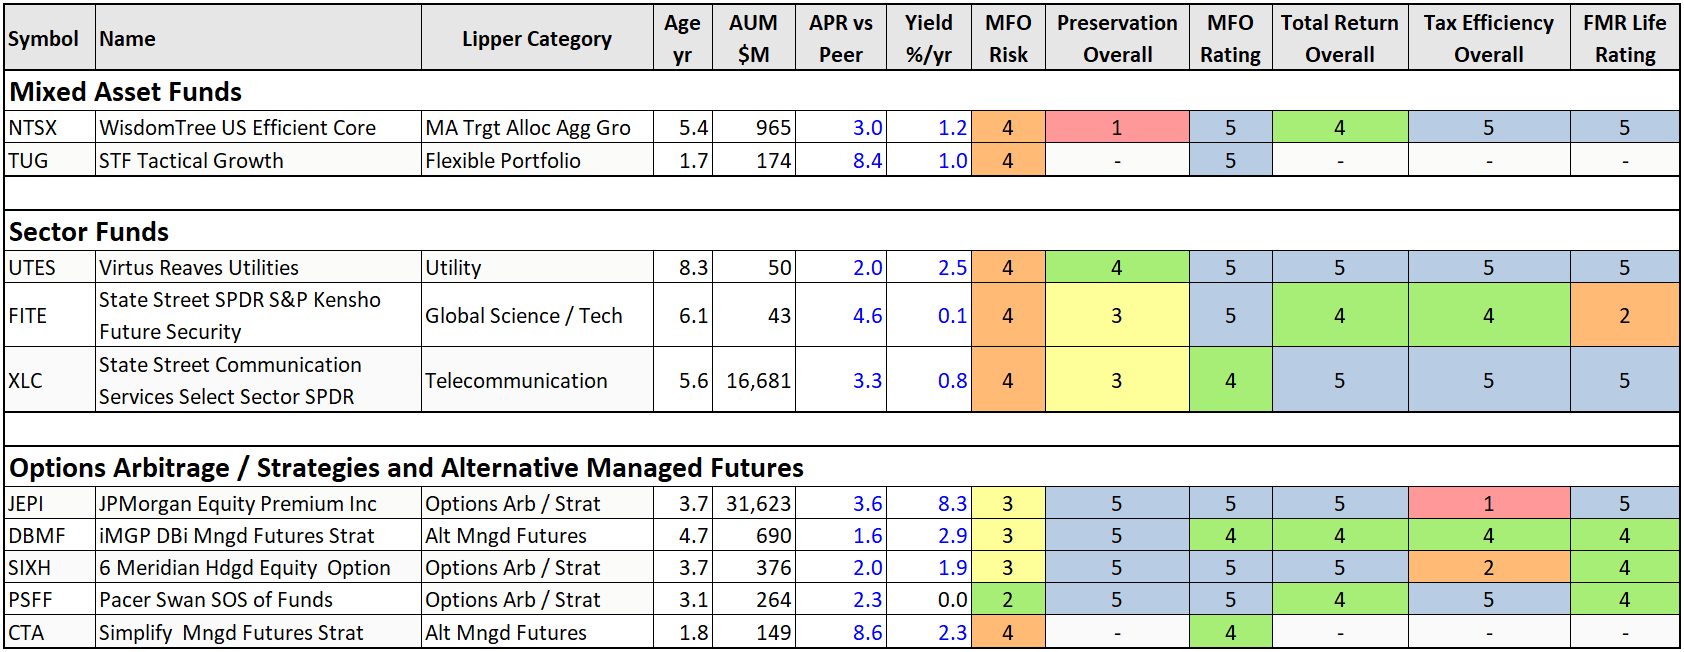
Source: Author using MFO Premium data screener
SHORT LIST OF GREAT OWL FUNDS
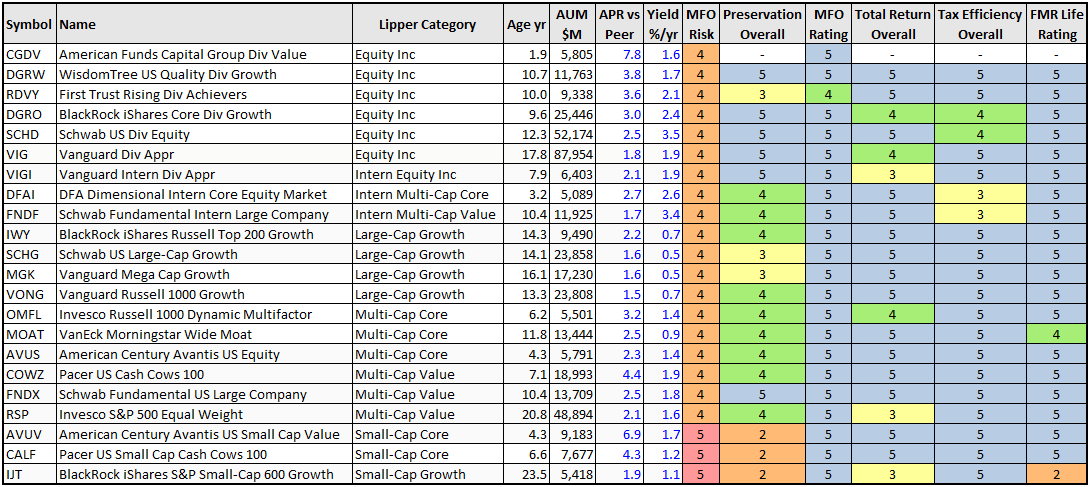
I then went through the 98 funds and selected no more than one fund per Lipper Category based on relative performance over multiple time periods with the exception of the Mult-Cap Value category which has two funds. Table #7 contains my short list of funds. Since I have already written about and like the Fidelity New Millenium Fund (FMIL), I selected Franklin International Core Dividend Tilt Index ETF (DIVI) as a fund to profile in the next section.
Table #7: Short List of Outperforming Funds (Metrics – Three Years)
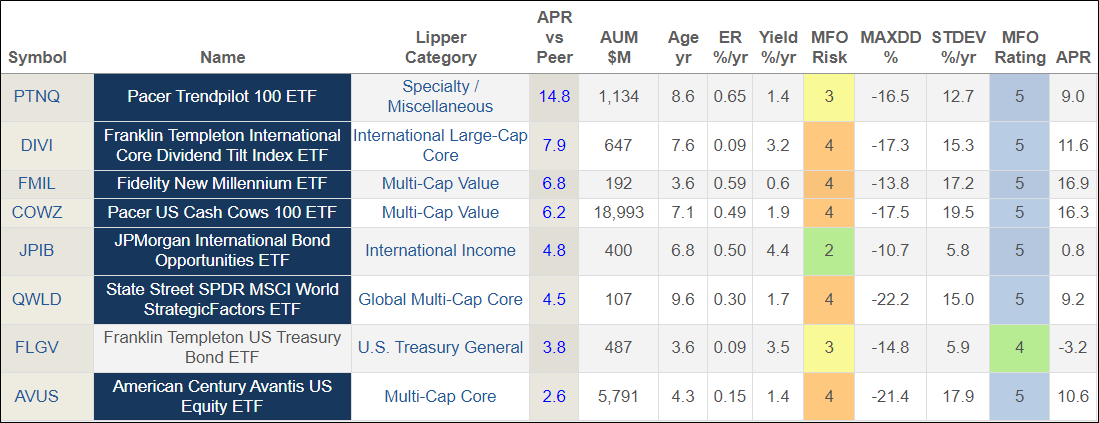
Source: MFO Premium data screener
Outperformance is measured relative to peers in the same Lipper Category and does not imply that the category performed well, for example, bonds in Figure #3.
Figure #3: Short List of Outperforming Funds
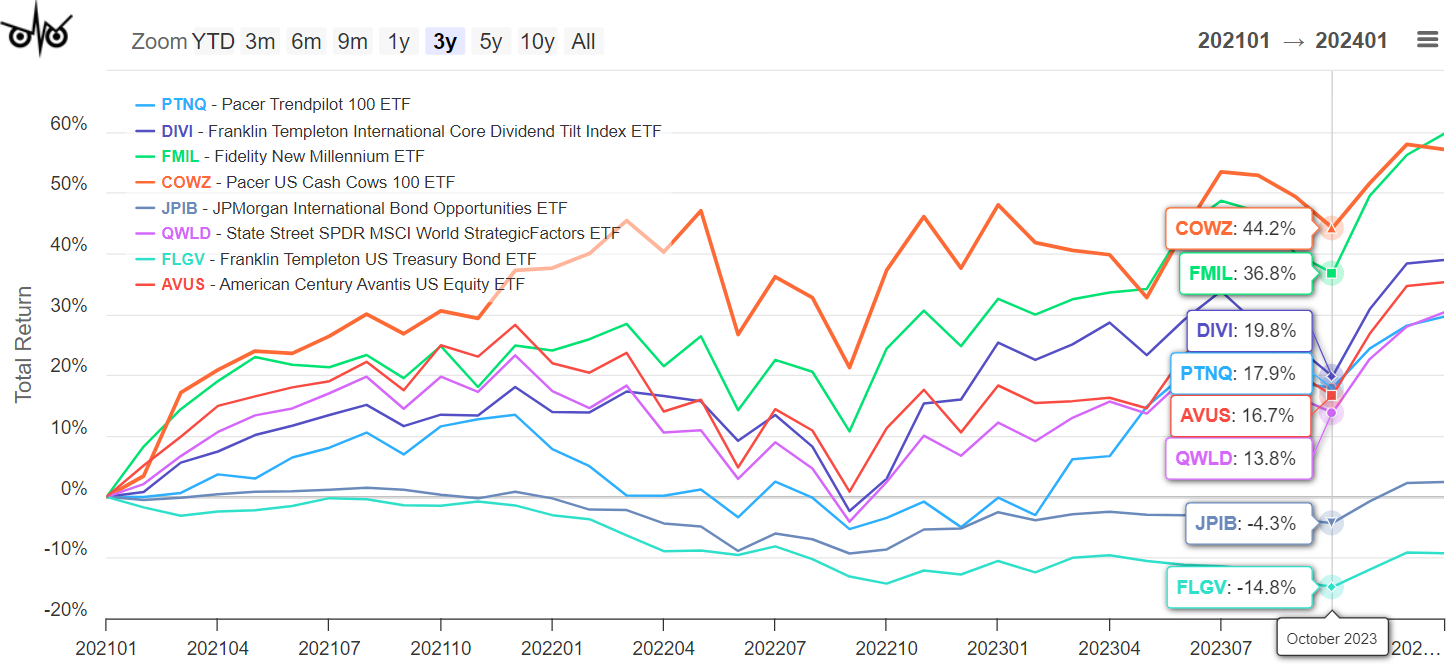
Source: Author using MFO Premium data screener
FRANKLIN INTERNATIONAL CORE DIVIDEND TILT INDEX ETF (DIVI)
Franklin International Core Dividend Tilt Index ETF (DIVI) has $675 million in assets under management in 463 mid- and large-cap holdings with an expense ratio of 0.09%. The 30-Day SEC Yield is 3.9%. The trailing price-to-earnings ratio is 13.3. Fifty-seven percent of its assets are in Europe, with 28% in Asia, and 11 percent in Australia and New Zealand. Nearly 60% of the assets are invested in Financials (23%), Health Care (12%), Industrials (11%), and Consumer Discretionary (11%). The Fund was changed in August 2022 to track Linked Morningstar Developed Markets ex-North America Dividend Enhanced Select Index and modified its principal investment strategies.
The link to the Prospectus is here. The Principal Investment Strategies are,
“Under normal market conditions, the Fund invests at least 80% of its assets in the component securities of the Underlying Index and in depositary receipts representing such securities. The Underlying Index is a systematic, rules-based proprietary index that is maintained and calculated by Morningstar, Inc. (Morningstar or Index Provider). The Underlying Index is based on the Morningstar® Developed Markets ex-North America Target Market Exposure Index (Parent Index) and is constructed by applying an optimization process to the Parent Index that aims to deliver a higher dividend yield than the Parent Index, while limiting expected tracking error to the Parent Index (i.e., to provide a “dividend tilt” through the selection and weighting of securities from the Parent Index)…”
Fred Piard, a quantitative analyst with a Ph.D. in computer science, wrote about Franklin International Core Dividend Tilt Index ETF (DIVI) in “A Leading International Dividend Fund” on Seeking Alpha. Mr. Piard lists several competitor funds which I include in Table #8 for the past eighteen months since August 2022.
Table #8: DIVI and Comparable Fund Performance (18 months)
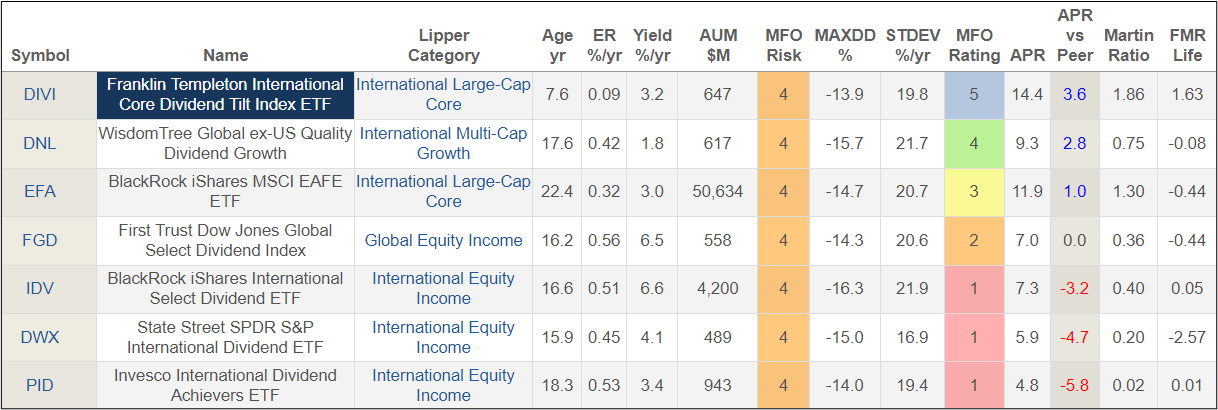
Source: MFO Premium data screener
PORTFOLIO OF OUTPERFORMING ACTIVELY MANAGED FUNDS
I take portfolio optimization with a grain of salt because results are based on historical data which may not represent future performance; however, much insight can be gained. I loaded twenty-five funds into Portfolio Visualizer Portfolio Optimization and through a process of elimination narrowed the list down to ten to maximize the Sharpe Ratio. The link to Portfolio Visualizer Portfolio Optimization is here. I use constraints on allocations to mimic a balanced portfolio.
Figure #4: Portfolio of Actively Managed Funds to Maximize the Sharpe Ratio
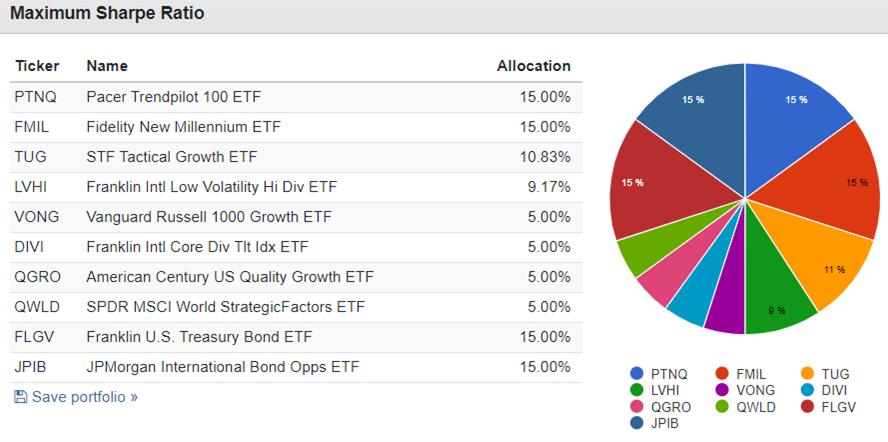
Source: Author Using Portfolio Visualizer
Table #9 shows that the Portfolio of outperforming actively managed ETFs had a higher return with lower volatility and drawdown than the Vanguard Balanced Index Fund.
Table #9: Performance of Maximum Sharpe Ratio Portfolio (18 Months)
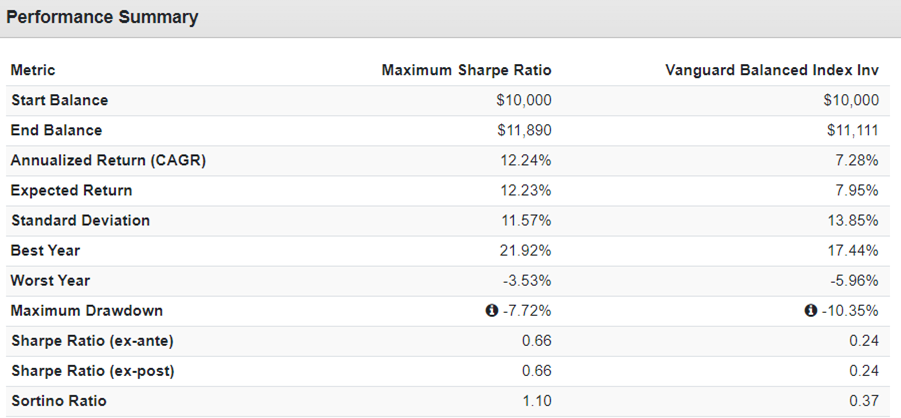
Source: Author Using Portfolio Visualizer
I used the Portfolio Visualizer Backtest Portfolio to get the stock-to-bond ratio. The link to the Portfolio Visualizer Backtest Portfolio is here. The Outperformers portfolio is approximately 63% stock.
Table #10: Performance of Maximum Sharpe Ratio Portfolio (18 Months)
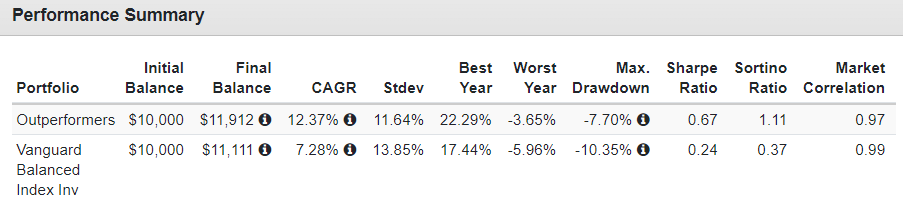
Source: Author Using Portfolio Visualizer
Figure #5 is a visual representation of the performance.
Figure #5: Outperforming ETF Portfolio vs Vanguard Balanced Index Fund
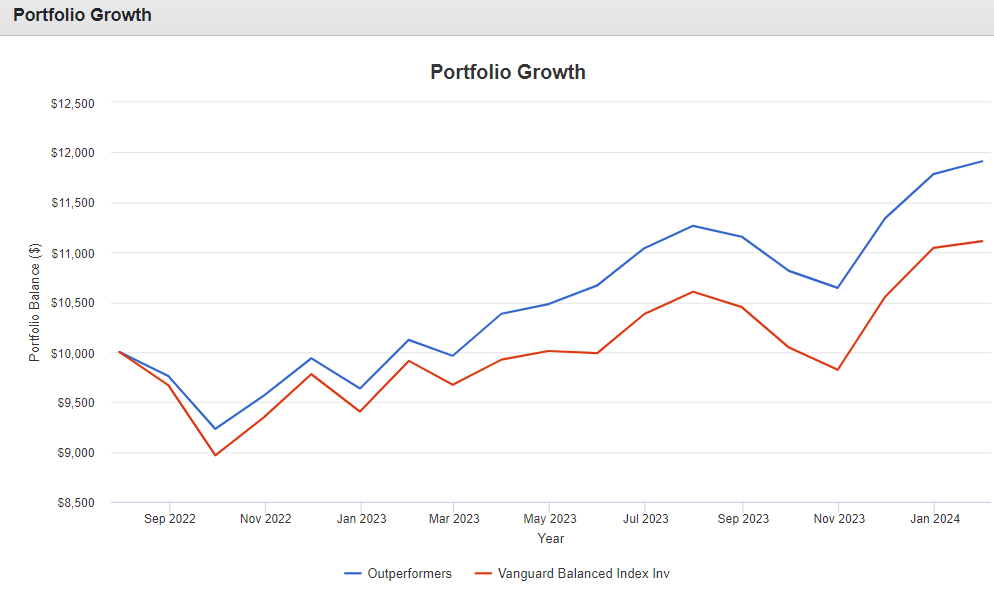
Source: Author Using Portfolio Visualizer
Closing
Actively managed ETFs have some advantages over mutual funds. This article shows that many ETFs maintain this advantage over the long term. I added the outperforming actively managed ETFs that I was not tracking to my MFO Watchlists. These will become a larger part of my fund selection going forward.
Best Wishes for Investing in 2024!