


Having looked at the qualitative rationale for why options-based funds are offered by fund managers and sought by some investors, it behooves us to quantitatively analyze options funds’ performance. There is no ONE BENCHMARK that can be used to compare ALL the options funds. That may be a good thing. It’s made me think of what a good way to create a customized benchmark for each fund might look like. The benefit of keeping things focused on the small picture is we can look at one fund at a time, in detail, without drawing too many generalizations.
Challenges with option fund performance comparisons
The majority of option funds have only been around for a few years. This creates challenges in evaluating their performance. For example:
- It’s not possible to run 10, 20, or 30-year analyses on a large enough sample of these funds and we cannot evaluate the funds as an Asset class.
- Diversity within the options-based funds makes it difficult to compare any 2 funds. One of the goals of the accompanying article was to point out the different types of Equity sleeves and the differing choices made by fund managers. We can’t compare Large-cap Tech stocks to small-call International value stocks any more than we can compare option income/premium funds to hedged equity funds. Add the funky new class of funds that carry just one stock and overwrite daily or weekly options. There is NO PEER group here. Peer Averages mean nothing.
- The last major 50% equity market crash was in 2007-2009. Most of these funds didn’t exist in that crash or the 2000-2002 50% crash. We don’t know how these funds will perform in the next major crash. (PS: There will always be a next major crash no matter how good everything looks at the moment).
- The importance of observing active option portfolios through a stock market crash (even bearish portfolios) is to learn how the fund manager deals with coincident problems of illiquidity, high transaction costs, and volatility to get in and out of stocks and options. Derivative markets need deep liquidity in underlying stocks. In crashes, when this liquidity disappears, derivative market makers simply walk away or show absurd prices. How will that affect options funds? We don’t know yet.
- When funds have a young age, their performance records are dictated by the timing of the launch and not necessarily the long-term merit of a strategy. There is no need to get too excited about every new options strategy. Active equity picking, high fees, and the burden of trading a large number of derivative contracts all add up as costs. Options exchanges and options market makers are raking in tons of revenue. Who’s paying for it? Don’t look around. It’s all the money going into Zero Day options and options funds.
Challenges with option fund performance comparisons: the S&P 500 is an unbeatable index
When I am introduced to any new US Equity linked fund, my first instinct is to compare it to the S&P 500. Is the fund unique in any way that can help my portfolio grow?
Comparing equity options funds to the S&P 500 (or the Nasdaq 100 where applicable) yields predictably disappointing total results.
To understand why, we must focus on Fund Betas.
The S&P 500, that is, the market in US equities, by definition has a Market Beta of 1.
The Betas of most of these options funds (orange squares in the chart) are lower than 1 (the S&P 500 marked by the Green mountain range).
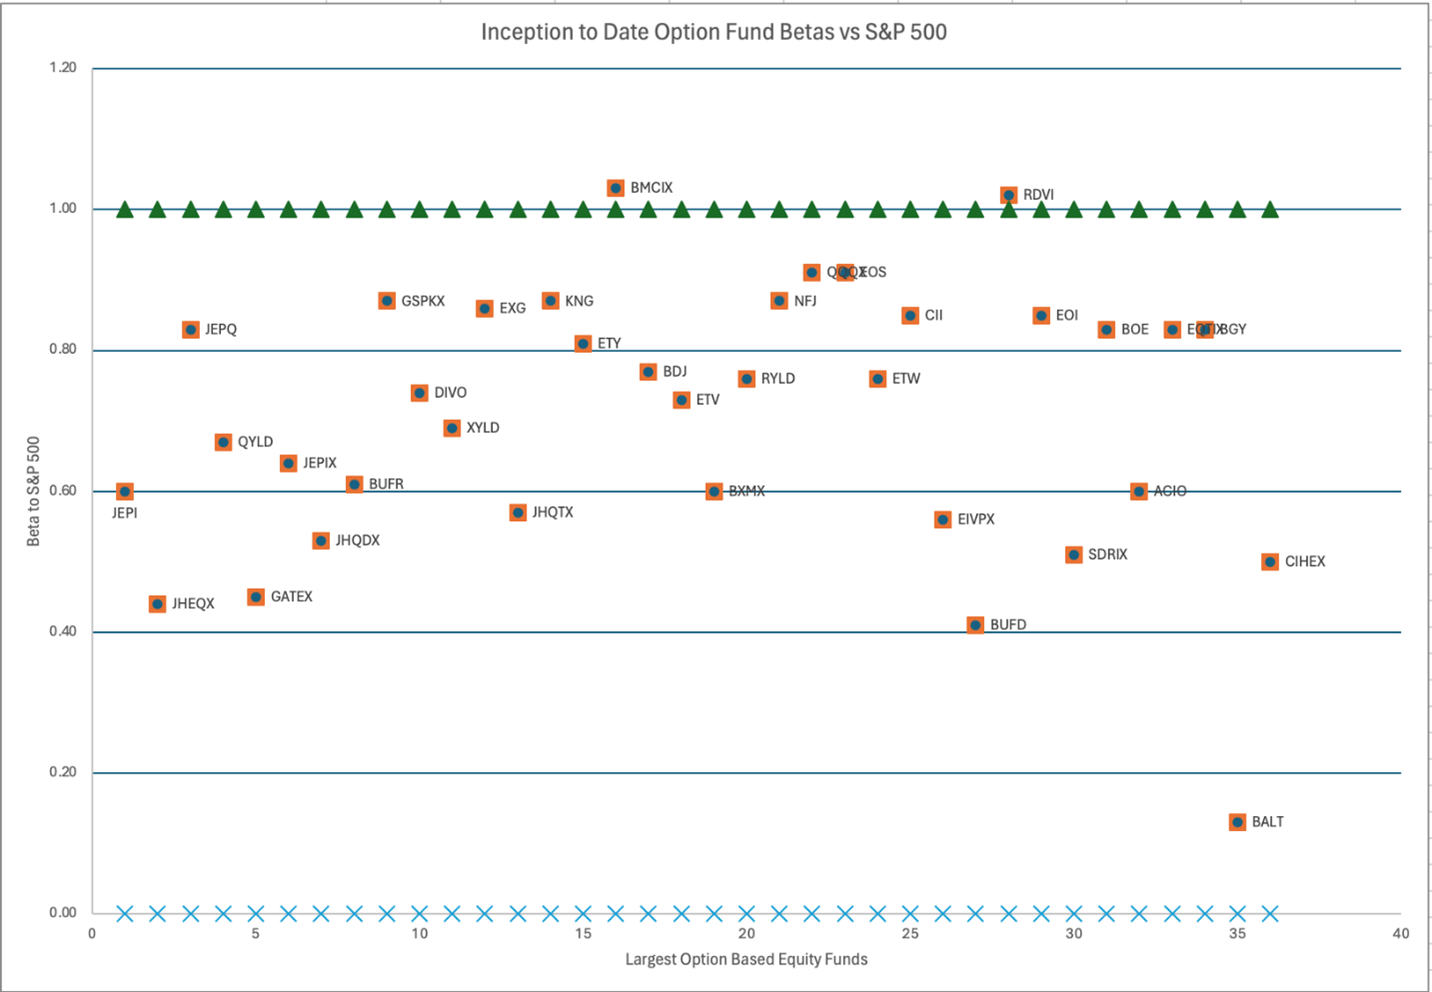
Since US equity markets have gone up over the years, a lower beta = lower market exposure = lower total returns.
It’s important to capture the proper window for calculating returns. I’ve tried to do that below.
Using the narrow list of funds we qualitatively described in the accompanying article, I show each fund’s launch date (Column 4) and the evaluation window (Column 5). Then, in Column 6, I look at the Annualized return of the fund since that date and compare it to the Annualized Return of SPY in that window (Column 7).
Comparing Columns 6 and 7 should point out that other one fund, JPMorgan Nasdaq Equity Premium Income (JEPQ), no other large options fund beat the simple passive SPY. What a bummer!
Column 8 compares the Fund’s annualized returns to the SPY’s to show what % of the SPY the fund earned.
Table 1
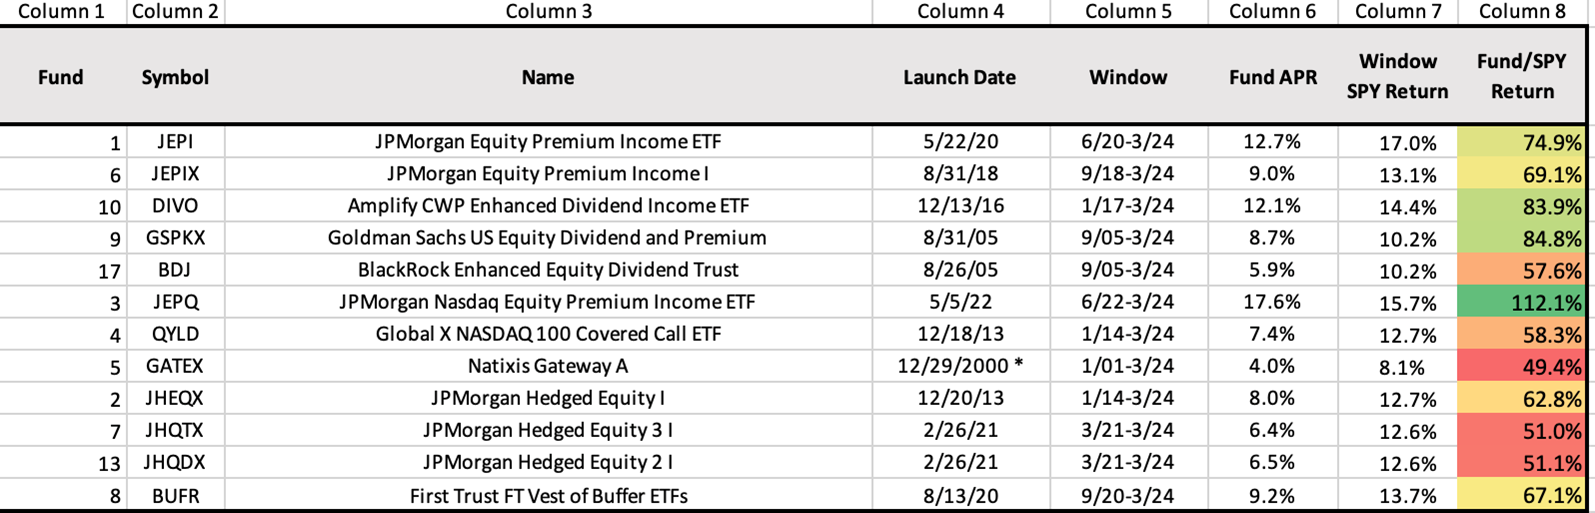
On average, this small selection of funds mostly underperformed SPY.
(Fund #3) JEPQ earned 112.1% of SPY while (Fund #5) GATEX earned only 49.4% of the SPY.
Why did JEPQ make money? Because the Equity sleeve is the Nasdaq 100 type names. Nasdaq beat the S&P massively since the 2009 bull market started.
However, QYLD did not succeed. Why? Reason #1, while JEPQ sells out-of-the-money calls on the Nasdaq to earn Income, QYLD sells At-the-money calls. In an index going straight up, how we use options matters. Reason #2, QYLD has been around since 2013 while JEPQ is younger. It’s another lesson to wait and slow down. New funds have a timing good luck/bad luck factor.
Take a truer comparison. For JEPQ and QYLD, let’s use QQQ instead of SPY and we get this:
Table 2
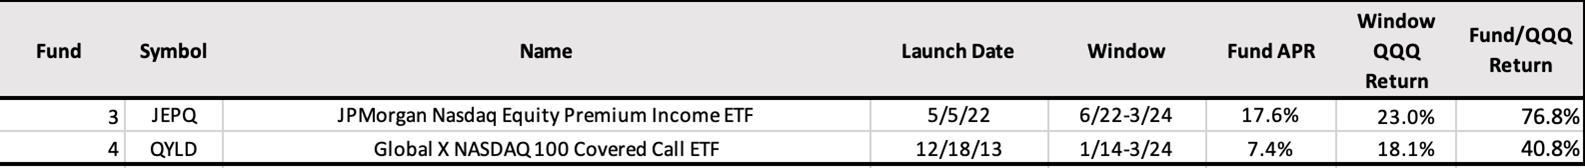
JEPQ no longer looks like a star and QYLD looks like a total dud.
In any case, this analysis in incomplete. Looking only at the Total Return does a disservice to the options funds. There are other metrics like the fund’s relative St. Dev to the SPY, Betas, or the Sharpe ratios, the worst drawdowns, etc. Let’s take one of those metrics and stretch our analysis.
Comparison to the S&P 500: Standard deviation matters
Investors’ expectation is not that options funds would earn higher returns. Rather, investors hope the funds will exhibit lower volatility and make the ride smoother. The investors hoped to still earn some of the equity returns with lower volatility than the market.
Table 3
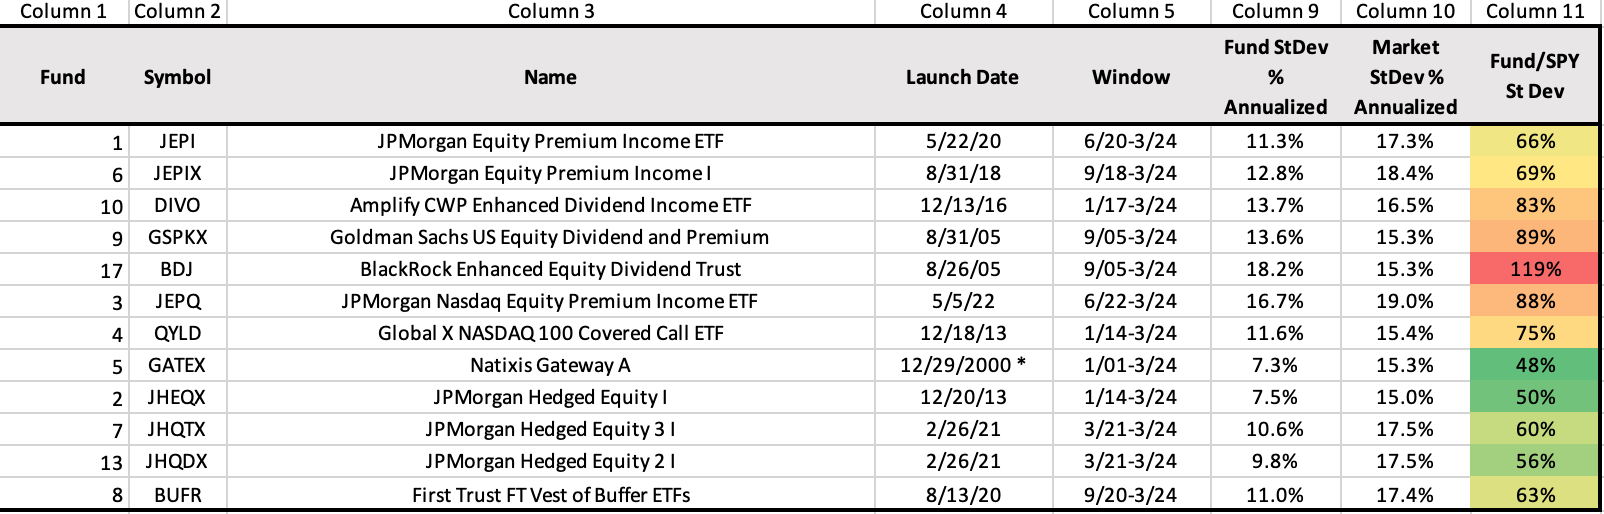
In fact, that’s very much the case. In the above table, calculated using Portfolio Visualized, I’ve highlighted our small group of funds, this time, in Columns 9 and 10, I’ve presented how volatile the fund has been during the window on an annualized basis versus the volatility of the Market. We’ve used % Annualized Standard Deviation as a measure. In Column 11, we show the St. Dev of the fund as a % of the SPY.
We can see that all except (Fund #17) BDJ had a lower standard deviation than the SPY with the triplets of JHEQX/JHQTX/JHQDX (Fund 2, 7, 13) showing the lowest Std. Deviation compared to the SPY.
BUFR (Fund 8) is not far behind.
These funds are common in that these last 5 funds in that table are “Hedged”, “Protected”, or “Buffered” and intend to provide downside protection. The ones above tend to be Income providers and provide no downside protection.
In layman’s terms, this is a vindication of the fund managers’ advertisement pitch and the investor’s hopes: Lower returns accompanied with lower volatility.
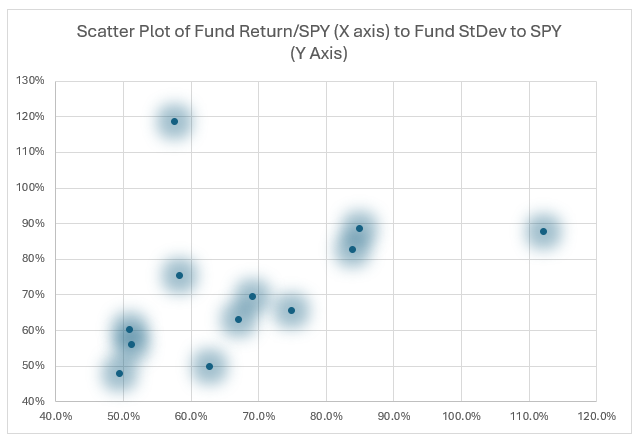
Combining the two tables above, I’ve plotted the Return % of these funds and the Std Dev of these funds compared to the SPY. In short, returns between 50-90% with a volatility of 50-90% of the SPY.
Chart 1
Creating a replicating portfolio to push our analysis even further:
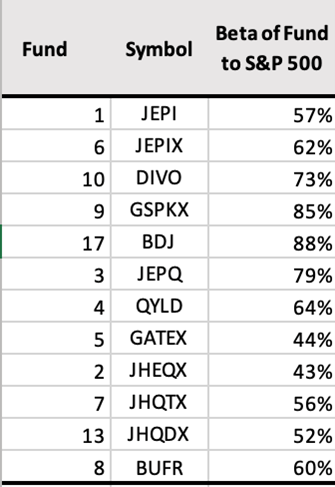
Why should we allow options funds an easy pass? In financial markets, there are multiple way to get to the same end point. We now know that options funds have a lower Beta to the S&P 500 (as calculated through Portfolio Visualizer)
Table 4
Let’s take just one fund, JEPIX, which is the Mutual Fund equivalent to JEPI. Together they hold a combined $39 Billion in assets. Using Portfolio Visualizer, I checked the Beta of JEPIX for each calendar year since its inception in Fall of 2018.
Table 5
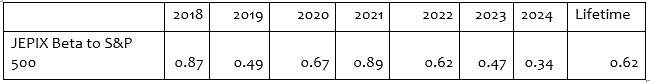
JEPIX Betas change dramatically from year to year and seem to be on a downward trend recently.
Why does the Beta move so much year to year? It could be the Equity Sleeve and which stocks go in the portfolio. Perhaps the fund managers have a lower volatility portfolio of stocks in 2024 compared to 2013. It could also be the interaction of the options used with the Equity Portfolio and their combined effect.
It doesn’t matter. These funds are constantly changing their underlying characteristics because they are Actively managed. We can’t tell what the Fund manager is thinking. What we CAN DO is tell what the historical Betas have been.
In the case of JEPIX, the story is that this Fund has a lifetime of 0.62 to the S&P 500 Index.
Proposal: Create a Replicating Portfolio
We know that the beta of the S&P 500 (which stands for the market index in the USA) is 1 and we know the Beta of T-Bills is 0. T-Bills have zero beta because these under 1-year Government instruments have nothing to do with the Stock Market. They are short-term obligations of the US Government issued by the Department of Treasury to fund the Government.
We can combine a simple 2 fund portfolio of SPY and T-Bills with the ratio of 61% SPY and 39% BIL (the T-Bill ETF). They won’t have a Beta exactly of 0.62 (in fact, according to Portfolio Visualizer), the 2-fund Replicating Portfolio has a Beta of 0.59 during our Replicating window of Sep 2018 to March 2024. That’s fine. We are shooting for simplicity.
Furthermore, we can choose an option for Annual Rebalancing in portfolio visualizer so the SPY+BIL portfolio rebalances to 62% SPY every calendar year. (If we don’t do that, SPY will keep becoming a bigger % of the portfolio. We want to match the approximate Beta of JEPIX on average over its life).
I ran that simple 2-fund portfolio in Portfolio Visualizer alongside JEPIX. Charts and statistics:
Chart 2
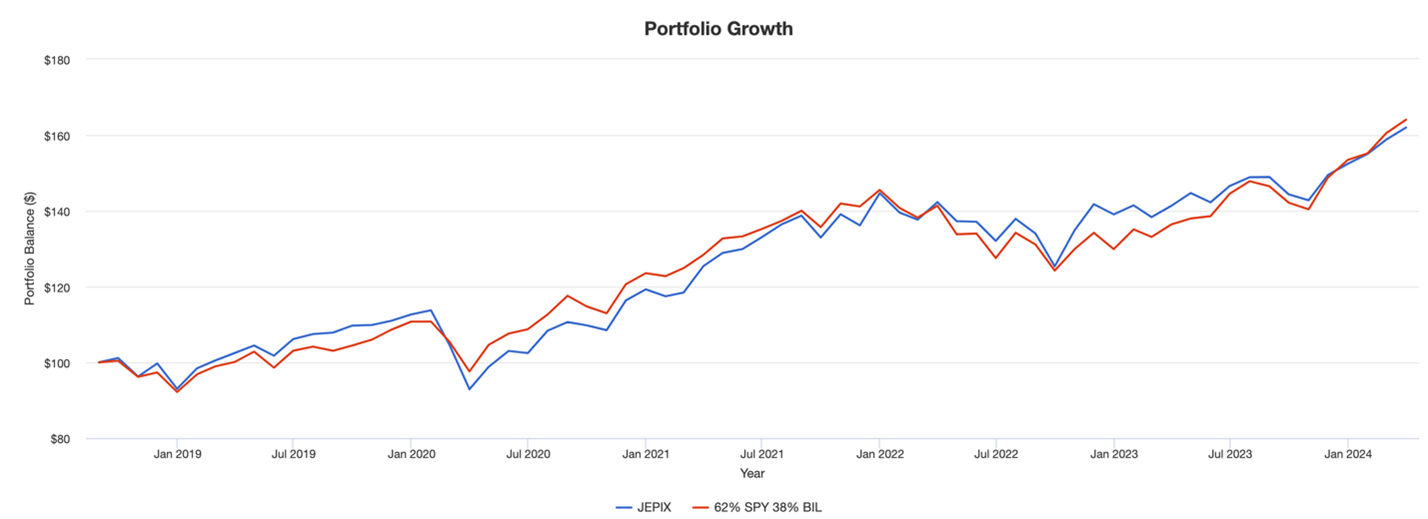
Do you see the difference between the blue line JEPIX and the red line, Replicating portfolio?
NO? Because there isn’t any. The two charts look almost the same. Maybe a little more return in some periods and give back in others, but the differences are minuscule.
Table 6

$100 invested in JEPIX and the 2-fund portfolio would be equal just about the same 5 ¼ years since launch.
For some investors, it might not matter that JEPIX is no better than a simple 62/38 SPY/BIL portfolio. That it’s earned 9% annualized is good enough. My goal is not to get investors to buy or not buy a fund. It is to help simplify and demystify a fund.
Our analysis brings us as close to home as we can expect to be. If we can take all the magic provided by all the financial products and simplify it so we can understand how we can reconstruct that magic ourselves, then we might feel a little more confident in our decision-making process.
Let’s take a case where the results are NOT equal: GATEX
Step 1: Determine a window to calculate Beta. Let’s go with 7 years
Table 7

Step 2: Equivalent Portfolio = 46% SPY 54% T-Bill for period 2018 to 2024 March. Choose Annual Rebalancing in Portfolio Visualizer
Step 3: Output 1: Chart3
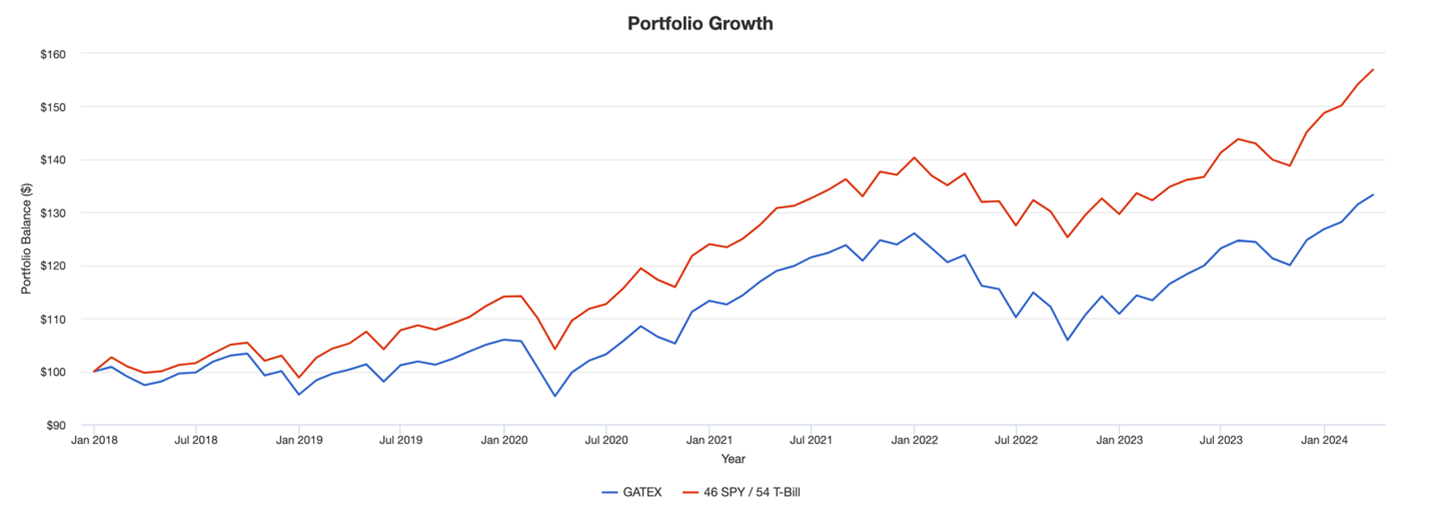
Output 2: Metrics: Table 8

GATEX underperforms the Replicating Portfolio by 2.77% per year with a higher Standard Deviation than the Replication.
By all metrics, GATEX cannot beat a passive replicating portfolio. It has a larger max drawdown and a worse Sharpe Ratio.
Let’s take a case where the options fund works well: JPMorgan Hedged Equity Fund (JHEQX).
Step 1: Determine a window to calculate Beta. Let’s go with 7 years
Table 9

Step 2: Equivalent Portfolio = 41% SPY 59% T-Bill for period 2018 to 2024 March. Choose Annual Rebalancing in Portfolio Visualizer
Step 3: Output 1: Chart 4
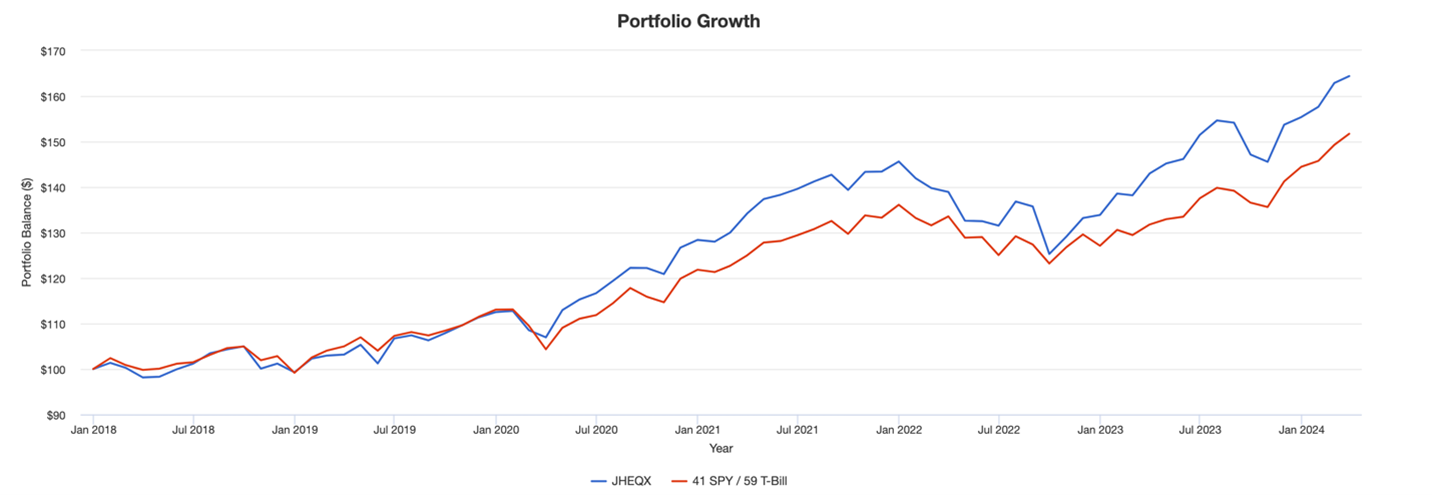
Output 2: Metrics
Table 10

JHEQX had a higher annualized return of 1.4% over the last 7 years than its Replicating Portfolio, albeit also slightly higher standard deviation.
JHEQX is a good example of an option fund that has so far worked.
Proper evaluation is hard work
We only studied a small number of the over 300 funds dedicated to this space, evaluated an even smaller number, and so we don’t want to make too much out of our analysis.
Evaluation requires some work for each fund. It’s not plug-and-play because the Replication portfolio for each fund needs to first be determined based on the past Beta of the options fund.
We need a history for each fund. We can’t do this analysis for a new fund until we’ve seen its beta versus the S&P.
Since I cannot do this for 300 options funds, (and new funds are starting every day), my goal was to set a framework that others can build on.
Let’s talk about the fund that looks decent: JPMorgan Hedged Equity Fund (JHEQX)
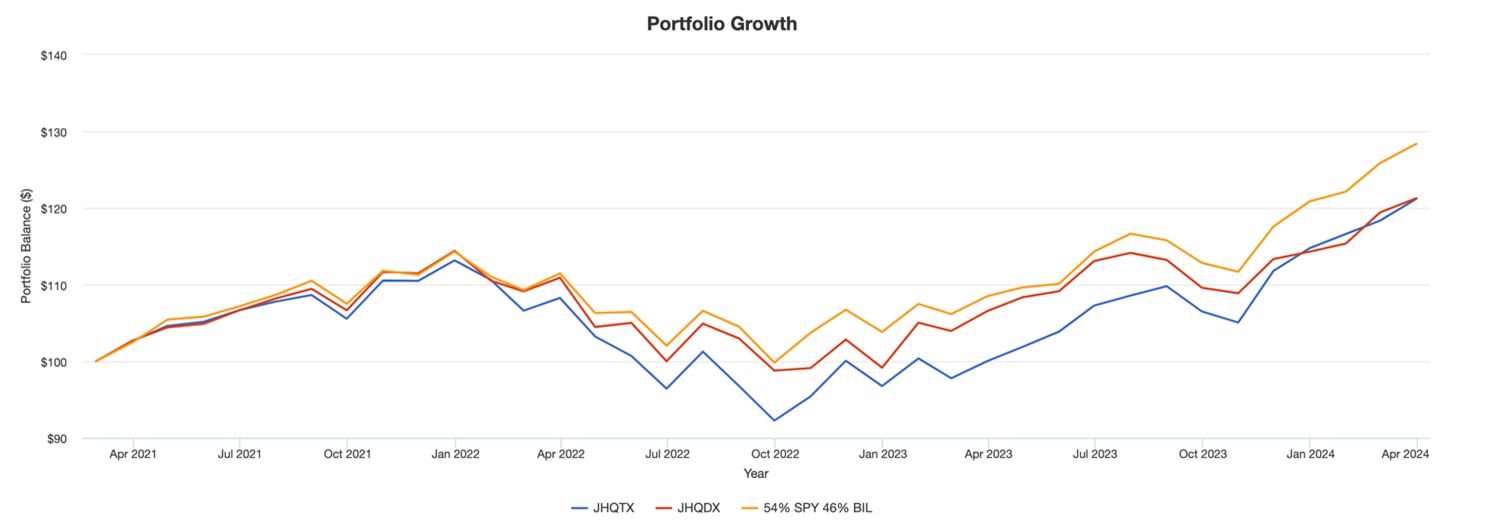
JHEQX is a low-beta fund. At the 0.41 beta, it did a good job outperforming the equivalent SPY and T-Bill portfolio. An interesting follow-up here would be the newer JHQTX and JHQDX, designed in the same vein as JHEQX. As Chart 5 below shows, the Replicating Portfolio’s Orange line beat them both. Maybe the funds need more time? Every time we think options funds might outperform, we peel the onion, and the evidence calls for more time or more analysis.
Chart 5
The Equity Sleeve
Before we conclude, I want to point out that choosing the right Equity Sleeve is very important. A long Nasdaq equity sleeve was so powerful over the last 10-years that it washed away any crimes committed on the options legs.
On the other hand, choosing EM or Developed Market Passive Equity sleeve could have been a terrible choice. No amount of options cleverness would have dissolved the crime of being invested in a passive EM ETF.
Coming to an end: There is a reason why people buy/hold these funds
We took a disparate group of options-based funds and united them. We showed that Total Returns and standard deviation had to be looked at in sync and we accomplished this through the fund’s historical betas, created replicating portfolios, and used the fund’s return series to compare to the replicating portfolios. Our results are important because they are grounded in simplicity, and anyone can replicate the results. Anyone can determine if “their” fund holds water.
While analyzing quantitatively is important, we should remember people buy these funds for at least a few different reasons:
- Their brokers/advisors sell them the funds
- Investors are not interested in creating low-beta portfolios and rebalancing
- Earning income used to be important in a zero-rate world. Options funds had a place. With T-Bills at 5.25%, maybe the options for Income funds need to be rethought. But once invested, the inertia to take money out is great. Investment products are sticky.
- Tax bills are always a hindrance.
If we visit David Snowball’s thesis, “30% Equity Allocation gets you a majority of the stock market’s returns but skip most of the volatility”, we can appreciate the beauty of low-beta portfolios (the success of JHEQX). Some options Funds promise and deliver the low beta portfolios. Some funds do it better than others (= GATEX) and it’s our job as end investors to pick the good ones and ignore the poor ones.
While options-based funds hold no magic bullets, and a majority of their returns can be replicated by simple SPY+T-Bill portfolios, there will always be a demand for options funds. For as long as investors have been invested in risky assets, they have wanted a smoother ride.