By Leigh Walzer
Bartolo Colon is a baseball pitcher; he is the second oldest active major leaguer. Ten years ago he won the coveted Cy Young award. Probably no investment firm has asked Colon for an endorsement but maybe they should. More on this shortly.
FROM THE MAILBAG:
A reader in Detroit who registered but has not yet logged into www.Fundattribution.com writes: “We find little use for back tested or algorithmic results [and prefer an] index-based philosophy for clients.”
Index funds offer a great approach for anyone who lacks the time or inclination to do their homework. We expect they will continue to gain share and pressure the fees of active managers.
Trapezoid does not advocate algorithmic strategies, as the term is commonly used. Nor do we oppose them. Rather, we rigorously test portfolio managers for skill. Our “null hypothesis” is that a low-cost passive strategy is best. We look for managers which demonstrate their worth, based on skill demonstrated over a sufficient period of time. Specifically, Honor Roll fund classes must have a 60% chance of justifying their expenses. Less than 10% of the fund universe satisfies this test. Trapezoid does rate some quantitative funds, and we wrote in the November edition of Mutual Fund Observer about some of the challenges of evaluating them.
We do rely on quantitative methods, including back testing, to validate our tests and hone our understanding of how historic skill translates into future success.
VULCAN MIND MELD
A wealth manager (and demo client) from Denver asks our view of his favorite funds, Vulcan Value Partners (VVPLX). Vulcan was incepted December 2009.Prior to founding Vulcan, the manager, C.T. Fitzpatrick, worked for many years at Southeastern under famed value investor O. Mason Hawkins. Currently it is closed to new investors.
Should investors abandon all their confidence when a good manager retires and passes the baton? Should investors give the fund a mulligan when a poor performer is replaced? Probably not.
VVPLX has performed very well in its 6 years of history. By our measure, investors accumulated an extra 20% compared to index funds based on the managers’ stock selection skill alone. We mentioned it favorably in the October edition of MFO.
Vulcan’s expense structure is 1.08%, roughly 90bps higher than an investor would require to hold a comparable ETF. Think of that as the expense premium to hire an active manager. Based on data through October, we assigned VVPLX a 55% probability of justifying its active expense premium. (This is down from 68% based on our prior evaluation using data through July 2015 and places them outside the Honor Roll.)
The wealth manager questioned why we classify VVPLX as large blend? Vulcan describes itself as a value manager and the portfolio is heavily weighted toward financial services.
VVPLX is classified as large blend because, over its history, it has behaved slightly more like the large blend aggregate than large value. We base this on comparisons to indices and active funds. One of our upcoming features identifies the peer funds, both active and passive, which most closely resemble a given fund. For a majority of our funds, we supplement this approach by looking at historic holdings. We currently consider factors like the distribution of forward P/E ratios over time. Our categorization and taxonomy do not always conform to services like Morningstar and Lipper, but we do consider them as a starting point, along with the manager’s stated objective. We frequently change classifications and welcome all input. While categories may be useful in screening for managers, we emphasize that the classifications have no impact on skill ratings, since we rely 100% on objective criteria such as passive indices.
The client noted we identified a few managers following similar strategies to VVPLX who were assigned higher probabilities. How is this possible considering VVPLX trounced them over its six-year history?
Broadly speaking, there are three reasons:
- Some of the active managers who beat out VVPLX had slightly lower expenses
- While VVPLX did very well since 2010, some other funds have proven themselves over much longer periods. We have more data to satisfy ourselves (and our algorithms) that the manager was skillful and not just lucky.
- VVPLX’s stock selection skill was not entirely consistent which also hurts its case. From April to October, the fund recorded negative skill of approximately 4%. This perhaps explain why management felt compelled to close the fund 4/22/15
Exhibit I
| |
|
Mgr. Tenure |
sS* |
sR* |
Proj. Skill (Gross) |
Exp. |
∆ |
± |
Prob. |
| Boston Partners All-Cap Value Fund [c] |
BPAIX |
2005 |
1.4% |
0.3% |
0.88% |
0.80%(b) |
23 |
1.5% |
56.1 |
| Vulcan Value Partners Fund |
VVPLX |
2010 |
3.8% |
1.5% |
1.19% |
1.08% |
.25 |
1.8% |
55.2 |
- Annualized contribution from stock selection or sector rotation over manager tenure
- Expenses increased recently by 10bps as BPAIX’s board curtailed the fee waiver
- Closed to new investors
Exhibit II: Boston Partners All-Cap Value Fund
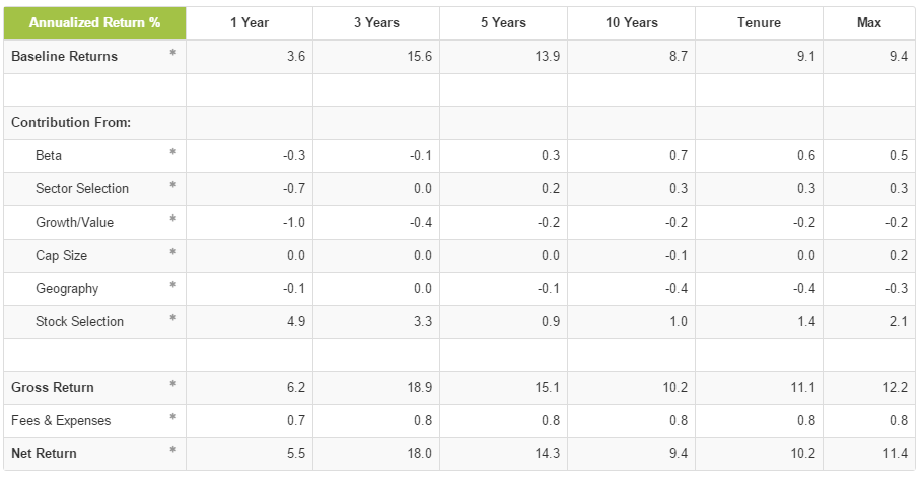
Exhibit I compares VVPLX to Boston Partners All-Cap Value Fund. BPAIX is on the cusp of value and blend, much like VVPLX. Our model sees a 56.1% chance that the fund’s skill over the next 12 months will justify its expense structure. According to John Forelli, Senior Portfolio Analyst, the managers screen from a broader universe using their own value metrics. They combine this with in-depth fundamental analysis. As a result, they are overweight sectors like international, financials, and pharma relative to the Russell 3000 (their avowed benchmark.) Boston Partners separately manages approximately $10 billion of institutional accounts which closely tracks BPAIX.
Any reader with the www.fundattribution.com demo can pull up the Fund Analysis for VVPLX. The chart for BPAIX is not available on the demo (because it is categorized in Large Value) so we present it in Exhibit II. Exhibit III presents a more traditional attribution against the Russell 3000 Value Fund. Both exhibits suggest Boston Partners are great stock pickers. However, we attribute much less skill to Allocation because our “Baseline Return” construes they are not a dyed-in-the-wool value fund.
VVPLX has shown even more skill over the manager’s tenure than BPAIX and is expected to have more skill next year[1]. But even if VVPLX were open, we would prefer BPAIX due to a combination of cost and longer history. (BPAIX investors should keep an eye on expenses: the trustees recently reduced the fee waiver by 10bps and may move further next year.)
Trapezoid has identified funds which are more attractive than either of these funds. The Trapezoid Honor Roll consists of funds with at least 60% confidence. The methodology behind these findings is summarized at here.
[1] 12 months ending November 2016.
VETERAN BENEFITS
Our review of VVPLX raises a broader question. Investors often have to choose between a fund which posted stellar returns for a short period against another whose performance was merely above average over a longer period.
 For those of you who watched the World Series a few months ago, the NY Mets had a number of very young pitchers with fastballs close to 100 miles per hour. They also had some veteran pitchers like John Niese and the 42-year-old ageless wonder Bartolo Colon who couldn’t muster the same heat but had established their skill and consistency over a long period of time. We don’t know whether Bartolo Colon drank from the fountain of youth; he served a lengthy suspension a few years ago for using a banned substance. But his statistics in his 40s are on par with his prime ten year ago.
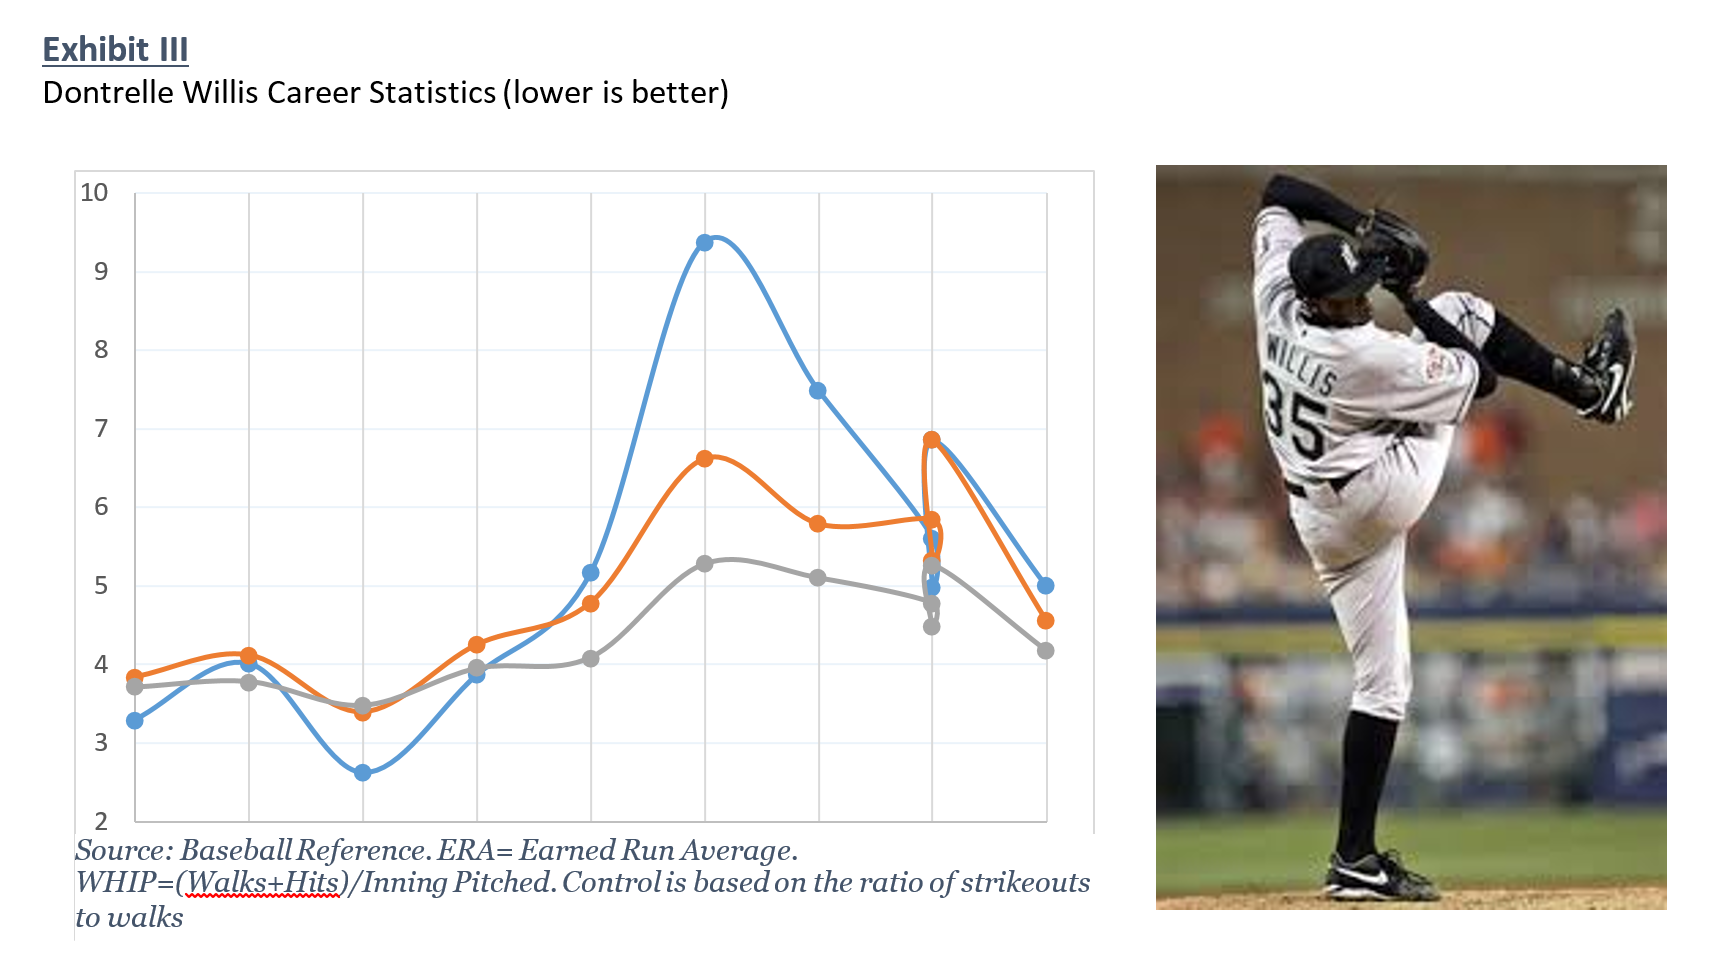
Unfortunately, for every Bartolo Colon, there is a Dontrelle Willis. Willis was 2003 NL Rookie of the year for the Florida Marlins and helped his team to a World Series victory. He was less effective his second year but by his third year was runner up for the Cy Young award. The “D-Train” spent 6 more years in the major leagues; although his career was relatively free of injuries, he never performed at the same level
Extrapolating from a few years of success can be challenging. If consistency is so important to investors, does it follow that a baseball team should choose the consistent veterans over the promising but less-tested young arms?
Sometimes there is a tradeoff between expected outcome (∆) and certitude (±). The crafty veteran capable of keeping your team in the game for five innings may not be best choice in the seventh game of the World Series; but he might be the judicious choice for a general manager trying to stretch his personnel budget. The same is true for investment managers. Vulcan may have the more skillful management team. But considering its longevity, consistency, and expense Boston Partners is the surer bet.
HOW MUCH IS ENOUGH
How long a track record is needed before an investor can bet confident in a portfolio manager? This is not an easy question to answer.
Skill, even when measured properly, is best evaluated over a long period.
In the December edition of MFO( When_Good_Managers_Go_Bad ) we profiled the Clearbridge Aggressive Growth fund which rode one thesis successfully for 20 years. Six years of data might tell us less about them than a very active fund.
Here is one stab at answering the question. We reviewed the database to see what percentage of fund made the Trapezoid Honor Roll as a function of manager tenure.
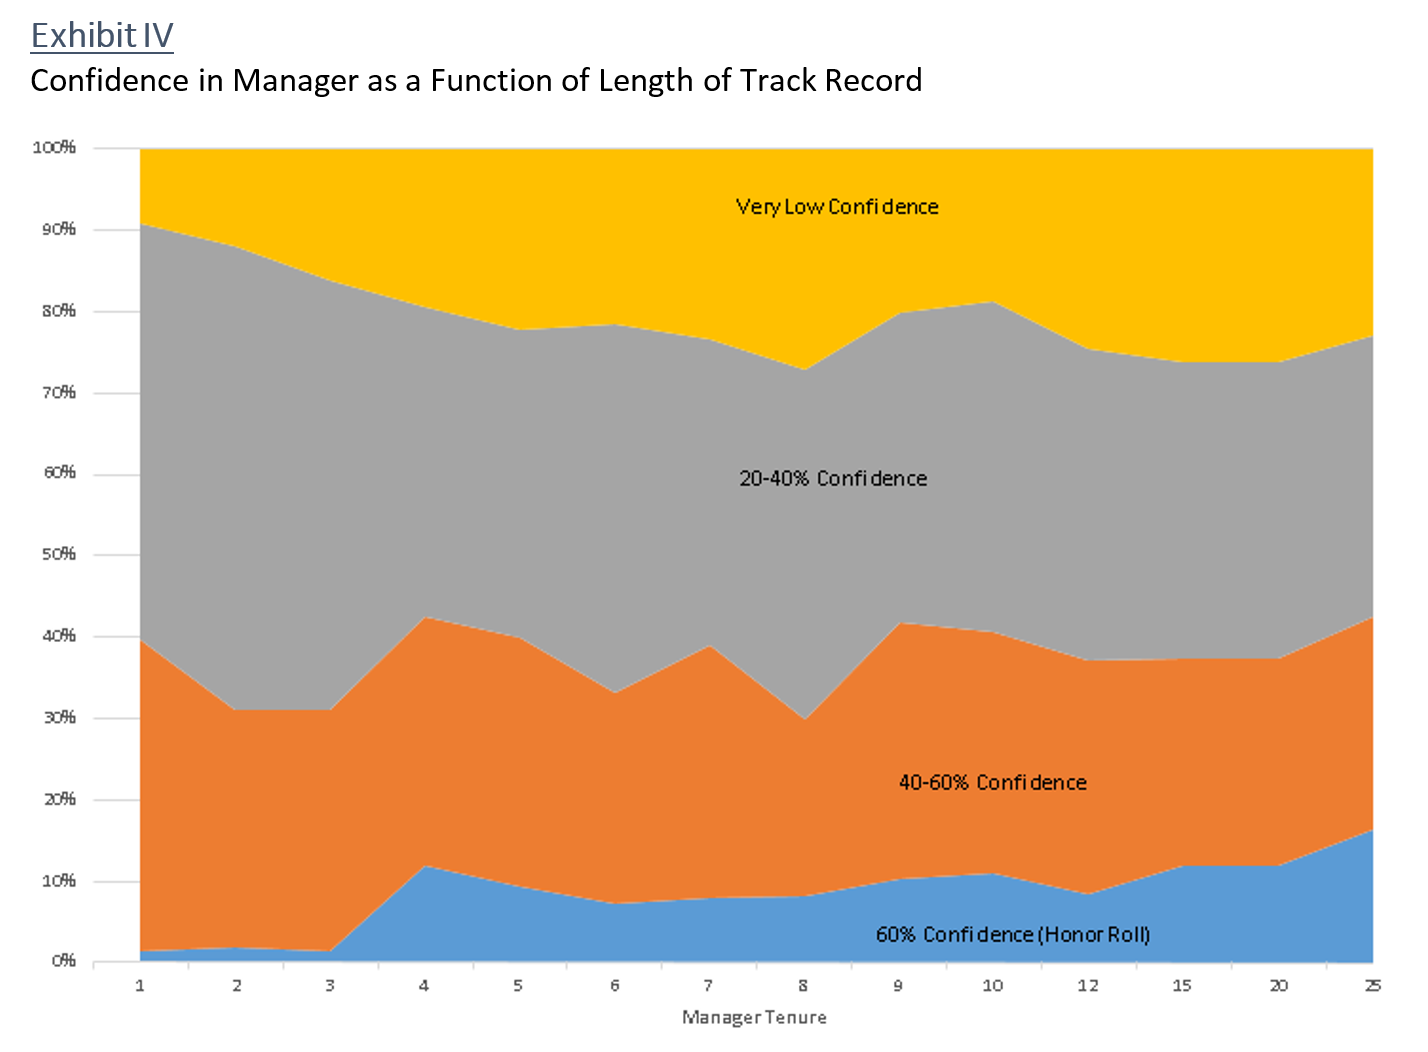 Recall the Trapezoid Honor Roll consists of fund classes for which we have 60% confidence that future skill will justify expense structure. In Exhibit IV the Honor Roll fund classes are shown in blue while the funds we want no part of are in yellow. 16% of those fund classes where the manager has been on the job for twenty-five years make the Honor Roll compared with just 2% for those on the job less than three years. The relationship is not a smooth line, but generally managers with more longevity give us more data points allowing us to be more confident of their skill.. or more likely persuade us they lack sufficient skill.
There is an element of “survivorship” bias in this analysis. Every year 6% of funds disappear; generally, they are the smallest or worst performers. “All-stars” managers are more likely to survive for 20 years. But surprisingly a lot of “bad” managers survive for a long time. The percentage of yellow funds increases just as quickly as the blue.
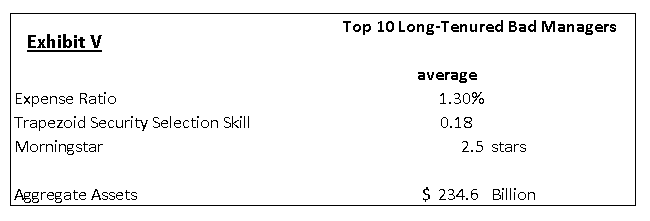 It seems reasonable to ask why so many “bad” managers survive in a Darwinian business. We surveyed the top 10. (Exhibit V) We find that in the aggregate they have a modicum of skill, but nowhere sufficient to justify what they charge. We can say with high confidence all these investors would be better off in index funds or (ideally) the active managers on the Trapezoid honor roll.
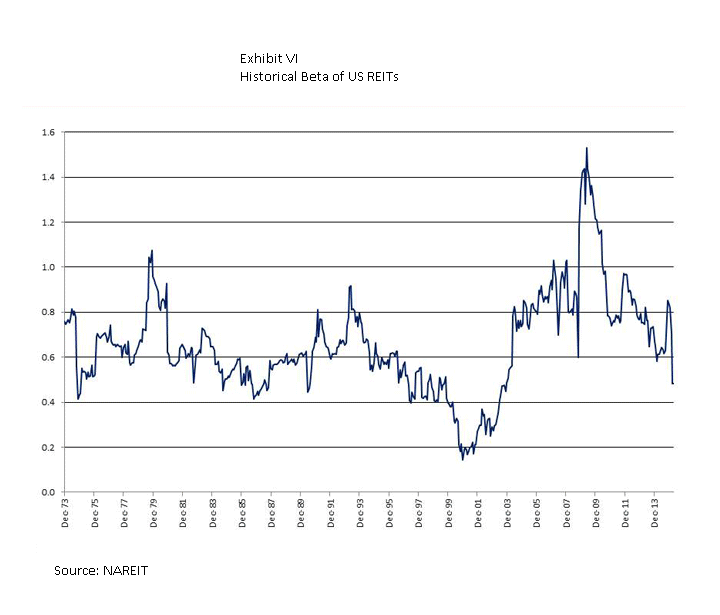
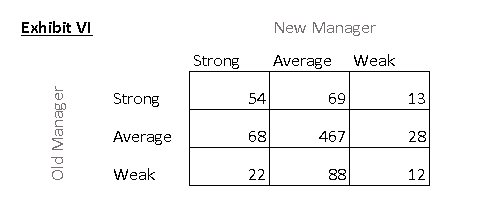 We haven’t distinguished between a new manager who takes over an old fund and a brand new fund. Should investors abandon all their confidence when a good manager retires and passes the baton? Should investors give the fund a mulligan when a poor performer is replaced? Probably not. From a review of 840 manager changes with sufficient data (Exhibit VI), strong performers tend to remain strong which suggests we may gain confidence by considering the track record of the previous manager.
The “rookie confidence” problem is a challenge for investors. The average manager tenure is about six years and only a quarter of portfolio managers have been on the job longer than 10 years. It is also a challenge for asset managers marketing a new fund or a new manager of an existing fund. Without a long track record, it is hard to tell if a fund is good – investors have every incentive to stick with the cheaper index fund. Asset managers incubate funds to give investors a track record but studies suggest investors shouldn’t take much comfort from incubated track records. (Richard Evans, CFA Digest, 2010.) We see many sponsors aggressively waiving fees for their younger funds. Investors will take comfort when the individuals have a prior track record at another successful fund. C.T. Fitzpatrick’s seventeen years’ experience under Mason Hawkins seems to have carried over to Vulcan.
BOTTOM LINE: It is hard to gain complete trust that any active fund is better than an index fund. It is harder when a new captain takes the helm, and harder yet for a brand new fund. The fund with the best five-year record is not necessarily the best choice. Veteran managers are over represented in the Trapezoid Honor Roll — for good reason.
Unlike investing, baseball will always have rookies taking jobs from the veterans. But in 2016 we can still root for Bartolo Colon.

 What’s the Trapezoid story? Leigh Walzer has over 25 years of experience in the investment management industry as a portfolio manager and investment analyst. He’s worked with and for some frighteningly good folks. He holds an A.B. in Statistics from Princeton University and an M.B.A. from Harvard University. Leigh is the CEO and founder of Trapezoid, LLC, as well as the creator of the Orthogonal Attribution Engine. The Orthogonal Attribution Engine isolates the skill delivered by fund managers in excess of what is available through investable passive alternatives and other indices. The system aspires to, and already shows encouraging signs of, a fair degree of predictive validity.
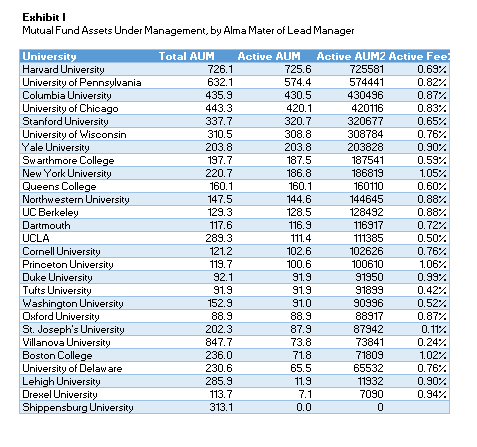 We concede to purists and academics that our study lacks rigor. The mutual fund database does not capture separate accounts, hedge funds, etc. We excluded many funds (comprising 25% of the AUM in our universe) where we lacked biographical data on the manager. Successful active funds rely on a team so it may be unfair to ascribe success to a single individual; in some cases we arbitrarily chose the first named manager. We used the institution associated with the manager’s MBA or highest degree. Some schools are represented by just 1 or 2 graduates. We combined funds from disparate sectors. Active and rules-based funds are sometimes strewn together. And we draw comparisons without testing for statistical validity.
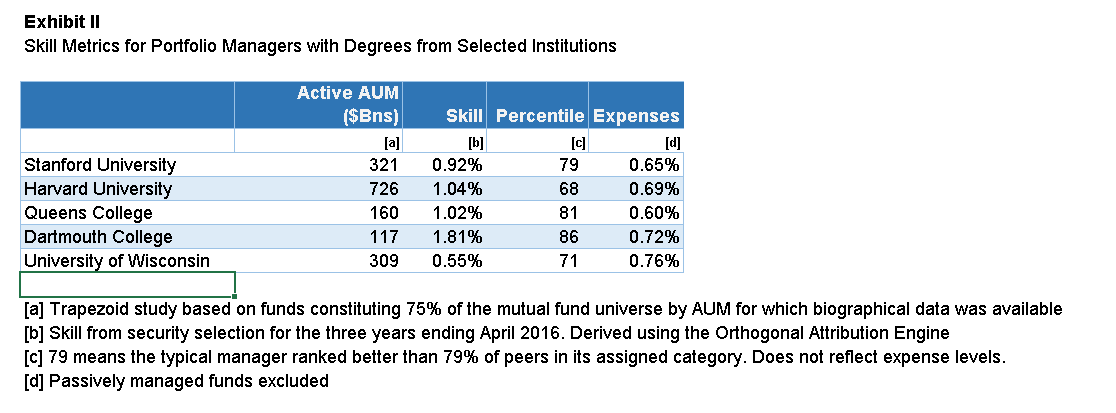

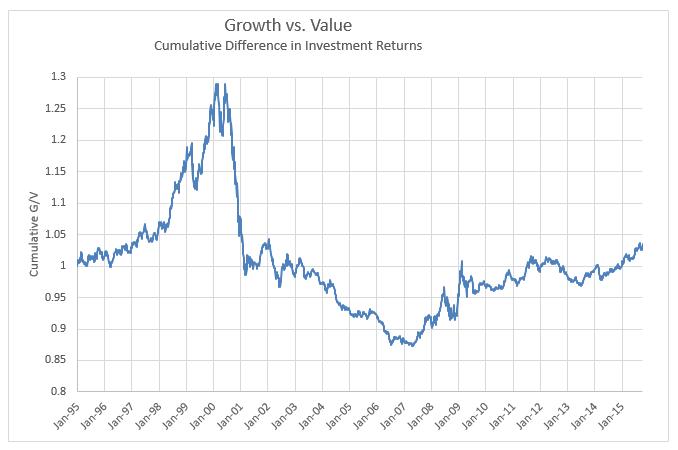
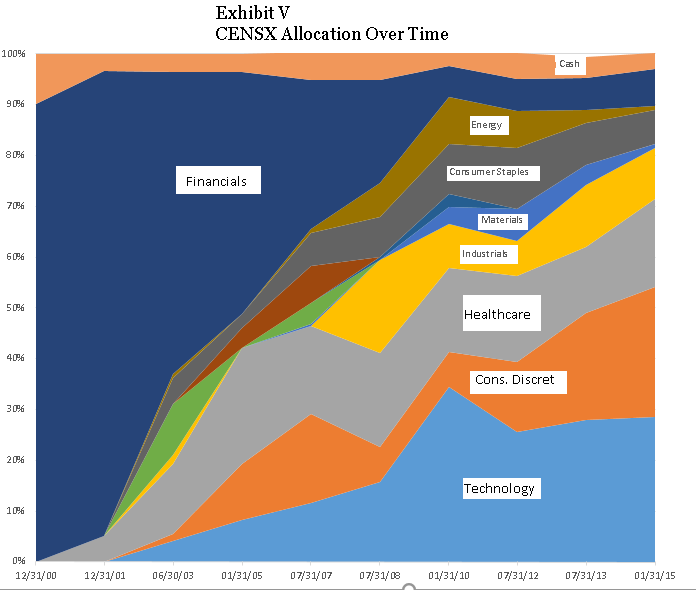 Does CENSX merit extra consideration because of the outstanding contribution from rotating between growth and value? Serendipity certainly plays a part. As Exhibit V illustrates, the current managers inherited in 1999 a fund which was restricted by its charter to financials, especially insurance. That weighting was very well-suited to the internet bust and recession which followed. They gradually repositioned the portfolio towards large growth. And he has made a number of astute switches. Notably, he emphasized consumer discretionary and exited energy which has worked extremely well over the past year. We spoke to portfolio manager Kevin Callahan. The fund is managed on a bottom-up fundamentals basis and does not have explicit sector targets. But he currently screens for stocks from the Russell 1000 Growth Index and seem reluctant to stray too far from its sector weightings, so we expect growth/value switching will be much more muted in the future.