Category Archives: Most intriguing new funds

LS Opportunity Fund (LSOFX), March 2016

By David Snowball

Objective and strategy

LS Opportunity Fund pursues three goals: preserving capital, delivering above-market returns and managing volatility. “The secret,” says manager John Gillespie, “is to avoid large losses.” They invest, both long and short, in individual stocks; they do not short “the market,” they don’t use esoteric options and they don’t typically use ETFs. They normally will have 20-40 short positions and 50-70 long ones. The long portfolio is both all-cap and value-oriented, both of which are fairly rare. The short portfolio targets firms with weak or deteriorating fundamentals and unattractive valuations. They use pair-traded investments to reduce volatility and sector risk.

Adviser

Long Short Advisors, which was founded in 2010 as a way of making the ICAP hedge fund strategy available to retail investors. ICAP sub-advised this fund from 2010 until May, 2015. Prospector Partners LLC became the sub-advisor at the end of May, 2015. Prospector employs nine investment professionals and manages about $600 million through private partnerships, three funds and a couple of separately-managed accounts.

Manager

John Gillespie, Kevin O’Brien and Jason Kish. Mr. Gillespie worked for T. Rowe Price from 1986 – 1997, beginning as an analyst then managing Growth Stock (PRGFX) from 1994-1996 and New Age Media (a closed-end fund that morphed into Media & Telecommunications (PRMTX) from 1994-1997, after which he left to found Prospector Partners. Mr. Kish joined Prospector in 1997. Mr. O’Brien joined Prospector in 2003; prior to that he was an analyst and co-manager for Neuberger Berman Genesis Fund (NBGNX) and White Mountain Advisors. The team co-manages the Prospector Partners funds.

Strategy capacity and closure

$2 billion. The strategy currently holds $300 million.

Management’s stake in the fund

The managers just assumed responsibility for the fund in May 2015, shortly before the date of the Statement of Additional Information. At that point, two of the three managers had been $100,000 – $500,000 invested in the fund. Collectively they have “significant personal investments” in the strategy, beyond those in the mutual fund.

Opening date

The fund launched in September 2010, but with a different sub-adviser and strategy. The Prospector Partners took over on May 28, 2015; as a practical matter, this became a new fund on that date. Prospector has been managing the underlying strategy since 1997.

Minimum investment

$5,000.

Expense ratio

1.95% after waivers on assets of $25 million, as of February 2016.

Comments

In May 2015, circumstances forced Long-Short Advisors (LSA) to hit the reset button on their only mutual fund. The fund had been managed since inception by Independence Capital Asset Partners (ICAP), side by side with ICAP QP Absolute Return L.P., ICAP’s hedge fund. Unexpectedly, Jim Hillary, ICAP’s founder decided to retire from asset management, shutter the firm and liquidate his hedge fund. That left LSA with a hard decision: close the fund that was an extension of Mr. Hillary’s vision or find a new team to manage it.

They chose the latter and seem to have chosen well.

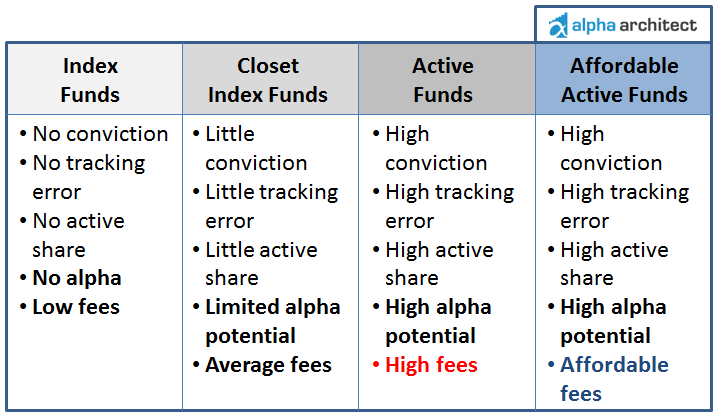
The phrase “long-short portfolio” covers a bunch of very diverse strategies. The purest form is this: find the most attractive stocks and reward them by buying them, then find the least attractive and punish them by shorting them. The hope is that, if the market falls, the attractive stocks will fall by a lot less than the whole market while the rotten ones fall by a lot more. If that happens, you might make more money on your short positions than you lose on your long ones and the portfolio prospers. Many funds labeled as “long-short” by Morningstar do not follow that script: some use ETFs to invest in or short entire market segments, some use futures contracts to achieve their short position, many hedge using buy-write options while some are simply misplaced “liquid alternatives” funds that get labeled “long short” for the lack of a better option. Here’s the takeaway: few funds in the “long-short” category actually invest, long and short, in individual stocks. By LSA’s estimation, there are about 30.

The argument for a long-short fund is simple. Most investors who want to reduce their portfolio’s volatility add bonds, in hopes that they’re lightly correlated to stocks and less volatile than them. The simplest manifestation of that strategy is a 60/40 balanced funds; 60% large cap stocks, 40% investment grade bonds. Such strategies are simple, cheap and have paid off historically.

Why complicate matters by introducing shorting? Research provided by Long Short Advisors and others makes two important points:

  • The bond market is a potential nightmare. Over the past 30 years, steadily falling interest rates have made bonds look like a risk-free option. They are not. Domestic interest rates have bottomed near zero; rising rates drive bond prices down. Structural changes in the bond markets, the side effect of well-intentioned government reforms, have made the bond market more fragile, less liquid and more subject to disruption than it’s been in any point in living memory. In early 2016, both GMO and Vanguard projected that the real returns from investment-grade bonds over the next five to ten years will be somewhere between zero and negative 1.5% annually.
  • Even assuming “normal” markets, long-short strategies are a better option than 60/40 ones. Between 1998 and 2014, an index of long/short equity hedge funds has outperformed a simple 60/40 allocation with no material change in risk.

In short, a skilled long-short manager can offer more upside and less downside than either a pure stock portfolio or a stock/bond hybrid one.

The argument for LS Opportunity is simpler. Most long/short managers have limited experience either with shorting stocks or with mutual funds as an investment vehicle. More and more long/short funds are entering the market with managers whose ability is undocumented and whose prospects are speculative. Given the complexity and cost of the strategy, I’d avoid managers-with-training-wheels.

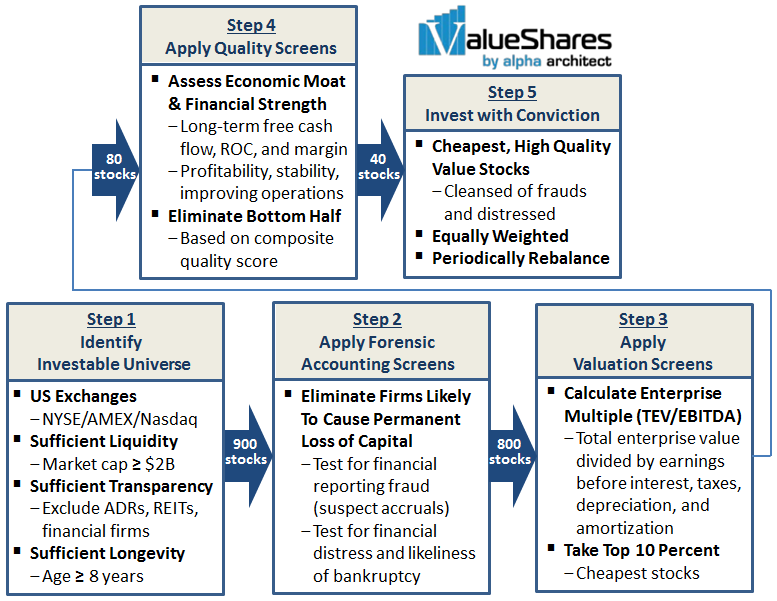
Prospector Partners, in contrast, has a long and excellent record of long-short investing. The firm was founded in 1997 by professionals who had first-rate experience as mutual fund managers. They have a clear, clearly-articulated investment discipline; they work from the bottom up, starting with measures of free cash flow yield. FCF is like earnings, in that it measures a firm’s economic health. It is unlike earnings in that it’s hard to rig; that is, the “earnings” that go into a stock’s P/E ratio are subject to an awful lot of gaming by management while the simpler free cash flow remains much cleaner. So, start with healthy firms, assess the health of their industries, look for evidence of management that uses capital wisely, then create a relatively concentrated portfolio of 50-70 stocks with the majority of the assets typically in the top 20 names. The fact that they’ve been developing deeper understanding of specific industries for 20 years while many competitors sort of fly-by using quant screens and quick trades, allows Prospector “to capitalize on informational vacuums in Insurance, Consumer, Utilities, and Banks.” They seem to have particular strength in property and casualty insurance, an arena “that’s consistently seen disruption and opportunity over time.”

The short portfolio is a smaller number of weak companies in crumbling industries. The fact that the management team is stable, risk-conscious and deeply invested in the strategy, helps strengthen the argument for their ability to repeat their accomplishments.

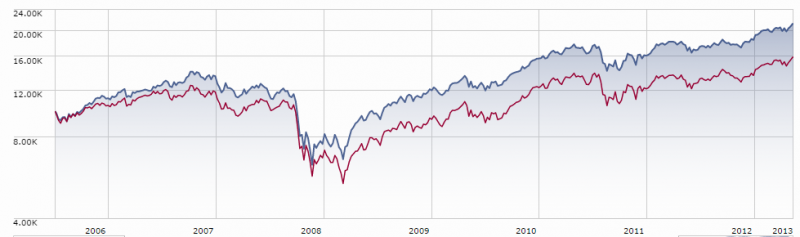
The LSOFX portfolio is built to parallel Prospector Partners’ hedge fund, whose historical returns are treated as prior related performance and disclosed in the prospectus of LSOFX. Here are the highlights:

  • From inception through mid-2015, a $1,000 investment in the Partner’s strategy grew to $5000 while an investing in the S&P 500 would have grown to $3000 and in the average long-short hedge fund (HFRI Equity Hedge), to $4000.
  • During the dot-com crash from 2000-02, their hedge fund made money each year while the S&P 500 lost 9, 12, and 22%. That reflects, in part, the managers’ preference for a value-oriented investment style during a period when anything linked with tech got eviscerated.
  • During the market panic from 2007-09, the S&P 500 fell by 3% or more in nine (of 18) months. The fund outperformed the market in every one of those months, by an average of 476 basis points per month.

Since taking responsibility for LSOFX, the managers have provided solid performance and consistent protection. The market has been flat or down in six of the eight months since the changeover. LSOFX has outperformed the market in five of those six months. And it has handily outperformed both the S&P 500 and its nominal long-short peers. From June 1, 2015 to the middle of February 2016, LSOFX lost 2.1% in value while the S&P 500 dropped 7.4% and the average long-short fund lost 9.0%.

Bottom Line

Even the best long-short funds aren’t magic. They don’t pretend to be market-neutral, so they’ll often decline as the stock market does. And they’re not designed to keep up with a rampaging bull, so they’ll lag when long-only investors are pocketing 20 or 30% a year. And that’s okay. At their best, these are funds designed to mute the market’s gyrations, making them bearable for you. That, in turn, allows you to become a better, more committed long-term investor. The evidence available to us suggests that LSA has found a good partner for you: value-oriented, time-tested, and consistently successful. As you imagine a post-60/40 world, this is a group you should learn more about.

Fund website

Long Short Advisors. The site remains pretty Spartan. Happily, the advisor is quite approachable so it’s easy to get information to help complete your due diligence.

© Mutual Fund Observer, 2016. All rights reserved. The information here reflects publicly available information current at the time of publication. For reprint/e-rights contact us.

RiverNorth Opportunities Fund, Inc. (RIV), February 2016

By David Snowball

Objective and strategy

The Fund’s investment objective is total return consisting of capital appreciation and current income. Like the open-end RiverNorth Core Opportunity Fund (RNCOX), this fund invests opportunistically in a changing mix of closed-end funds including business development companies and ETFs. In the normal course of events, at least 65% of the fund’s assets will be in CEFs.  RiverNorth will implement an opportunistic strategy designed to capitalize on the inefficiencies in the CEF space while simultaneously providing diversified exposure to several asset classes. The prospectus articulates a long series of investment guidelines:

  • Up to 80% of the fund might be invested in equity funds
  • No more than 30% will be invested in global equity funds
  • No more than 15% will be in emerging markets equities
  • Up to 60% might be invested in fixed income funds
  • No more than 30% in high yield bonds or senior loans
  • No more than 15% in emerging market income
  • No more than 15% in real estate
  • No more than 15% in energy MLPs
  • No more than 10% in new CEFs
  • No investments in leveraged or inverse CEFs
  • Up to 30% of the portfolio can be short positions in ETFs, a strategy that will be used defensively.
  • Fund leverage is limited to 15% with look-through leverage (that is, factoring in leverage that might be use in the funds they invest in) limited to 33%.

Adviser

ALPS Advisors, Inc.

Sub-Adviser

RiverNorth Capital Management, LLC. RiverNorth is an investment managementfirm founded in 2000 that specializes in opportunistic strategies in niche markets where the potential to exploit inefficiencies is greatest. RiverNorth is the sub-adviser to RiverNorth Opportunities Fund, Inc. RiverNorth also advises three limited partnerships and the four RiverNorth Funds: RiverNorth Core Opportunity (RNCOX), RiverNorth/Oaktree High Income (RNOTX), Equity Opportunity (RNEOX), RiverNorth/DoubleLine Strategic Income (RNDLX) and this one. As of December 31, 2015, they managed $3.3 billion.

Managers

Patrick Galley and Stephen O’Neill. Mr. Galley is RiverNorth’s Chief Investment Officer and President and Chairman of RiverNorth Funds. He also manages all or parts of seven strategies with Mr. O’Neill. Before joining RiverNorth in 2004, he was a Vice President at Bank of America in the Global Investment Bank’s Portfolio Management group. Mr. O’Neill co-manages the firm’s closed-end fund strategies and helps to oversee the closed-end fund investment team. Prior to joining RiverNorth in 2007, he was an Assistant Vice President at Bank of America in the Global Investment Bank’s Portfolio Management group.

Strategy capacity and closure

The Fund is a fixed pool of assets now that the IPO is complete, which means there are no issues with capacity going forward.

Management’s stake in the fund

Messrs. Galley and O’Neill each have between $100,000 – 500,000 in the fund. Three of the four independent trustees have relatively modest ($10,000-100,000) investments in the open-end version of the fund while one has no investments with RiverNorth. RiverNorth, “its affiliates and employees anticipate beneficially owning, as a group, approximately $10 million in shares of the Fund.” Mr. Galley also owns more than 25% of RiverNorth Holding Company, the adviser’s parent company.

Opening date

December 23, 2015

Minimum investment

Like stocks and ETFs, there is no minimum purchase established by the fund though you will need to pay a brokerage fee.

Expense ratio

Total annual expense ratio as a percentage of net assets attributable to common shares as of July 31, 2022, is 1.58% (excluding dividend expense and line of credit expense). Including dividend expense and line of credit expense, the expense ratio is 1.91%. 

The total net assets are $262.1 million and the total managed assets are $359.9 million, according to the Q2 2023 fact sheet. 

Comments

The pricing of closed-end fund shares is famously irrational. Like a “normal” mutual fund, closed-end funds calculate daily net asset values by taking the value of all of the securities they own – an unambiguous figure based on the publicly-quoted prices for stocks – and divide it by the number of shares they’ve issued, another unambiguous figure. At the end of each day, a fund can say, with considerable confidence, “one share of our fund is worth $10.”

So, why can you buy that share for $9.60? Or $9.00 or $8.37? Or, as in the case of Boulder Growth & Income (BIF), $7.56?

The short answer is: people are nuts. CEFs trade like stocks throughout the day and, at any given moment, one share is worth precisely what you convince somebody to pay for that one share. When investors get panicked, people want to dump their shares. If they’re sufficiently panicked they’ll sell at a loss, accepting dimes on the dollar just to be free again. To be clear: during a panic, you can often buy $10 worth of securities for $8. If you simply hold those shares until the panic subsidies, you might reasonably expect to sell them for $9 or $9.50. Even if the market is falling, when the panic selling passes, the discounts contract and you might pocket market-neutral arbitrage gains of 10 or 20%.

It’s a fascinating game, but one which very few of us can successfully play. There are two reasons for that:

  1. You need to know a ridiculous lot about every potential CEF investment: not just current discount but its typical discount, its price movement history, its maximum discount but also the structural factors that might make its current discount continue or deepen.
  2. You need to know when to move and you need to be ready to: remember, these discounts are at their greatest during panics. Just as the market collapses and it appears the world really is ending this time, you need to reach for your checkbook. The discounts are evidence that normal investors do the exact opposite: the desire to escape leads us to sell for the sake of selling.

RiverNorth’s primary expertise is CEF investing; in particular, in investing opportunistically when things look their worst. That strategy is primarily manifested in RiverNorth Core Opportunity (RNCOX), an open-ended tactical allocation fund that uses this strategy. This long-awaited fund embodies the same strategy with a couple twists: it can make modest use of leverage and it’s more devoted to CEFs than is RNCOX. RIV will have at least 65% in CEFs while RNCOX might average 50-70%.

And, too, RIV itself can sell at a discount. A sophisticated investor might monitor the fund and find herself able to buy RIV at a 10% discount at the very moment that RIV is buying other funds at a 20% discount. That would translate to the opportunity to buy $10 worth of stock for $7.20.

Investing in RIV carries clearly demonstrable risks:

  1. It costs a lot. The fund invests in, and passes costs through from, an expensive asset class. The aforementioned Boulder Growth & Income fund charges 1.83%, if RiverNorth buys it, that expense gets passed through to its shareholders as a normal cost of the strategy. The adviser estimates that the fund’s current expenses, assuming they’re using the leverage available to them and including the acquired fund fees and expenses, is 3.72%.
  2. It’s apt to be extremely volatile at times. Put bluntly, the strategy here is to catch falling knives. Ideally you catch them when they don’t have much farther to fall but there’s no guarantee of that.
  3. Its Morningstar rating will periodically suck. If CEF discounts widen after the fund acquires shares, those widened discounts reduce RiverNorth’s return and increase its volatility. Persistently high discounts will make for persistently low Morningstar ratings, which is what we see with RNCOX right now.

That said, this fund is apt to deliver on its promises. The CEF structure, which frees the managers from needing to worry about redemptions or hot money flows, seems well-suited for the mission.

Bottom Line

CEF discounts are now the greatest they’ve been since the depth of the 2008 market meltdown. By RiverNorth’s calculation, discounts are greater now than they’ve been 99% of the time. If panic subsidies, that will provide a substantial tailwind to boost returns for RiverNorth’s shareholders. If the panic persists just long enough for investors to buy RIV at a discount, as the managers are apt to, then the potential gains are multiplied. Investors interested in a more-complete picture of the strategy might want to read our November 2015 profile of RiverNorth Core Opportunity.

Fund website

RiverNorth Opportunities Fund

Fact Sheet

© Mutual Fund Observer, 2016. All rights reserved. The information here reflects publicly available information current at the time of publication. For reprint/e-rights contact us.

AQR Style Premia Alternative I (QSPIX), AQR Style Premia Alternative LV I (QSLIX), September 2015

By Samuel Lee

Objective and strategy

AQR’s Style Premia Alternative, or SPA, strategy offers leveraged, market-neutral exposure to the four major investing “styles” AQR has identified:

Value, the tendency for fundamentally cheap assets to beat expensive assets.

Momentum, the tendency for relative performance in assets to persist over the short run (about one to twelve months).

Carry, the tendency for high-yield assets to beat low-yield assets.

Defensive, the tendency for low-volatility assets to offer higher volatility-adjusted returns than high-volatility assets.

To make the cut as a bona fide style, a strategy has to be persistent, pervasive, dynamic, liquid, transparent and systematic.

SPA offers pure exposure to these styles across virtually all major markets, including stocks, bonds, currencies, and commodities. It removes big, intentional directional bets by going long and short and hedging residual market exposure. As with all alternative investments, the goal is to create returns uncorrelated with conventional portfolio returns.

SPA sizes its positions by volatility, not nominal dollars. In quant-speak, risk is often used as short-hand for volatility, a convention I will adopt. Of course, volatility is not risk (though they are awfully correlated in many situations).

SPA’s strategic risk allocations to each style are as follows: 34% each to value and momentum, 18% to defensive, and 14% to carry. Its strategic risk allocations to each asset class are as follows: 30% to global stock selection, 20% each to equity markets and fixed income, and 15% each to currencies and commodities. There is a bias to the value and momentum styles, perhaps reflecting AQR’s greater confidence in and longer history with them.

Risk allocations drift based on momentum and “style agreement,” where high-conviction positions are leveraged up relative to low-conviction positions. The strategy’s overall risk target falls in steps in the event of a drawdown and rises as losses are recouped. These overlays embody some of the hard-knock knowledge speculators have acquired over the decades: bet on your best ideas, cut losers and ride winners, and cut capital at risk when one is trading poorly.

SPA targets a Sharpe ratio of 0.7 over a market cycle. AQR offers two flavors to the public: the 10% volatility-targeted QSPIX and the 5%-vol QSLIX.

Adviser

AQR Capital Management, LLC, was founded in 1998 by a team of ex-Goldman Sachs quant investors led by Clifford S. Asness, David G. Kabiller, Robert J. Krail, and John M. Liew. AQR stands for Applied Quantitative Research. The firm’s bread and butter has long been trading value and momentum together, an idea Asness studied in his PhD dissertation at the University of Chicago. (Asness’s PhD advisor was none other than Eugene Fama, father of modern finance and one of the co-formulators of the efficient market hypothesis.)

When the firm started up, it was hot. It had one of the biggest launches of any hedge-fund up to that point. Then the dot-com bubble inflated. The widening gap in valuations between value and growth stocks almost sunk AQR. According to Asness, the firm was six months away from going out of business. When the bubble burst, the firm’s returns soared and so did its assets. The good times rolled until the financial crisis shredded its returns. Firm-wide assets from peak-to-trough went from $39.1 billion to $17.2 billion. The good times are back: As of June-end, AQR has $136.2 billion under management.

The two near-death experiences have instilled in AQR a fear of concentrated business risks. In 2009, AQR began to diversify away from its flighty institutional clientele by launching mutual funds to entice stickier retail investors. The firm has also launched new strategies at a steady clip, including managed futures, risk parity, and global macro.

AQR has a strong academic bent. Its leadership is sprinkled with economics and finance PhDs from top universities, particularly the University of Chicago. The firm has poached academics with strong publishing records, including Andrea Frazzini, Lasse Pedersen, and Tobias Moskowitz. Its researchers and leaders are still active in publishing papers.

The firm’s principals are critical of hedge funds that charge high fees on strategies that are largely replicable. AQR’s business model is to offer up simplified quant versions of these strategies and charge relatively low fees.

Managers

Andrea Frazzini, Jacques A. Friedman, Ronen Israel, and Michael Katz. Frazzini was a finance professor at University of Chicago and rising star before he joined AQR. He is now a principal on AQR’s Global Stock Selection team. Friedman is head of the Global Stock Selection team and worked at Goldman Sachs with the original founders prior to joining AQR. Israel is head of Global Alternative Premia and prior to AQR was a senior analyst at Quantitative Financial Strategies Inc. Katz leads AQR’s macro and fixed-income team.

Frazzini is the most recognizable, as he has the fortune of having a last name that’s first in alphabetical order and publishing several influential studies in top finance journals, including “Betting Against Beta” with his colleague Lasse Pedersen.

Unlisted is the intellectual godfather of SPA, Antti Ilmanen, a University of Chicago finance PhD who authored Expected Returns, an imposing but plainly-written tome that synthesizes the academic literature as it relates to money management. Though written years before SPA was conceived, Expected Returns can be read as an extended argument for an SPA-like strategy.

Strategy capacity and closure

AQR has a history of closing funds and ensuring its assets don’t overwhelm the capacity of its strategies. When the firm launched in 1998, it could have started with $2 billion but chose to manage only half that, according to founding partner David Kabiller.

Of its mutual funds, AQR has already closed its Multi-Strategy Alternative, Diversified Arbitrage and Risk Parity mutual funds. However, AQR will meet additional demand by launching additional funds that are tweaked to have more capacity. As of the end of 2014, AQR reported a little over $3 billion in its SPA composite return record. Given the strategy’s strong recent returns, assets have almost certainly grown through capital appreciation and inflows.

Because AQR uses many of the same models or signals in different formats and even in different strategies, the effective amount of capital dedicated to at least some components of SPA’s strategy is higher than the amount reported by AQR.

Management’s stake in the fund

As of Dec. 31, 2014, the strategy’s managers had no assets in the low-volatility SPA fund and little in the standard-volatility SPA fund. One trustee had less than $50,000 in QSPIX. Collectively, the managers had $170,004 to $700,000 in the SPA mutual funds.

Although these are piddling amounts compared to the millions the managers make every year, the SPA strategy is tax-inefficient. If the managers wanted significant exposure to the strategies, they would probably do so through the partnerships AQR offers to high-net-worth investors. But would they do that? AQR, like most quant shops, attempts to scarf down as much as possible the “free lunch” of diversification. The managers are well aware that their human capital is tied to AQR’s success and so they would probably not want to concentrate too heavily in its potent leveraged strategies.

Opening date

QSPIX opened on October 30, 2013. QSLIX opened on September 17, 2014. The live performance composite began on September 1, 2012.

Minimum investment

The minimum investment varies depending share class, broker-dealer and channel. For individual investors, a Fidelity IRA offers the lowest hurdle: a mere $2,500 for the I share class of the normal and low-volatility flavors of SPA. Or you can get access through an advisor. Otherwise, the hurdles are steep: $5 million for the I class, $1 million for the N class, and $50 million for the R6 class.

Expense ratio

The I shares cost 1.66%, the N shares cost 1.91%, and the R6 shares cost 1.56%, as of June 2023.

AUM is $825 million, as of June 2023.  

The per-unit price of exposure to SPA is lower the higher the volatility of the strategy. QSPIX targets 10% vol and costs 1.5%. QSLIX targets 5% vol and costs 0.85%. Anyone can replicate a position in QSLIX by simply halving the amount invested in QSPIX and putting the rest in cash. The effective expense ratio of a half QSPIX, half cash clone strategy is 0.75%.

Comments

QSLIX has been liquidated (June 2023). 

Among right-thinking passive investors who count fees by the basis point, AQR’s SPA strategy elicits revulsion. It’s expensive, leveraged, complicated, hard to understand, and did I mention expensive?

To make the strategy easier to swallow, some passive-investing advocates argue SPA is “passive” because it’s a transparent, systematic, and involves no discretionary stock-selection or market forecasting. This definition is not universally accepted by academics, or even by AQR. The purer, technical definition of passive investing is a strategy that replicates market weightings, and indeed this definition is used by the venerable William Sharpe in his famous essay, “The Arithmetic of Active Management.”

I do not think SPA is passive in any widely understood sense of the word. In fact, I think it’s about as active as you can get within a mutual fund. And I also happen to think SPA is a great fund. Regardless of my warm feelings for the strategy, I consider SPA suitable only for a rare kind of nerd, not the investing public.

Though SPA is aggressively active, its intellectual roots dig deep into the foundations of financial theory that underpin what are commonly thought to be “passive” strategies, particularly value- and size-tilted stock portfolios (DFA has made a big business selling them).

The nerds among you will have quickly caught on that what AQR calls a style is nothing more than a factor, a decades-old idea that sprung from academic finance.

For the non-nerds: A factor, loosely speaking, is a fundamental building block that explains asset returns. Most stocks move together, as if their crescendos and diminuendos were orchestrated by the hand of some invisible conductor. This co-movement is attributed to the equity market factor. According to factor theory, a factor generates a positive excess return called a premium as reward for the distinct risk it represents.

It is now widely agreed that two factors pervade virtually all markets: value and momentum (size has long been criticized as weak). AQR’s researchers—including some of the leading lights in finance—argue there are two more: carry and defensive. They’ve marshalled data and theoretical arguments that share an uncanny family resemblance with the data and arguments marshalled to justify the size and value factors.

The SPA strategy is a potent distillation of the factor-theoretical approach to investing. If you believe the methods that produced the research demonstrating the value and size effects are sound, then you have to admit that those same tools applied to different data sets may yield more factors that can be harvested.

OK, I’ve blasted you with theory. On to more practical matters.

Who should invest in this fund?

Investors who believe active management can produce market-beating results and are willing to run some unusual but controllable risks.

How much capital should one dedicate to it?

Depends on how much you trust the strategy, the managers, and so on. I personally would invest up to 30% of my personal money in the fund (and may do so soon!), but that’s only because I have a high taste for unconventionality, decades of earnings ahead of me, high conviction in the strategy and people, and a pessimistic view of competing options (other alternatives as well as conventional stocks and bonds). Swedroe, on the other hand, says he has 3% of his portfolio in it.

How should it be assessed?

At a minimum, an alternative has to produce positive excess returns that are uncorrelated to the returns of conventional portfolios to be worthwhile.

However, AQR is making a rather bold claim: It has identified four distinct strategies that produce decent returns on a standalone basis and are both largely uncorrelated with each other and conventional portfolios. When combined and leveraged, the resulting portfolio is expected to produce a much steadier stream of positive returns, also uncorrelated with conventional portfolios.

So far, the strategy is working as advertised. Returns have been good and uncorrelated. In back-tests, the strategy only really suffered during the dot-com bubble and the financial crisis. Even then, returns weren’t horrendous.

Is AQR’s 0.7 Sharpe ratio target reasonable?

I think so, but I would be ecstatic with 0.5.

What are its major risks?

Aside from leverage, counterparty, operational, credit, etc., I worry about a repeat of the quant meltdown of August 2007. It’s thought that a long-short hedge fund suddenly liquidated its positions then. Because many hedge funds dynamically adjust their positions based on recent volatility and returns, the sudden price movements induced by the liquidation set off a self-reinforcing cycle where more and more hedge funds cut the same positions. The stampede to the exits resulted in huge and sudden losses. However, the terror was short-lived. The funds that sold out lost a lot of money; the funds that held onto their positions looked fine by month-end.

AQR is cognizant of this risk and so keeps its holdings liquid and doesn’t go overboard with the leverage. However, it is hard for outsiders to assess whether AQR is doing enough to mitigate this risk. I think they are, because I trust AQR’s people, but I’m well aware that I could be wrong.

Bottom line

One of the best alternative funds available to mutual-fund investors.

Fund website

AQR Style Premia Alternative Fund 

aqrfunds.com

aqr.com

© Mutual Fund Observer, 2015. All rights reserved. The information here reflects publicly available information current at the time of publication. For reprint/e-rights contact us.

Eventide Healthcare & Life Sciences Fund (ETNHX), August 2015

By David Snowball

Objective and strategy

The Eventide Healthcare & Life Sciences Fund seeks to provide long-term capital appreciation. The manager selects equity and equity-related securities of firms in the healthcare and life sciences sectors. The manager’s valuation standards aren’t spelled out, except to say that he’s looking for “attractively valued securities.” The advisor imposes a set of ESG screens so that it limits itself to firms that “operate with integrity and create value for customers, employees, and other stakeholders,” which includes its immediate community and the broader society. Some of the firms in which it invests, especially in the biotech sector, are “development stage companies,” which implies that their stock is illiquid and potentially very volatile. Up to 15% of the portfolio might be invested in such securities. At the same time, up to 10% can be invested in derivatives that help hedge the portfolio.

Adviser

Eventide Asset Management, LLC. Founded in 2008, Eventide is a Boston-based adviser that specializes in faith-based and socially responsible investing. They manage more than $2 billion in assets through their two (and soon to be three) mutual funds.

Manager

Finny Kuruvilla. Dr. Kuruvilla has been a busy bee. In addition to managing the Eventide funds, he’s a Principal with Clarus Ventures, a health care venture capital firm with $1.7 billion in assets. In that role, he sits on several corporate boards. He has earned an MD from Harvard Medical School, a PhD in Chemistry and Chemical Biology from Harvard, a master’s in Electrical Engineering and Computer Science from MIT, and a bachelor’s degree from Caltech in Chemistry. Somewhere in there he completed medical residencies at two major Boston hospitals and served as a research fellow at MIT. He completed his residency and fellowship at the Brigham & Women’s Hospital and Children’s Hospital Boston where he cared for adult and pediatric patients suffering from a variety of hematologic, oncologic, and autoimmune disorders. Subsequently, he was a research fellow at MIT where he did incredibly complicated statistical stuff. He’s coauthored 15 peer-reviewed articles in science journals and also manages Eventide Gilead Fund.

Strategy capacity and closure

“Strategy capacity” refers to the amount of money that a manager believes he or she can handle without compromising the strategy’s prospects. Sometimes the limitation is imposed by the nature of the strategy (microcap strategies can handle less money than megacap ones) and sometimes by the limits of the investment team’s time and attention. In general, managers who can articulate the limits of their strategy and have thought through how they’ll handle excess inflows do better in the long run than those you make it up as they go. The Eventide managers report that “Eventide has not discussed closing the fund and is not expecting capacity issues until the fund gets to about $2 billion in AUM.”

Active share

Unknown.  “Active share” measures the degree to which a fund’s portfolio differs from the holdings of its benchmark portfolio. High active share indicates management which is providing a portfolio that is substantially different from, and independent of, the index. An active share of zero indicates perfect overlap with the index, 100 indicates perfect independence.  The fund’s active share hasn’t been calculated, though its low correlation with its benchmark suggests a fairly active approach.

Management’s stake in the fund

Dr. Kuruvilla has invested under $100,000 in this fund and between $100,001-$500,000 across his two funds. None of the fund’s independent trustees have any investment in the Eventide funds. As of October 1, 2014, the officers and Trustees collectively owned less than 1% of the fund shares; that translates to less than $200,000.

Opening date

December 27, 2012

Minimum investment

$1,000 for a regular account, $1,000 for an IRA account, or $100 for an automatic investment plan account.

Expense ratio

For class A shares: 1.56%, class C shares: 2.31%, class I shares: 1.31%, and class N shares: 1.51% on assets of $1.8 Billion, as of July 2023. There is a 1% redemption fee for shares held fewer than 180 days.

Comments

The argument for Eventide Healthcare is pretty straightforward: it’s the hottest fund in the hottest sector of the U.S. economy and it’s led by a manager with an unparalleled breadth of training and experience.

The Wall Street Journal’s mid-year report on the mutual funds with the best 10-year performance offered the following list of specialties:

  1. Biotech
  2. Biotech
  3. Health sciences
  4. Pharmaceuticals
  5. Biotech
  6. Biotech
  7. Biotech
  8. Health sciences
  9. Biotech
  10. 2x leveraged NASDAQ

Those funds earned an average of 19% per year. At the same time, the Total Stock Market Index clocked in at 8% per year.

And so far in its short life, Eventide Healthcare is among the field’s strongest performers. It has, since inception, handily beaten both the field and the field’s two most-respected funds, Vanguard Health Care (VGHCX, the only fund endorsed by Morningstar analysts) and T. Rowe Price Health Sciences (PRHSX).  Here are the returns on a hypothetical $10,000 investment made on the day Eventide launched in December 2012:

Eventide HealthCare 26,990
T. Rowe Price Health Sciences 24,750
Health care peer group 22,750
Vanguard Health Care 21,440

In 2015, through the end of July, Eventide has returned 28.6% – 9% better than the average healthcare fund and 25% above the broad stock market. Despite those soaring returns, Mr. Kuruvilla concludes that the key biotech “sector is significantly less overvalued than the S&P 500 as a whole. While individual biotech companies may indeed be overvalued, we see no reason to believe that overvaluation is endemic in the sector.”

Much of the credit belongs to its manager, Finny Kuruvilla. His academic accomplishments are formidable. As I note above, Dr. Kuruvilla has an MD and a PhD in chemical biology (both from Harvard) and a master’s degree in engineering and computer science (from MIT). His professional investing career includes both the Eventide fund and a venture capital fund. That second tier of experience is important, since VC funds tend both to be far more activist – that is, far more intimately involved in the development of their charges – than mutual funds and to focus on a distinct set of early stage firms whose prospects might explode. About 70% of the Eventide fund is invested in biotech stocks and 40% in microcaps; most of the remainder are small cap firms.

The other investor with a similar range of expertise was Kris Jenner, the now-departed manager of T. Rowe Price Health Sciences. Mr. Jenner managed to leverage his deep academic and professional knowledge of the growing edge of the healthcare universe – biotech firms, among others – into the third best 10-year record among the 7000 funds that Morningstar tracks.

That said, prospective investors need to attend to four red flags:

  1. The manager has two masters. Mr. Kuruvilla is a principal at Clarus Ventures, a healthcare venture capital firm with $1.7 billion in assets. He’s managed investments for both firms since 2008. That might raise two concerns. The first is whether he’s able to juggle both sets of obligations, especially as assets grow. The second is how he handles potential conflicts of interest between his two charges. If, for example, he discovers a fascinating illiquid security, he might need to choose whether to invest for the benefit of his Clarus shareholders or his Eventide ones.

    Eventide’s conflict-of-interest policy addresses his role at Clarus, but mostly concerning how he will deal with non-public information and trading in his personal accouts, not how he would deal with potential conflicts between the needs of the two funds.

  2. Asset growth might impair the strategy. The fund is attracting steadily inflows. It has grown from $40 million at the end of 2013 to $150 million at the end of 2014 to $300 million at the start of July, 2015. By the end of July, they’d reached $350 million. For a fund whose success is driven by its ability to find and fund firms in “the smallcap biotech space,” 40% of which are microcaps and some of whom are privately traded and illiquid, sustained asset growth is a real concern. Sadly that growth has not yet translated into low expenses; it is the third most-expensive of the 31 health care funds.

  3. The question of volatility needs to be addressed. Despite its ability to hedge volatility, the fund declined by almost 20% in the late spring and early summer, 2014. Its peers dropped 7.4% in the same period. Since inception, its downside deviation and Ulcer Index, a measure that combines the magnitude and duration of a drawdown, are two to three times higher than its peers.

    The managers are aware of the issue, but consider it to be part of the price of admission. David Barksdale, co-portfolio manager on the Gilead fund and managing partner of Eventide, writes:  

    A draw-down like that in early 2014 for the Healthcare fund should be considered normal for the fund. There was a pullback in biotech stocks at that time and these are a regular feature of the industry. Although individual biotech companies tend to be uncorrelated on their fundamentals, investors tend to trade their stocks as a group via ETF’s or otherwise and investor sentiment changes can precipitate these kinds of draw-downs.

    He reports that “we generally see these drawdowns at least once a year.” The ability to exploit the market’s excessive reactions are an essential part of generating outsized gains (“We tend to keep some cash on hand in the fund to be able to take advantage of these pullbacks as buying opportunities.”) but they may prove difficult for some investors to ride through.

  4. The quality of shareholder communications is surprisingly low. Communication between the manager and retail shareholders is limited to a three page letter, covering both funds, in the Annual Report. The semi-annual report contains no text and there are no shareholder letters. There are quarterly conference calls but those are limited to financial advisers; copies are password protected. The adviser does maintain a rich archive of the managers’ media appearances.

Bottom Line

Eventide Healthcare and Life Sciences has a fascinating pedigree and a outstanding early record. Mr. Kuruvilla has the breadth of experience at training – both academic and professional – to give him a distinct and sustained competitive advantage over his peers. That said, enough questions persist that investors need to approach the fund cautiously, if at all.

Fund website

Eventide Healthcare and Life Sciences

© Mutual Fund Observer, 2015. All rights reserved. The information here reflects publicly available information current at the time of publication. For reprint/e-rights contact us.

Vanguard Global Minimum Volatility Fund (VMVFX), April 2015

By David Snowball

Objective and strategy

The fund seeks to provide long-term capital appreciation with low volatility relative to the global equity market. The managers use quantitative models to “construct a global equity portfolio that seeks to achieve the lowest amount of expected volatility subject to a set of reasonable constraints designed to foster portfolio diversification and liquidity.” It’s broadly diversified, with 340 stocks across all capitalizations and industry groups, with about 50% outside the U.S. The fund generally hedges most of its currency exposure to further reduce overall portfolio volatility.

Adviser

The Vanguard Group, Inc. Vanguard was founded by Jack Bogle in 1975 as a sort of crazed evangelical investing hobby. It now controls between $2.2 trillion and $2.7 trillion in assets and advises 170 mutual funds. Struck by Vanguard’s quarter trillion dollars of inflows in 2014, Morningstar’s John Rekenthaler recently mused about “what will happen when Vanguard owns everything.”

Manager

James D. Troyer, James P. Stetler, and Michael R. Roach co-manage the fund. Mr. Troyer and Mr. Stetler are Principals at Vanguard and all three have been with the fund since launch. Messrs. Troyer, Stetler, and Roach also co-manage all or a portion of 14 funds with total assets of $121 billion.

Strategy capacity and closure

Unknown.

Active share

“Active share” measures the degree to which a fund’s portfolio differs from the holdings of its benchmark portfolio. High active share indicates management which is providing a portfolio that is substantially different from, and independent of, the index. An active share of zero indicates perfect overlap with the index, 100 indicates perfect independence. Vanguard does not, however, make active share calculations public.

Management’s stake in the fund

As of October 31, 2014, Mr. Troyer had invested between $500,001–$1,000,000 in the fund while Mr. Roach had a minimal investment and Mr. Stetler had none at all. None of Vanguard’s trustees, each of whom oversees 178 funds, has invested in this fund. Oddly, the fund’s largest investor is Vanguard Managed Payout Fund (VPGDX) which owns 52% of it. Overall, Vanguard employees have invested more than $4.7 billion in their funds.

Opening date

December 12, 2013.

Minimum investment

$3,000

Expense ratio

0.21% on Investor class shares, on assets of about $2 Billion, as of July 2023.

Comments

The case for owning a consciously low-volatility stock fund comes down to two observations:

  1. Most options for reducing portfolio volatility are complicated, expensive and ineffective.

    Investors loathe equity managers who hold cash (“I’m not paying you 1.0% a year to buy CDs,” they howl), which is why there are so few managers willing to take the risk: of 2260 US equity funds, well under 100 have 15% or more in cash as of April 2015. Bonds are priced for long-term disappointment, which reduces the appeal of traditional 60/40 portfolios. Folks are much more prone to invest in “liquid alts” despite the fact that most combine untested teams, untested strategies, high expenses (the “multi-alternative” group averages 1.7-1.8%) and low returns (over most trailing periods, the multi-alt group returns between 3-4%).

    While we’ve tried to identify the few most-promising options in these areas, there’s an argument that for many investors simply investing in the right types of stocks makes a lot of sense, which brings us to …

  2. Low volatility stock portfolios substantially raise returns and reduce risk.

    The evidence here is remarkable. You’re taught in financial class that high risk assets have higher returns than low risk assets, simply because no one in their right mind would invest in a high risk game without the prospect of commensurately high returns. While that’s true between asset classes (stocks tend to return more than bonds which tend to return more than cash), it’s not true within the stock class. There’s a mass of research that shows that low volatility stocks are a free lunch, worldwide.

    There are different ways to constructing such a portfolio. The folks at Research Associates tested four different techniques against a standard market cap weighted index and found the same results everywhere, pretty much regardless of how you chose to choose your portfolio. In the US market, low vol stocks returned 156 basis points higher (134-182, depending) than did the market. In a global sample, the returns were 56 basis points higher (8-143, depending) but the risk was 30% lower. And in the emerging markets, the returns gain was huge – 203 basis points (97-407, depending) – and the volatility reduction was stunning, about a 50% lower volatility was achievable. “In all cases,” they concluded, “the risk reduction is economically and statistically significant.”

    Researchers at Standard & Poor’s found that the effect holds across all sizes of stocks, as well. Oddly, the record for large and small cap low volatility stocks is far more consistently positive than for mid-caps. Got no explanation for that.

    If the reduction in volatility keeps investors from fleeing the stock market at exactly the wrong moment, then the actual gains to investor portfolios might well be greater than the raw returns suggest.

Why is there a low volatility anomaly? That is, why are less risky stocks more profitable? The best guess is that it’s because they’re boring. No one is excited by them, no one writes excitedly about Church & Dwight (the maker of Arm & Hammer baking soda, Orajel and … well, Trojan condoms) or The Clorox Company. As a result, the stocks aren’t subject to getting bid frantically up and crashing down.

The case for using Vanguard Global Minimum is similarly straightforward:

  1. It’s Vanguard.

    That brings three advantages: it’s going to be run at-cost (30 bps, less than one-quarter of what their peers charge). It’s going to be disciplined. They argue that the “minimum” volatility moniker signals a more sophisticated approach than the simple, more-common “low volatility” strategy. Low-vol, they argue, is simply a collection of the lowest volatility stocks in a screening process; minimum volatility approaches the problem of managing the entire portfolio by accounting for factors such as correlations between the stocks, sector weights and over-exposure to less obvious risk factors such as currency or interest rate fluctuations. And it’s not going to be subject to “Great Man” risk since it’s team-managed by Vanguard’s Quantitative Equity Group.

  2. It’s global and broadly diversified.

    The managers work with a universe of 50 developed and emerging markets. Their expectation is that about half of the money, on average, will be in the US and half elsewhere. The portfolio is spread widely across various market caps (20% small- to micro-cap and 20% mega-cap) and valuations (30% value, 32% growth) and industries (though noticeably light on basic materials, tech and financials).

So far, at least in the fund’s first 15 months, it’s working. Our colleague Charles generated a quick calculation of the fund’s performance since inception (December, 2013) against its global peers. Here’s the summary:

vmnvx

Bottom Line

Minimum volatility portfolios allow you to harness the power of other investor’s stupidly: you get to profit from their refusal to bid up boring stocks as they choose, instead, to become involved in the feeding frenzy surrounding sexy biotechs. For investors interested in maintaining their exposure to stocks for the long run, using a global minimum volatility portfolio makes a lot of sense. Using a cheap, discipline one such as Vanguard Global Minimum Volatility makes the most sense for folks who want to pursue that course.

Fund website

Vanguard Global Minimum Volatility. The Vanguard site covers the basics, but doesn’t occur any particularly striking insights into the dynamics of low- or minimum-volatility investing. Happily there are a number of reasonably good reviews, mostly readable, of what you might expect from such a portfolio.

Feifei Li, Ph.D. and Philip Lawton, Ph.D., both of Research Associates, wrote True Grit: The Durable Low Volatility Effect (September 2014). The essay spends as much time on the question of whether the effect is sustainable as on the nature of the effect itself. They draw, in part, on a study of fund manager behavior: fund managers love to tell a dramatic story to clients and associates, which leads them to invest in stocks that … well, have drama. As a result, they subconsciously prefer risky stocks to safe ones. Li and Lawton conclude:

… it is reasonable to expect low volatility investing to persist in producing excess returns. The intensity of investors’ preferences may vary, but chasing outlier returns from stocks that are in vogue seems to be a steady habit … many people find it very hard to change their mindset, and they just don’t seem to learn from experience.

For those who really revel in the statistics, a larger Research Associates team, including the firm’s co-founder Jason Hsu, published a more detailed study of the findings in 2014. Because the web is weird, you can access a pdf of the published study by Googling the title but I can’t embed the link for you. However the pre-publication draft, dated December 2013, is available from the Social Sciences Research Network. Tzee-man Chow, Jason Hsu, Li-lan Kuo, and Feifei Li, A Study of Low-Volatility Portfolio Construction Methods, Journal of Portfolio Management (Summer 2014)

Aye Soe, director of index research and design, Standard & Poor’s, The Low-Volatility Effect: A Comprehensive Look (2012) is not particularly readable, but it delivers what it promises: a comprehensive presentation of the statistical research.

© Mutual Fund Observer, 2015. All rights reserved. The information here reflects publicly available information current at the time of publication. For reprint/e-rights contact us.

Touchstone Sands Capital Emerging Markets Growth Fund (TSEMX/TSEGX), February 2015

By David Snowball

Objective and strategy

The Fund seeks long-term capital appreciation by investing in a compact portfolio of “truly exceptional businesses” linked to the emerging markets, and occasionally to frontier markets. The managers look for companies that have strong financials, sustainable above-average earnings growth, a leadership position in a strong industry, durable competitive advantages, an understandable business model and a rational valuation. They typically hold 30-50 stocks which are “conviction weighted” in the portfolio. Currently three of those are located in frontier markets.

Adviser

Touchstone Advisors. Touchstone is a Cincinnati-based firm with $21.0 billion in assets, as of December 2014. Touchstone selects and monitors the sub-advisors for their 39 funds. The sub-advisor here is Sands Capital Management of Arlington, VA. As of December 31, 2014, Sands Capital had approximately $47.7 billion in assets under management. Sands also manages two closed funds for Touchstone: Touchstone Sands Capital Select Growth (TSNAX) and Touchstone Sands Capital Institutional Growth (CISGX).

Manager

Brian Christiansen, Ashraf Haque and Neil Kansari. The managers have experience as research analysts at Sands and elsewhere. They also have M.B.A.s from first-tier universities (Yale 2009, Harvard 2007 and Darden 2008, respectively). They have not previously managed a mutual fund. In December 2014, the team was designated to run MMI New Stock Market – Sands, a billion dollar emerging markets fund located in Denmark but which trades in London. They are supported by a 38 person research team; the research teams are organized around six global sectors rather than region or asset class.

Strategy capacity and closure

$5 billion estimated capacity for the strategy, based on current market conditions. That might increase as markets evolve.

Active share

93. “Active share” measures the degree to which a fund’s portfolio differs from the holdings of its benchmark portfolio. High active share indicates management which is providing a portfolio that is substantially different from, and independent of, the index. An active share of zero indicates perfect overlap with the index, 100 indicates perfect independence. TSEMX has an active share of 93 which reflects a very high level of independence from its benchmark MSCI Emerging Markets Index.

Management’s stake in the fund

All three managers are invested in the fund but the extent of the investment won’t be public until publication of the new Statement of Additional Information in May, 2015.

Opening date

May 12, 2014.

Minimum investment

$2,500, reduced to $1,000 for tax-advantaged accounts and $100 for accounts established with an automatic investing plan.  Institutional share class has a $500,000 minimum.

Expense ratio

1.30% on assets of $2.3 Billion (as of July 2023). Institutional shares have an expense ratio of 1.24%.

Comments

Touchstone Sands Capital Emerging Markets Growth is a young fund that’s worth watching. It has more going for it than its fine performance in its first ten months on the market.

The fund is managed by Sands Capital Management, using a tested formula. They invest over $47 billion using the same investment discipline. They look for:

  1. Sustainable above-average earnings growth
  2. Leaders in growing industries
  3. The presence of significant competitive advantages
  4. A clear mission and understandable model
  5. Financial strength
  6. Rational valuation

Collectively, they describe this as taking a “business owner’s perspective.” That is, they believe that great businesses will eventually and inevitably see great stock price performance. While a company’s stock price might be unstable, its business operations are likely to be much more stable. As a result, they don’t obsess about short-term price targets or price volatility; they keep focused on whether the underlying company will move ahead for years to come.

And they believe in concentrated and conviction-weighted portfolio. That is, they hold few stocks and put the most money where they have the greatest conviction. They believe that magnifies their returns while helping them to control risk, since they have much less to monitor and adjust than does some guy with a 300 stock portfolio.

The strategy seems to work:

Their Select Growth strategy has returned 12.3% annually since its 1992 launch, while its Russell 1000 Growth benchmark returned 8.9%. The strategy has led its benchmark in every trailing period longer than one year.

Their Global Growth strategy has returned 25% annually since launch in 2008, while its MSCI All Country benchmark has made 13%. The strategy has led its benchmark in every trailing period.

Finally, the Emerging Markets Growth strategy has returned 10.5% annually since launch in late 2012, while the MSCI Emerging Markets Index was actually underwater by 2.4% annually.

Bottom Line

Being independent is a risky business. It often means embracing, for its long-term potential, the sorts of investments that others despise for their short-term dislocations. The well-documented travails of Asian gaming and resort firms illustrate the problem: these firms stand to benefit enormously in moving from a focus on tens of thousands of ultra-rich gamblers to a focus on hundreds of millions of middle-class Chinese vacationers who love to shop and gamble. The Chinese government has committed a half trillion dollars to infrastructure projects in support of that aim but, in the short term, their anti-corruption campaign has panicked the rich and sent revenues falling. By worrying more about the business than about the stock price, Sands is moving in as many rush out. Prospective investors need to ask whether they share Sands’ faith in businesses as long-term drivers of stock performance and share their willingness to ride out the storms. If so, they might want to pay a fair amount of attention to this latest extension of a consistently successful investment discipline.

Fund website

Touchstone Sands Capital Emerging Markets Growth

Fact Sheet

© Mutual Fund Observer, 2015. All rights reserved. The information here reflects publicly available information current at the time of publication. For reprint/e-rights contact us.

Alpha Architect US Quantitative Value (QVAL), December 2014

By Charles Boccadoro

At the time of publication, this fund was named ValueShares US Quantitative Value.

Objective and Strategy

The ValueShares US Quantitative Value (QVAL) strategy seeks long-term capital appreciation by investing in a concentrated portfolio of 40 or so US exchange traded stocks of larger capitalizations, which the adviser determines to be undervalued but possess strong economic moats and financial strength. In a nutshell: QVAL buys “the cheapest, highest quality value stocks.”

The fund attempts to actively capture returns in excess of the so-called “value anomaly” or premium, first identified in 1992 by Professors Fama and French. Basically, stocks with lower valuation (and smaller size) deliver greater than excess returns than the overall market. Using valuation and quality metrics based on empirically vetted academic research, the adviser believes QVAL will deliver positive alpha – higher returns than can be explained by the high-book-to-market value factor.

The adviser implements the QVAL strategy in strictly systematic and quant fashion, because it believes that stock picking based on fundamentals, where value managers try to exploit qualitative signals (e.g., Ben Graham’s cigar butts), is fraught with behavioral biases that “lead to predictable underperformance.”

Adviser

Alpha Architect, LLC maintains the QVAL ETF Trust. Empowered Funds, LLC, which does business as Alpha Architect, is the statutory adviser. Alpha Architect is an SEC-registered investment advisor and asset management firm based in Broomall, Pennsylvania. It offers separately managed accounts (SMAs) for high net worth individuals, family offices, and exchange-traded funds (ETFs). It does not manage hedge funds. There are eight full-time employees, all owner/operators. A ninth employee begins 1 January.

Why Broomall, Pennsylvania? The adviser explains it “is the best value in the area–lowest tax, best prices, good access…the entire team lives 5-10 minutes away and we all hate commuting and have a disdain for flash.” It helps too that it’s close to Drexel University Lebow School of Business and University of Pennsylvania Wharton School of Business, since just about everyone on the team has ties to one or both of these schools. But the real reason, according to two of the managing members: “We both have roots in Colorado, but our wives are both from Philadelphia. We each decided to ‘compromise’ with our wives and settled on Philadelphia.”

Currently, the firm manages about $200M. Based on client needs, the firm employs various strategies, including “quantitative value,” which is the basis for QVAL, and robust asset allocation, which employs uncorrelated (or at least less correlated) asset allocation and trend following like that described in The Ivy Portfolio.

QVAL is the firm’s first ETF.  It is a pure-play, long-only, valued-based strategy. Three other ETFs are pending. IVAL, an international complement to QVAL, expected to launch in the next few weeks.  QMOM will be a pure-play, long-only, momentum-based strategy, launching middle of next year. Finally, IMOM, international complement to QMOM.

ValueShares is the brand name of Alpha Architect’s two value-based ETFs. MomentumShares will be the brand name for its two momentum-based ETFs. The adviser thoroughly appreciates the benefits and pitfalls of each strategy, but mutual appreciation is not shared by each investor camp, hence the separate brand names.

With their active ETF offerings, Alpha Architect is challenging the investment industry as detailed in the recent post “The Alpha Architect Proposition.” The adviser believes that:

  • The investment industry today thrives “on complexity and opaqueness to promote high-priced, low-value add products to confuse investors who are overwhelmed by financial decisions.”
  • “…active managers often overcharge for the expected alpha they deliver. Net of fees/costs/taxes, investors are usually better served via low-cost passive allocations.”
  • “Is it essentially impossible to generate genuine alpha in closet-indexing, low-tracking error strategies that will never get an institutional manager fired.”

Its goal is “to disrupt this calculus…to deliver Affordable Active Alpha for those investors who believe that markets aren’t perfectly efficient.”

The table below depicts how the adviser sees current asset management landscape and the opportunity for its new ETFs. Notice that Active Share, Antti Petajisto’s measure of active portfolio management (ref. “How Active Is Your Fund Manager? A New Measure That Predicts Performance”) is a key tenant. David Snowball started including this metric in MFO fund profiles last March.

qval_1v2

Managers

Wesley Gray, John Vogel and Brandon Koepke. 

Dr. Gray is the founder of Alpha Architect. He earned an BA and a PhD in Finance from the University of Chicago, rose to the rank of captain in the US Marine Corps, and was a finance professor at Drexel University. He is the author of Quantitative Value: A Practitioner’s Guide (2016). Dr. Vogel is a Managing Member of Empowered Funds, LLC and Empiritrage, where he heads the research department.  Dr. Vogel earned a Ph.D. in Finance from Drexel University and served as a research assistant there. Mr. Koepke serves as Chief Technology Officer & Portfolio Manager. Drs. Gray and Vogel has managed the fund since inception, Mr. Koepke joined the team in 2020.

Strategy capacity and closure

As structured currently, QVAL has the capacity for about $1B. The adviser has done a lot of research that shows, from a quant perspective, larger scale would come with attendant drop in expected annualized return “~100-150bps, but gives us capacity to $5-10B.”

Active share

74.5. “Active share” measures the degree to which a fund’s portfolio differs from the holdings of its benchmark portfolio, which for QVAL is S&P500 Total Return index.

In response to our inquiry, the adviser provided an Active Share spread-sheet for several value funds. It shows, for example, Dodge & Cox Fund has an Active Share of 68.7.

MFO has tried to collect and maintain this metric for various funds on our Active Share webpage. Antti Petajisto’s website only provides data through 2009. Morningstar holds the current values close. Only a few fund houses (e.g., FPA) publish them on their fact sheets.

So, we were excited to learn that Alpha Architect is building a tool to compute Active Share for all funds using the most current 13F filings.  The tool will be part of its 100% free (but registration required) DIY Investing webpage.

Management’s Stake in the Fund

Neither Dr. Gray nor Dr. Vogel has a recorded investment in the fund. Mr. Koepke has invested between $10,000 – 50,000 in it.

Opening date

October 22, 2014. In its very short history through November 28, 2014, it has quickly amassed $18.4M in AUM.

Minimum investment

QVAL is an ETF, which means it trades like a stock. At market close on November 28, 2014, the share price was $26.13.

Expense ratio

0.39% with AUM of $222.4 million, as of June 2023. There is no 12b-1 fee.

As of October 2014, a review of US long-only, open-ended mutual funds (OEFs) and ETFs across the nine Morningstar domestic categories (small value to large growth) shows just over 2500 unique offerings, including 269 ETFs, but only 19 ETFs not following an index. Average er of these ETFs not following an index is 0.81%. Average er for index-following ETFs is 0.39%. Average er of the OEFs is 1.13%, with sadly about one third of these charging front-loads of nominally 5.5%. (This continuing practice never ceases to disappoint me.) Average er of OEFs across all share classes in this group is 1.25%.

QVAL appears to be just under the average of its “active” ETF peers, in between a couple other notables: Cambria Shareholder Yield ETF (SYLD) at 0.59% and AdvisorShares TrimTabs Float Shrink ETF (TTFS) at 0.99%.

But there is more…

The adviser informs us that there are “NO SOFT DOLLARS” in the QVAL fee structure.

What’s that mean? The SEC defines soft dollars in its 1998 document “Inspection Report on the Soft Dollar Practices of Broker-Dealers, Investment Advisers and Mutual Funds.”

Advisers that use soft dollars agree to pay higher commissions to broker-dealers to execute its trades in exchange for things like Bloomberg terminals and research databases, things that the adviser could choose to pay out of its own pocket, but rarely does. The higher commissions translate to higher transactions fees that are passed onto investors, effectively increasing er through a “hidden” fee.

“Hidden” outside the er, but disclosed in the fine print. To assess whether your fund’s adviser imposes a “soft dollar” fee, look in its SAI under the section typically entitled “Brokerage Selection” or “Portfolio Transactions and Brokerage.” Here’s how the disclosure reads, something like:

To the extent Adviser obtains brokerage and research services from a broker-dealer that it otherwise would acquire at its own expense, Adviser may have an incentive pay higher commissions than would otherwise be the case.

Here’s how the QVAL SAI reads:

Adviser does not currently use soft dollars.

Comments

Among the many great ideas and anecdotes conveyed in the book Quantitative Value, one is about the crash of the B-17 Flying Fortress during a test flight at Wright Air Field in Dayton, Ohio. The year was 1935. The incident took the life of Army Air Corps’ chief test pilot Major Ployer Hill, a very experienced pilot. Initially, people blamed the plane. That must have failed mechanically, or it was simply too difficult to fly. But the investigation concluded “pilot error” caused the accident. “It turned out the Flying Fortress was not ‘too much airplane for one man to fly,’ it was simply too much airplane for one man to fly from memory.”

In response to the incident, the Army Air Corps successfully instituted checklists, which remain intrinsic to all pilot and test pilot procedures today. The authors of Quantitative Value and the adviser of QVAL believe that the strategy becomes the checklist.

The following diagram depicts the five principal steps in the strategy “checklist” the adviser employs to systematically invest in “the cheapest, highest quality value stocks.” A more detailed description of each step is offered in the post “Our Quantitative Value Philosophy,” which is a much abbreviated version of the book.

qval_2

The book culminates with results showing the qualitative value strategy beating S&P500 handily between 1974 through 2011, delivering much higher annualized returns with lower drawdown and volatility. Over the same period, it also bested Joel Greenblatt’s similar Magic Formula strategy made popular in The Little Book That Beats The Market. Finally, between 1991 and 2011, it outperformed three of the top activity managed funds of the period – Sequoia, Legg Mason Value, and Third Avenue Value. Sequoia, one of the greatest funds ever, is the only one that closely competed based on basic risk/reward metrics.

The quantitative value strategy has evolved over the past 12 years. Wesley states that, “barring some miraculous change in human psychology or a ‘eureka’ moment on the R&D side,” it is pretty much set for the foreseeable future.

Before including QVAL in your portfolio, which is based on the strategy outlined in the book, a couple precautions to consider…

First, it is long only, always fully invested, and does not impose an absolute value constraint.  It takes the “cheapest 10%,” so there will always be stocks in its portfolio even if the overall market is rocketing higher, perhaps irrationally higher. It applies no draw down control. It never moves to cash.

While it may use Ben Graham’s distillation of sound investing, known as “margin of safety,” to good effect, if the overall market tanks, QVAL will likely tank too. An investor should therefore allocate to QVAL based on investment timeline and risk tolerance.

More conservative investors could also use the strategy to create a more market neutral portfolio by going long QVAL and dynamically shorting S&P 500 futures – a DIY hedge fund for a lot less than 2/20 and a lot more tax-efficient. “In this structure you get to spread bet between deep value and the market, which has been a good bet historically,” Wesley explains.

Second, it has no sector diversification constraint. So, if an entire sector heads south, like energy has done lately, the QVAL portfolio will likely be heavy the beaten-down sector. Wesley defends this aspect of the strategy: “Sector diversification simply prevents good ideas (i.e., true value investing) from working. We’ve examined this and this is also what everyone else does. And just because everyone else is doing it, doesn’t mean it is a good idea.”

Bottom Line

The just launched ValueShares US Quantitative Value (QVAL) ETF appears to be an efficient, transparent, well formulated, and systematic vehicle to capture the value premium historically delivered by the US market…and maybe more. Its start-up adviser, Alpha Architect, is a well-capitalized firm with minimalist needs, a research-oriented academic culture, and passionate leadership. It is actually encouraging its many SMA customers to move to ETFs, which have inherently lower cost and no minimums.

If the concept of value investing appeals to you (and it should), if you believe that markets are not always efficient and offer opportunities for active strategies to exploit them, and if you are tired of scratching your head trying to understand ad hoc actions of your current portfolio manager while paying high expenses (you really should be), then QVAL should be on your very short list.

Fund website

The team at Alpha Architect pumps a ton of educational content on its website, which includes white papers, DIY investing tools, and its blog.

Fund Information

© Mutual Fund Observer, 2014. All rights reserved. The information here reflects publicly available information current at the time of publication. For reprint/e-rights contact us.

Sarofim Equity (SRFMX), October 2014

By David Snowball

Objective and strategy

The fund seeks long-term capital appreciation consistent with the preservation of capital. In general it invests in a fairly compact portfolio of multinational, megacap names. The portfolio’s smallest firm is valued at $10 billion and it won’t even consider anything below $5 billion. The managers start by identifying the most structurally attractive sectors, those with the most consistent long term growth prospects. They then look for the leaders in those sectors, which tend to be large, mature and financially stable. They then buy those stocks and hold them, sometimes for decades; annual turnover is frequently 1%.

Adviser

Fayez Sarofim & Co. Fayez Sarofim was founded in 1958 by, well, Fayez Sarofim. It’s a Houston-based, employee-owned firm that manages about $28 billion in assets. It serves as the subadviser to several mutual funds, including Dreyfus Appreciation (DGAGX), Core (DLTSX), Tax-Managed Growth (DTMGX) and Worldwide Growth (PGROX).

Managers

Fayez Sarofim, Gentry Lee, Jeffrey Jacobe, Reynaldo Reza and Alan Christensen. Mr. Sarofim is the firm’s Chairman, Chief Executive Officer and Chief Investment Officer while the others are, respectively, his president, CIO, vice president and COO.

Strategy capacity and closure

Undisclosed. Dreyfus Appreciation owns 61 stocks, the smallest of which has a $10 billion market cap. That implies a $30 billion strategy capacity, assuming that the firm wants to own no more than 5% of the outstanding shares of any corporation. Institutional constraints might dictate a lower capacity, but there’s been no commentary on those.

Active share

Undisclosed. We presume that the portfolio statistics for Sarofim will parallel those for Dreyfus Appreciation but Dreyfus hasn’t disclosed the active share for the fund. They published “The Case for Active Share Analysis” (2014), part of their “Sales Ideas” series for advisers, but chose to provide the active share for only five of its 88 funds. Given the fund’s high R-squared (91) and focus on huge multinational stocks, it is unlikely to have a high active share.

Management’s stake in the fund

None yet recorded. Mr. Sarofim has over $1 million in both of the Dreyfus funds that he co-manages. Mr. Lee has between $50,000 – $100,000 in both. Mr. Jacobe has between $1 – $50,000 in both.

Opening date

January 17, 2014.

Minimum investment

$2,500

Expense ratio

0.70%, after waivers, on assets of $105 million (as of July 2023). There’s also a 2% redemption fee on shares held 90 days or less.

Comments

Fayez Sarofim & Co. mostly manages the personal wealth of very, very rich people. Like many such firms, it’s faced with “the grandchild problem.” What do you do when one of your investors, who might have entrusted a hundred million to you, asks you to work with her grandkids who might have just a paltry few tens of thousands to invest? The most common answer is, very quietly, to open a mutual fund or two to serve those younger family members. Such funds are normally available to the general public but are rarely advertised.

Because those funds are offered as a service to their clients, the advisor has no incentive to attract bunches of assets or to pad their fees (gramps would not like that). They are, on whole, a quiet bunch.

For years, Fayez Sarofim & Co. has had a productive, amicable relationship with Dreyfus, four of whose funds they subadvise. The most notable of those is Dreyfus Appreciation (DGAGX). DGAGX is the most visible manifestation of Mr. Sarofim’s mantra, “buy the best companies and hold them forever.” The fund has a sort of ultra-blue chip portfolio topped with Apple, Exxon, Philip Morris, Coca-Cola, Chevron and Johnson & Johnson. Heck, you even know the smallest and most obscure names they hold: News Corp, 21st Century-Fox, and Whole Foods.

It is not a flashy portfolio. It is, however, one finely attuned to the needs of really long-term investors. By Morningstar’s calculation, “While the fund’s 10-year returns don’t look great right now, on a rolling basis its 10-year returns have beaten the large-blend category 87% of the time under the current team. It has done this with significantly less volatility than its average peer, so its returns look pretty good on a risk-adjusted basis.”

Sarofim Equity was very, very quietly launched in January 2014 to serve the needs of Sarofim’s lower-paid staff and its investors’ friends and family. How quietly? The fund not only doesn’t have a webpage, its existence isn’t even acknowledged on the Sarofim & Co. site. Morningstar’s link to the fund still points to another company, weeks after we mentioned the glitch to them. There’s no factsheet, no news release, no posted letters. A Sarofim executive stressed to me last year that they have no interest in competing with Dreyfus, their long-time partners, or drawing attention from the Dreyfus funds they subadvise. They just want a tool for in-house use.

This, however, an attractive fund. Sarofim Equity is likely to differ from Dreyfus Appreciation in only two material ways. First, it’s likely to hold the same stocks but not necessarily in exactly the same weightings. It’s a question of what’s most attractively priced when money flows in, and some of the Dreyfus holdings were established decades ago. At last check, both the top five and top ten holdings were the same names in slightly jumbled order. Second, Sarofim Equity is cheaper. Sarofim charges 71 basis points, Dreyfus charges 94.

Bottom Line

Dreyfus Appreciation has been a consistently solid choice for conservative investors looking for exposure to the world’s best companies. Given the firm’s investment strategy, “small and nimble” isn’t a particular advantage for the new fund. Less costly is.

Fund website

There isn’t one. You can, however, call the fund’s representatives at 855-727-6346. Barron’s wrote a nice profile of the 85-year-old Mr. Sarofim, “A Lion in Winter,” in 2013 (Google the title to find access). In one of those developments that make me smile and look out the window, Mr. S. married his son’s mother-in-law in the summer of 2014. 

Prospectus

© Mutual Fund Observer, 2014. All rights reserved. The information here reflects publicly available information current at the time of publication. For reprint/e-rights contact us.

Meridian Small Cap Growth (MSGAX/MISGX), October 2014

By David Snowball

Objective and strategy

The fund pursues long-term capital growth by investing, primarily, in domestic small cap stocks. Their discipline stresses the importance of managing risk first and foremost. They seek to avoid the subset of sometimes alluring names which seem set up for terminal decline, then identifying high quality small firms with the sorts of sustainable competitive advantages and competent leadership that might lead them one day to become high quality large firms. As of 2013, the stocks in their target universe had market caps between $50 million and $4.8 billion. The portfolio holds about 100 stocks.

Adviser

Arrowpoint Asset Management, LLC. Headquartered in Denver, Arrowpoint was founded in 2007 by three former Janus Funds managers: David Corkins, Karen Reidy and Minyoung Sohn. Arrowpoint provides investment management services to high net worth individuals, banks and corporations and also advises the four Meridian funds. The firm has grown from 10 employees and $1 billion AUM in 2007 to 37 employees and $6.2 billion in 2014. Part of that growth came from the acquisition of Aster Investment Management and the Meridian Funds in 2013 following founder Rick Aster’s death.

Managers

Chad Meade and Brian Schaub. Before joining Arrowpoint, Mr. Meade worked at Janus as an analyst (2001-2011) and portfolio manager for Triton (2006-2013) and Venture (2010-13). His analytic focus was on small cap health care and industrial stocks. Mr. Schaub’s career paralleled Mr. Meade’s. He joined Janus as an analyst in 2000 and co-managed both Triton and Venture with Mr. Meade. Mr. Meade is a Virginia Tech grad while Williams College is Mr. Schaub’s alma mater. They are supported by six dedicated analysts who report directly to them.

Strategy capacity and closure

Between $1.5 – 2.0 billion.  The managers were responsible for handling up to $9 billion at Janus and think they have a pretty good handle on the amount of money that they and the strategy can profitably accommodate.

Active share

Not yet available.

Management’s stake in the fund

Both managers have over $1 million in each of the funds (Growth and Small Cap Growth) that they oversee. Everyone at Arrowpoint is encouraged to have some amount invested in the funds but since each employee’s needs and resources differ, there’s no mandated dollar amount. Two of Meridian’s independent trustees have over $100,000 invested with the firm and two have no investment.

Opening date

December 16, 2013.

Minimum investment

$99,999 for Investor Class shares, $2,500 for Advisor Class which is widely available through brokerages.

Expense ratio

1.49% for Advisor Class, 1.22% for Investor Class, and 1.09% for Institutional class on assets of about $764.8 million (as of July 2023).

Comments

So far, so (predictably) good. Meridian Small Cap Growth draws on its managers’ simple, logical, repeatable discipline. It is, like its forebears, quietly thriving. Janus Triton (JGMAX), the fund’s most immediate predecessor, outperformed its peers in seven of seven years that Messrs. Schaub and Meade managed the fund. Over their time as a whole, it crushed its benchmark by over 400 bps a year, beat 95% of its peers and exposed its investors to just 80% of its average peer’s risk (per Morningstar, 5/22/13).

Here’s the visual representation of that performance, with Triton represented by the blue line and Morningstar’s proprietary small-growth index in red.  A $10,000 investment in Triton grew to $21,100 over their tenure, a similar investment in the average small growth fund grew to $15,900.

triton

That’s a remarkable accomplishment. Only 9% of all small-growth managers have managed to exceed their benchmark over the past five years, much less over seven years. And much, much less over seven years with substantially reduced volatility. The questions, reasonably enough, are two: (1) how did they do it and (2) what are the prospects that they can do it again?

One hallmark of really first-rate minds is the ability to make complex notions or processes seem comprehensible, almost self-evidently simple. As I spoke with the managers about Question One, their answer made it seem almost laughably simple: they buy good companies and avoid bad ones.

One possibility is that it really is simple. The other is that they’re really good.

I’m opting for the latter.

Chad and Brian attribute their success to two, equally significant disciplines. First, they identify and avoid losers. They illustrated the importance of that by dividing the five-year returns of the stocks in their benchmark, the Russell 2000 Growth, into quintiles; the top quintile represented the one-fifth of stocks with the highest returns while the bottom quintile represented the one-fifth with lowest returns. The lowest quintile stocks in the index lost an average of 80% in value over five years. That’s over 200 stocks which would need to return over 500% of their lows just to break even. Chad argues that it’s the dark side of the power of compounding; that those losses are simply too great to ever overcome. “We could never afford to invest in that quintile, regardless of the exciting stories they can tell,” he noted. “Avoiding them has probably contributed half or better of our outperformance.”

There is no reliable, mechanical way to screen out losers, which explains their continued presence in the indexes.  “There are many failures,” Brian argues.  Many firms have products that won’t be relevant in three to five years.  Many can’t raise prices.  Some are completely dependent on a single large customer; others suffer disruption and disintermediation (that is, customers find ways to live without them).  Many are reliant on the capital markets to survive, rather than being able to fund their operations through internally-generated free cash flow.

Each stock they consider starts with the same question: “how much could we lose?” They create worst case, base case and best case models for each firm’s future and eliminate all of the stocks with terrible worst case outcomes, regardless of how positive the base and best cases might be. 

They trace that staunch loss aversion to personal history: they both entered the profession in mid-2000 when it seemed like every stock and every screen was flashing red all the time.  “I don’t think we’ll ever forget that experience.  It has permanently shaped our investing discipline.”

The other half of the process is identifying firms with sustainable competitive advantages.  “All large caps have them,” they note, “while few small caps do.”  The small cap universe remains under covered by Wall Street firms; there are just a handful of sell-side analysts attempting to sort through several thousand stocks.  “Overall, they’re less picked over and less efficiently priced,” according to Mr. Schaub.  Among the characteristics they’re looking for is a growing industry, evidence of pricing power (are their goods or services sufficiently valuable that they can afford to charge more for them?), of strengthening margins (is the firm making money more efficiently as it matures?) and low market penetration (are there lots of new opportunities for growth and diversification?).

Bottom Line

Schaub and Meade’s goal is clear, sensible and attainable: “we try to run an all-weather portfolio that would be an investor’s core small growth position; not something that you trade into and out of but something that’s a permanent part of the portfolio.  We’re not trying to shoot the lights out, but we think our discipline and experience will allow us to capture 100% or a little bit more of the market’s total return while shooting downside capture of  80%. We think that should give us good relative results over a full market cycle.” While the track record of the fund is short, the record of its managers is long and impressive. Investors looking for intelligent, risk-managed exposure to this important slice of the market owe it to themselves to look closely here.

Fund website

Meridian Small Cap Growth

© Mutual Fund Observer, 2014. All rights reserved. The information here reflects publicly available information current at the time of publication. For reprint/e-rights contact us.

Miller Income (LMCJX), October 2014

By David Snowball

At the time of publication, this fund was named Miller Income Opportunity Fund.

Objective and strategy

The fund hopes to provide a high level of income while maintaining the potential for growth. They hope to “generate a high level of income from a wide array of sources” by prowling up and down firms’ capital structures and across asset classes. The range of available investments is nigh unto limitless: common stocks, business development corporations, REITs, MLPs, preferred stock, convertibles, public partnerships, royalty trusts, bonds, currency-linked derivatives, CEFs, ETFs and both offensive and defensive derivatives. The managers may choose to short markets or individual securities, “a speculative strategy that involves special risks.” The fund is non-diversified, though it holds a reasonably large number of positions.  

Adviser

Legg Mason. Founded in 1899, the firm is headquartered in Baltimore but has offices around the world (New York, London, Tokyo, Dubai, and Hong Kong). It is a publicly traded company with $711 billion in assets under management, as of August, 2014. Legg Mason advises 86 mutual funds. Its brands and subsidiaries include Clearbridge (the core brand, launched after the value of the “Legg Mason” name became impaired), Permal (hedge funds), Royce Funds (small cap funds), Brandywine Global (institutional clients), QS Investors (a quant firm managing the QS Batterymarch funds) and Western Asset (primarily their fixed-income arm).

Manager

Bill Miller III and Bill Miller IV. The elder Mr. Miller (William Herbert Miller III) managed the Legg Mason Value Trust from 1982 – 2012 and still co-manages Legg Mason Opportunity (LMOPX). Mr. Miller received many accolades for his work in the 1990s, including Morningstar’s manager of the year (1998) and of the decade. Of the younger Mr. Miller we know only that “he has been employed by one or more subsidiaries of Legg Mason since 2009.”

Strategy capacity and closure

Not available.

Active share

Not available. Mr. Miller’s other Opportunity Fund (LMOPX) has a low r-squared and high tracking error, which implies a high active share but does not guarantee it.

Management’s stake in the fund

None yet recorded. Mr. Miller owns more than $1 million in LMOPX shares.

Opening date

February 26, 2014.

Minimum investment

$1,000 for “A” shares, reduced to $250 for IRAs and $50 for accounts established with an automatic investment plan.

Expense ratio

1.21% on assets of $141.2 million (as of July 2023). “A” shares also carry a 5.75% sales load. Expenses for the other share classes range from 0.90 – 1.95%.

Comments

If you believe that Mr. Miller’s range of investment competence knows no limits, this is the fund for you.

Mr. Miller’s fame derives from a 15 year streak of outperforming the S&P 500. That streak ran from 1991-2005. It was followed by trailing the S&P500 in five of the next six years. During this latter period, a $10,000 investment in the Legg Mason Value Trust (LMVTX, now ClearBridge Value Trust) declined to $6,700 while an investment in the S&P500 grew to $12,000. At the height of its popularity, LMVTX held $12 billion in assets. By the time of Mr. Miller’s departure in April 2012, it has shrunk by 85%. Morningstar counseled patience (“we think this is a good time to buy this fund” 2007; “keep the faith” 2008; “we still like the fund” late 2008; “we appreciate the bounce” 2009; “over the past 15 years, however, the fund still sits in the group’s best quartile” 2010) before succumbing to confusion and doubt (“The case for Legg Mason Capital Management Value Trust is hard, but not impossible, to make” 2012).

The significance of Mr. Miller’s earlier accomplishment has long been the subject of dispute. Mr. Miller described the streak as “an accident of the calendar … maybe 95% luck,” since many of his annual victories reflected short-lived bursts of outperformance at year’s end. Defenders such as Legg Mason’s Michael Mauboussin calculated the probability that his streak was actually luck at one in 2.3 million. Skeptics, arguing that Mauboussin used careless if convenient assumptions, claim that the chance his streak was due to luck ranged from 3 – 75%.

Mr. Miller’s approach is contrarian and concentrated: he’s sure that many securities are substantially mispriced much of the time and that the path to riches is to invest robustly in the maligned, misunderstood securities. Those bets produced dramatic results: his Opportunity Trust (LMOPX) captured nearly 200% of the market’s downside over the past five- and ten-year periods, as well as 150% of its upside. The fund’s beta averages between 1.6 – 1.7 over the same periods. Its alpha is substantially negative (-5 to -8), which suggests that shareholders are not being fairly compensated for the fund’s volatility. Here’s the fund’s history (in blue) against the S&P MidCap 400 (yellow). Investors seem to have had trouble sticking with the fund, whose 5- and 10-year investor returns (a Morningstar measure that attempts to capture the experience of the average investor in the fund) trail 95% of its peers. Assets have declined by about 80% since their 2007 peak.

lmopx

Against this historic backdrop, Mr. Miller has been staging a comeback. “Unchastened” and pursuing “blindingly obvious trends” (“Mutual-fund king Bill Miller makes a comeback,” Wall Street Journal, 6/29/14), LMOPX has returned 35% annually over the past three years (through September 2014) which places him in the top 2% of his peer group. In February he and his son were entrusted with this new fund.

Four characteristics of the fund stand out.

  1. Its portfolio is quite distinctive. The fund can invest, long or short, in almost any publicly traded security. The asset class breakdown, as of August 2014, was:

    Common Stock

    39%

    REITs

    20

    Publicly-traded partnerships

    20

    Business development companies and registered investment companies

    9

    Bonds

    7

    Preferred shares

    3

    Cash

    2

    Mr. Miller’s stake in his top holdings is often two or three times greater than the next most concentrated fund holding.

  2. Its performance is typical. There are two senses of “typical” here. First, it has produced about the same returns as its competitors. Second, it has done so with substantially greater volatility, which is typical of Mr. Miller’s funds.
    miller

  3. It is remarkably expensive. That’s also typical for a Legg Mason fund. At 1.91%, this is the single most expensive fund in its peer group: world allocation funds, either “A” or no-load, with at least $100 million in assets. The fund charges about 50 basis points more than its next most expensive competitor. According to the prospectus, an A-share account that started at $10,000 and grew by 5% per year would incur $1212 in annual fees over the next three years.

  4. Its income production is minimal. While the fund aspires to “a high level of income,” Morningstar reports that its 30-day SEC yield is 0.00% (as of September 2014). The fund’s website reports a midyear income payout of $0.104 per share, roughly 1%. “Yield” is not reported as one of the “portfolio characteristics” on the webpage.

Bottom Line

It is hard to make a case for Miller Income Opportunity. It’s impossible to project the fund’s returns even if we were to assume the wildly improbable “average” stock market performance of 10% per year. We can, with some confidence, say that the returns will be idiosyncratic and exceedingly volatile. We can say, with equal confidence, that the fund will be enduringly expensive. Individual interested in exposure to a macro hedge fund, but lacking the required high net worth, might find this hedge fund like offering and its mercurial manager appealing. Most investors will find greater profit in small, flexible funds (from Oakseed Opportunity SEEDX to T. Rowe Price Global Allocation RPGAX) with experienced teams, lower expenses and greater sensitivity to loss control. 

Fund website

Miller Income Fund

© Mutual Fund Observer, 2014. All rights reserved. The information here reflects publicly available information current at the time of publication. For reprint/e-rights contact us.

Janus Henderson Absolute Return Income Opportunities Fund (formerly Janus Global Unconstrained Bond), (JUCAX), October 2014

By David Snowball

At the time of publication, this fund was named Janus Global Unconstrained Bond Fund.

Objective and strategy

The fund is seeking maximum total return, consistent with preservation of capital. Consistent with its name, the manager is free to invest in virtually any income-producing security; the prospectus lists corporate and government bonds, both international and domestic, convertibles, preferred stocks, common stocks “which have the potential for paying dividends” and a wide variety of derivatives. Up to 50% of the portfolio may be invested in emerging markets. The manager can lend, presumably to short-sellers, up to one-third of the portfolio. The duration might range from negative three years, a position in which the portfolio would rise if interest rates rose, to eight years.

Adviser

Janus Capital Management, LLC. Janus is a Denver-based investment advisor that manages $178 billion in assets. $103 billion of those assets are in mutual funds. Janus was made famous by the success of its gun-slinging equity funds in the 1990s and infamous by the failure of its gun-slinging equity funds in the decade that followed. It made headlines for management turmoil, involvement in a market-timing scandal, manager departures and lawsuits. Janus advises 54 Janus, Janus Aspen, INTECH and Perkins mutual funds; of those, 28 have managers with three years or less on the job.

Manager

William Gross. Mr. Gross founded PIMCO, as well as serving as a managing director, portfolio manager and chief investment officer for them. Morningstar recognized him as its fixed income manager of the decade for 2000-09 and has named him as fixed-income manager of the year on three occasions. His media handle was “The Bond King,” a term which Google finds associated with his name on 100,000 occasions. He was generally recognized as one of the industry’s three most accomplished fixed-income investors, along with Jeffrey Gundlach of DoubleLine and Dan Fuss of Loomis Sayles. At the time of his departure from PIMCO, he was responsible for $1.8 trillion in assets and managed or co-managed 34 mutual funds.

Strategy capacity and closure

Not yet reported. PIMCO allowed its Unconstrained Bond fund, which Mr. Gross managed in 2014, to remain open after assets reached $20 billion. That fund has trailed two-thirds or more its “non-traditional bond” peers for the past one- , three- and five-year periods.

Active share

Not available.

Management’s stake in the fund

Not yet recorded. Mr. Gross reputedly had $240 million invested in various PIMCO funds and might be expected to shift a noticeable fraction of those investments here but there’s been no public statement on the matter.

Opening date

May 27, 2014.

Minimum investment

$2,500 for “A” shares and no-load “T” shares. There are, in whole, seven share classes. Brokerage availability is limited, a condition which seems likely to change.

Expense ratio

The fund has 8 different share class with expense ratios ranging from 0.63% to 1.71% and assets under management of $58.7 million, as of July 2023. 

Comments

The question isn’t whether this fund will draw billions of dollars. It will. Mr. Gross, a billionaire, has a personal investment in the PIMCO funds reportedly worth $250 million. I expect much will migrate here. He’s been worshipped by institutional investors and sovereign wealth fund managers. Thousands of financial advisors will see the immediate opportunity to “add value” by “moving ahead of the crowd.”  The Wall Street Journal reported that PIMCO saw $10 billion in asset outflows at the announcement of Mr. Gross’s departure (“Pimco’s New CIOs: ‘Bill Gross Relied on Us,’” 9/29/14) and speculated that outflows could reach $100 billion.

No, the question isn’t whether this fund attracts money. It’s whether the fund should attract your money.

Three factors would predispose me against such an investment.

  1. Mr. Gross’s reported behavior does not inspire confidence. Mr. Gross’s departure from PIMCO was not occasioned by poor performance; it was occasioned by poor behavior. The evidence available suggests that he has become increasingly autocratic, irascible, disrespectful and inconsistent. The record of PIMCO’s loss of talented staff – both those who left because they could not tolerate Mr. Gross’s behavior and those who apparently threatened to resign en masse over it – speaks to a sustained, substantial problem. Josh Brown of Ritzholz Wealth Management suspects that Gross’s dramatically wrong market bets led him “to hunker down. To throw people out of one’s office when they voice dissension. To view the movement of the market as an affront to one’s intelligence … for a highly-visible professional investor [such a mindset] becomes utterly debilitating.” We’ve wondered, especially after the Morningstar presentation, whether there might be a health issue somewhere in the background. Regardless of its source, the behavior is an unresolved problem.

  2. Mr. Gross’s recent performance does not inspire confidence. Not to put too fine a point on it, but Mr. Gross already served as manager of an unconstrained bond portfolio, PIMCO Unconstrained Bond and its near-clone Harbor Unconstrained Bond, and his performance was distinctly mediocre. He assumed control of the fund in December 2013 when Chris Dialynis took a sudden sabbatical which some now attribute to fallout from an internal power struggle. Regardless of the motive, Mr. Gross assumed control and trailed his peers (the green line) through the year.
    janus

    While the record is too short to sustain much of a judgment, it does highlight the fact that Mr. Gross does not arrive bearing a magic wand.

  3. Mr. Gross is apt to feel that he’s got something to prove. It is hard to imagine that he does not approach this new assignment with a considerable chip on his shoulder. He has always had a penchant for bold moves, some of which have substantially damaged his shareholders. Outsized bets in favor of TIPs and emerging markets bonds (2013) and against Treasuries (2011) are typical of the “Macro bets [that] have come to dominate the fund’s high-level decision-making in recent years” (Morningstar analyst Eric Jacobson, July 16 2013). The combination of a tendency to make bold bets and the unavoidable pressure to show the world they were wrong is fundamentally troubling.

Bottom Line

Based on Mr. Gross’s long track record with PIMCO Total Return, you might be hoping for returns that exceed their benchmark by 1-2% per year. Over the course of decades, those gains would compound mightily but Mr. Gross, 70, will not be managing this fund for decades. The question is, what risk are you assuming in pursuit of those very modest gains over the relatively modest period in which he’s likely to run the fund? Shorn of his vast analyst corps and his place on the world stage, the answer is not clear. As a general rule, in the most conservative part of your portfolio, clarity on such matters would be deeply desirable. We’d counsel watchful waiting, the fund is likely to still be available in six months and the picture will be far clearer then.

Fund website

Janus Henderson Absolute Return Income Opportunities Fund

© Mutual Fund Observer, 2014. All rights reserved. The information here reflects publicly available information current at the time of publication. For reprint/e-rights contact us.

KL Allocation Fund (formerly GaveKal Knowledge Leaders), (GAVAX/GAVIX), August 2014

By David Snowball

At the time of publication, this fund was named GaveKal Knowledge Leaders Fund.

Objective and strategy

The fund is trying to grow capital, with the particular goal of beating the MSCI World Index over the long term. They invest in between 40 and 60 stocks of firms that they designate as “knowledge leaders.” By their definition, “Knowledge Leaders” are a group of the world’s leading innovators with deep reservoirs of intangible capital. These companies often possess competitive advantages such as strong brand, proprietary knowledge or a unique distribution mechanism. Knowledge leaders are largely service-based and advanced manufacturing businesses, often operating globally.” Their investable universe is mid- and large-cap stocks in 24 developed markets. They buy those stocks directly, in local currencies, and do not hedge their currency exposure. Individual holdings might occupy between 1-5% of the portfolio.

Adviser

GaveKal Capital (GC). GC is the US money management affiliate of GaveKal Research Ltd., a Hong Kong-based independent research boutique. They manage over $600 million in the Knowledge Leaders fund and a series of separately managed accounts in the US as well as a European version (a UCITS) of the Knowledge Leaders strategy.

Manager

Steven Vannelli. Mr. Vannelli is managing director of GaveKal Capital, manager of the fund and lead author of the firm’s strategy for how to account for intangible capital. Before joining GaveKal, he served for 10 years at Denver-based money management firm Alexander Capital, most recently as Head of Equities. He manages about $600 million in assets and is assisted by three research analysts, each of whom targets a different region (North America, Europe, Asia).

Strategy capacity and closure

With a large cap, global focus, they believe they might easily manage something like $10 billion across the three manifestations of the strategy.

Active share

91. “Active share” measures the degree to which a fund’s portfolio differs from the holdings of its benchmark portfolio.  High active share indicates management which is providing a portfolio that is substantially different from, and independent of, the index. An active share of zero indicates perfect overlap with the index, 100 indicates perfect independence. The active share for the Knowledge Leaders Fund is 91, which reflects a very high level of independence from its benchmark MSCI World Index.

Management’s stake in the fund

Minimal. Mr. Vannelli seeded the fund with $250,000 of his own money but appears to have disinvested over time. His current stake is in the $10,000-50,000 range. As one of the eight partners as GaveKal, he does have a substantial economic stake in the advisor. There is no corporate policy encouraging or requiring employee investment in the fund and none of the fund’s directors have invested in it.

Opening date

September 30, 2010 for the U.S. version of the fund. The European iteration of the fund launched in 2006.

Minimum investment

$2500

Expense ratio

1.5% on A-share class (1.25% on I-share class) on domestic assets of $190 million, as of July 2014.

Comments

The stock investors have three nemeses:

  • Low long-term returns
  • High short-term volatility
  • A tendency to overpay for equities

Many managers specialize in addressing one or two of these three faults. GaveKal thinks they’ve got a formula for addressing three of three.

Low long-term returns: GaveKal believes that large stocks of “intangible capital” are key drivers of long-term returns and has developed a database of historic intangible-adjusted financial data, which it believes gives it a unique perspective. Intangible capital represents investments in a firm’s future profitability. It includes research and development investments but also expenditures to upgrade the abilities of their employees. There’s unequivocal evidence that such investments drive a firm’s long-term success. Sadly, current accounting practices punish firms that make these investments by characterizing them as “expenses,” the presence of which make the firm look less attractive to short-term investors. Mr. Vannelli’s specialty has been in tracking down and accurately characterizing such investments in order to assess a firm’s longer-term prospects. By way of illustration, research and development investments as a percentage of net sales are 8.3% in the portfolio companies but only 2.4% in the index firms.

High short-term volatility: there’s unequivocal empirical and academic research that shows that investors are far more cowardly than they know. While we might pretend to be gunslingers, we’re actually likely to duck under the table at the first sign of trouble. Knowing that, the manager works to minimize both security and market risk for his investors. They limit the size of any individual position to 5% of the portfolio. They entirely screen out a number of high leverage sectors, especially those where a firm’s fate might be controlled by government policies or other macro factors. The excluded sectors include financials, commodities, utilities, and energy. Conversely, many of the sectors with high concentrations of knowledge leaders are defensive.  Health care, for example, accounts for 86 of the 565 stocks in their universe.

Finally, they have the option to reduce market exposure when some combination of four correlation and volatility triggers are pulled. They monitor the correlation between stocks and bonds, the correlation between stocks within a broad equity index, the correlation between their benchmark index and the VIX and the absolute level of the VIX. In high risk markets, they’re at least 25% in cash (as they are now) and might go to 40% cash. When the market turns, though, they will move decisively back in: they went from 40% cash to 3% in under two weeks in late 2011.

A tendency to overpay: “expensive” is always relative to the quality of goods that you’re buying. GaveKal assigns two grades to every stock, a valuation grade based on factors such as price to free cash flow relative both to a firm’s own history and to its industry’s and a quality grade based on an analysis of the firm’s balance sheet, cash flow and income statement. Importantly, Gavekal uses its proprietary intangible-adjusted metrics in the analysis of value and quality.

The analysts construct three 30 stock regional portfolios (e.g., a 30 stock European portfolio) from which Mr. Vannelli selects the 50-60 most attractively valued stocks worldwide.

In the end, you get a very solid, mildly-mannered portfolio. Here are the standard measures of the fund against its benchmark:


GAVAX

MSCI World

Beta

.42

1.0

Standard deviation

7.1

13.8

Alpha

6.3

0

Maximum drawdown

(3.3)

(16.6)

Upside capture

.61

1.0

Downside capture

.30

1.0

Annualized return, since inception

10.5

13.4

While the US fund was not in operation in 2008, the European version was. The European fund lost about 36% in 2008 while its benchmark fell 46%.  Since the US fund is permitted a higher cash stake than its European counterpart, it follows that the fund’s 2008 outperformance might have been several points higher.

Bottom Line

This is probably not a fund for investors seeking unwaveringly high exposure to the global equities market. Its cautious, nearly absolute-return, approach to has led many advisors to slot it in as part of their “nontraditional/liquid alts” allocation. The appeal to cautious investors and the firm’s prodigious volume of shareholder communications, including weekly research notes, has led to high levels of shareholder loyalty and a prevalence of “sticky money.” While I’m perplexed by the fact that so little of the sticky money is the manager’s own, the fund has quietly made a strong case for its place in a conservative equity portfolio.

Fund website

GaveKal Knowledge Leaders. While you’re there, read the firm’s white paper on Intangible Economics and their strategy presentation (2014) which explains the academic research, the accounting foibles and the manager’s strategy in clear language.

© Mutual Fund Observer, 2014. All rights reserved. The information here reflects publicly available information current at the time of publication. For reprint/e-rights contact us.

Artisan High Income (ARTFX), July 2014

By David Snowball

Objective and Strategy

Artisan High Income seeks to provide total return through a combination of current income and capital appreciation. They invest in a global portfolio of high yield corporate bonds and secured and unsecured loans. They pursue issuers with high quality business models that have compelling risk-adjusted return characteristics.

They highlight four “primary pillars” of their discipline:

Business Quality, including both the firm’s business model and the health of the industry. 

Financial Strength and Flexibility, an inquiry strongly conditioned by the firm’s “history and trend of free cash flow generation.”

Downside Analysis. Their discussion here is worth quoting in full: “The team believes that credit instruments by their nature have an asymmetric risk profile. The risk of loss is often greater than the potential for gain, particularly when looking at below investment grade issuers. The team seeks to manage this risk with what it believes to be conservative financial projections that account for industry position, competitive dynamics and positioning within the capital structure.”

Value Identification, including issues of credit improvement, relative value, catalysts for business improvement and “potential value stemming from market or industry dislocations.”

The portfolio is organized around high conviction core positions (20-60% of assets), “spread” positions where the team fundamentally disagrees with the consensus view (10-50%) and opportunistic positions which might be short-term opportunities triggered by public events that other investors have not been able to digest and respond to (10-30%).

Adviser

Artisan Partners, L.P. Artisan is a remarkable operation. They advise the 14 Artisan funds (all of which have a retail (Investor) share class since its previously institutional emerging markets fund advisor share class was redesignated in February.), as well as a number of separate accounts. The firm has managed to amass over $105 billion in assets under management, of which approximately $61 billion are in their mutual funds. Despite that, they have a very good track record for closing their funds and, less visibly, their separate account strategies while they’re still nimble. Seven of the firm’s 14 funds are closed to new investors, as of July 2014.  Their management teams are stable, autonomous and invest heavily in their own funds.

Manager

Bryan C. Krug.  Mr. Krug joined Artisan in December 2013.  From 2001 until joining Artisan, Mr. Krug worked for Waddell & Reed and, from 2006, managed their Ivy High Income Fund (WHIAX).  Mr. Krug leads Artisan’s Kansas City-based Credit Team. His work is supported by three analysts (Joanna Booth, Josh Basler and Scott Duba).  Mr. Krug interviewed between 40 and 50 candidates in his first months at Artisan and seems somewhere between upbeat and giddy (well, to the extent fixed-income guys ever get giddy) at the personal and professional strengths of the folks he’s hired.

Strategy capacity and closure

There’s no preset capacity estimate. Mr. Krug makes two points concerning the issue. First, he’s successfully managed $10 billion in this strategy at his previous fund. Second, he’s dedicated to being an investment organization first and foremost; if at any point market changes or investor inflows threaten his ability to benefit his investors, he’ll close the fund. Artisan Partners has a long record of supporting their managers’ decision to do just that.

Management’s Stake in the Fund

Not yet disclosed. In general, Artisans staff and directors have invested between hundreds of thousands to millions of their own dollars in the Artisan complex.

Opening date

March 19, 2014

Minimum investment

$1,000

Expense ratio

0.95% on assets of $6.5 Billion, as of June 2023. There’s also a 2.0% redemption fee on shares held under 90 days.

Comments

There is a real question about whether mid 2014 is a good time to begin investing in high yield bonds. Skeptics point to four factors:

  • Yields on junk bonds are at or near record lows (see “Junk bond yields at new and terrifying lows,” 06/24/2014)
  • The spread from junk and investment grade bonds, that is, the addition income you receive for investing in a troubled issuer, is at or near record lows (“New record low,” 06/17/2014).
  • Demand for junk is at or near record highs.
  • Issuance of new junk – sometimes stuff being rushed to market to help fatten the hogs – is at or near record highs. Worried about high demand and low standards, Fed chair Janet Yellen allowed that “High-yield bonds have certainly caught our attention.” The junk market immediately rallied on the warning, with yields falling even lower (“Yellen’s risky debt warning leads to rally in risky debt,” 06/20/2014).

All of that led the estimable John Waggoner to announce that it’s “Time to sell your junk” (06/26/2014.).

None of that comes as news to Bryan Krug. His fund attracted nearly $300 million in three months and, as of late June, he reported that the portfolio was fully invested. He makes two arguments in favor of Artisan’s new fund:

First. Pricing in high yield debt is remarkably inefficient, so that even in richly valuable markets there are exploitable pockets of mispricing. “[W]e believe there is no shortage of inefficiencies … the market is innately complex and securities are frequently mispriced, which benefits those investors who are willing to roll up their sleeves and perform detailed, bottom-up analysis.” The market’s overall valuation is important primarily if you’re invested in a passive vehicle.

Second. High yield and loans do surprisingly well in many apparently hostile environments. In the past quarter century, there have been 16 sharp moves up in interest rates (more than 70 bps in a quarter); high yield bonds have returned, on average, 2.5% during those quarters and leveraged loans returned 3.9%. Even if we exclude the colossal run-up in the second quarter of 2009 (the turn off the March market bottom, where both groups gained over 20% in three months) returns for both groups are positive, though smaller.

Returns for investment grades bonds were, on average, notably negative. Being careful about the quality of the underlying business makes a huge difference. In 2008 Mr. Krug posted top tier results not because his bonds held up but because they didn’t go to zero. “We avoided permanent loss of capital by investing in better businesses, often asset-light firms with substantial, undervalued intellectual property.” There were, he says, no high fives that year but considerable relief that they contained the worst of the damage.

The fund has the flexibility of investing elsewhere in a firm’s capital structure, particularly in secured and unsecured loans. As of late June, those loans occupied about a third of the portfolio. That’s nearly twice the amount that he has, over the long term, committed to such defensive positions. His experience, concern for quality, and ability to shift has allowed his funds to weave their way through several tricky markets: over the past five years, his fund outperformed in all three quarters when the high yield group lost money and all four in which the broad bond market did. Indeed, he posted gains in three of the four quarters in which the bond market fell.

If you decide that you want to increase your exposure to such investments, there are few safer bets than Artisan. Artisan’s managers are organized into six autonomous teams, each with responsibility for its own portfolios and personnel. The teams are united by four characteristics:

  • pervasive alignment of interests with their shareholders – managers, analysts and directors are all deeply invested in their funds, the managers have and have frequently exercised the right to close funds and other manifestations of their strategies, the partners own the firm and the teams are exceedingly stable.
  • price sensitivity – Mr. Krug reports Artisan’s “firm believe that margins of safety should not be compromised,” which reflects the firm-wide ethos as well.
  • a careful, articulate strategy for portfolio weightings – the funds generally have clear criteria for the size of initial positions in the portfolio, the upsizing of those positions with time and their eventual elimination, and
  • uniformly high levels of talent – Artisan interviews a lot of potential managers each year, but only hires managers who they believe will be “category killers.” 

Those factors have created a tradition of consistent excellence across the Artisan family. By way of illustration:

  • Eleven of Artisan’s 14 retail funds are old enough to have Morningstar ratings. Eight of those funds have earned four or five stars. 
  • Ten of the 11 have been recognized as “Silver” or “Gold” funds by Morningstar’s analysts. 
  • Artisan teams have been nominated for Morningstar’s “manager of the year” award nine times in the past 15 years; they’ve won four times.

And none are weak funds, though some do get out of step with the market from time to time. That, by the way, is a good thing.

Bottom Line

In general, it’s unwise to make long-term decisions based on short-term factors. While valuation concerns are worrisome and might reasonably influence your decisions about new money in your portfolio, it makes no sense to declare high yield off limits because of valuation concerns any more than it would be to declare that equities or investment grade bonds (both of which might be less attractively valued than high income securities) have no place in your portfolio. Caution is sensible. Relying on an experienced manager is sensible. Artisan High Income is sensible. I’d consider it.

Fund website

Artisan High Income. There’s a nice six page research report, Recognizing Opportunities in Non-Investment Grade Credit, available there.

By way of disclosure: while the Observer has no financial relationship with or interest in Artisan, I do own shares of two of the Artisan funds (Small Cap Value ARTVX and International Value ARTKX) and have done so since the funds’ inception.

© Mutual Fund Observer, 2014. All rights reserved. The information here reflects publicly available information current at the time of publication. For reprint/e-rights contact us.

Zeo Short Duration Income (ZEOIX), July 2014

By David Snowball

At the time of publication of this profile, the fund was named Zeo Strategic Income.

Objective and strategy

Zeo seeks “income and moderate capital appreciation.” They describe themselves as a home for your “strategic cash holdings, with the goals of protecting principal and beating inflation by an attractive margin.” While the prospectus allows a wide range of investments, the core of the portfolio has been short-term high yield bonds, secured floating rate loans and cash. The portfolio is unusually compact for a fixed-income fund. As of June 2014, they had about 30 holdings with 50% of their portfolio in the top ten. Security selection combines top-down quantitative screens with a lot of fundamental research. The advisor consciously manages interest rate, default and currency risks. Their main tool for managing interest rate risk is maintaining a short duration portfolio. It’s typically near a one year duration though might be as high as four in some markets. They have authority to hedge their interest rate exposure but rather prefer the simplicity, transparency and efficiency of simply buying shorter dated securities.

Adviser

Zeo Capital Advisors of San Francisco. Zeo provides investment management services to the fund but also high net worth individuals and family offices through its separately managed accounts. They have about $146 million in assets under management, all relying on some variation of the strategy behind Zeo Strategic Income.

Managers

Venkatesh Reddy and Bradford Cook. Mr. Reddy is the founder of Zeo Capital Advisors and has been the Fund’s lead portfolio manager since inception. Prior to founding Zeo, Mr. Reddy had worked with several hedge funds, including Pine River Capital Management and Laurel Ridge Asset Management which he founded. He was also the “head of delta-one trading, and he structured derivative products as a portfolio manager within Bank of America’s Equity Financial Products group.” As a guy who specialized in risk management and long-tail risk, he was “the guy who put the hedging into the hedge fund.” Mr. Cook’s career started as an auditor for PricewaterhouseCoopers, he moved to Oaktree Capital in 2001 where he served as a vice president on their European high yield fund. He had subsequent stints as head of convertible strategies at Sterne Agee Group and head of credit research in the convertible bond group at Thomas Weisel Partners LLC before joining Zeo in 2012. Mr. Reddy has a Bachelor of Science degree in Computer Science from Harvard University and Mr. Cook earned a Bachelor of Commerce from the University of Calgary.

Strategy capacity and closure

The fund pursues “capacity constrained” strategies; that is, by its nature the fund’s strategy will never accommodate multiple billions of dollars. The advisor doesn’t have a predefined bright line because the capacity changes with market conditions. In general, the strategy might accommodate $500 million – $1 billion.

Management’s stake in the fund

As of the last Statement of Additional Information (April 2013), Mr. Reddy and Mr. Cook each had between $1 – 10,000 invested in the fund. The manager’s commitment is vastly greater than that outdated stat reveals. Effectively all of his personal capital is tied up in the fund or Zeo Capital’s fund operations. None of the fund’s directors had any investment in it. That’s no particular indictment of the fund since the directors had no investment in any of the 98 funds they oversaw.

Opening date

May 31, 2011.

Minimum investment

$5,000 and a 15 minute suitability conversation. The amount is reduced to $1,500 for retirement savings accounts. The minimum for subsequent investments is $1,000. That unusually high threshold likely reflects the fund’s origins as an institutional vehicle. Up until October 2013 the minimum initial investment was $250,000. The fund is available through Fidelity, Schwab, Scottrade, Vanguard and a handful of smaller platforms.

Expense ratio

The reported expense ratio is 1.50% which substantially overstates the expenses current investors are likely to encounter. The 1.50% calculation was done in early 2013 and was based on a very small asset base. With current fund assets of $104 million (as of June 2014), expenses are being spread over a far larger investor pool. This is likely to be updated in the next prospectus.

Comments

ZEOIX exists to help answer a simple question: how do we help investors manage today’s low yield environment without setting them up for failure in tomorrow’s rising rate one? Many managers, driven by the demands of “scalability” and marketing, have generated complex strategies and sprawling portfolios (PIMCO Short Term, for example, has 1500 long positions, 30 shorts and a 250% turnover) in pursuit of an answer. Zeo, freed of both of those pressures, has pursued a simpler, more elegant answer.

The managers look for good businesses that need to borrow capital for relatively short periods at relatively high rates. Their investable universe is somewhere around 3000 issues. They use quantitative screens for creditworthiness and portfolio risk to whittle that down to about 150 investment candidates. They investigate those 150 in-depth to determine the likelihood that, given a wide variety of stressors, they’ll be able to repay their debt and where in the firm’s capital structure the sweet spot lies. They end up with 20-30 positions, some in short-term bonds and some in secured floating-rate loans (for example, a floating rate loan at LIBOR + 2.8% to a distressed borrower secured by the borrower’s substantial inventory of airplane spare parts), plus some cash.

Mr. Reddy has substantial experience in risk management and its evident here.

This is not a glamorous niche and doesn’t promise glamorous returns. The fund returned 3.6% annually over its first three years with essentially zero (-0.01) correlation to the aggregate bond market. Its SMA composite has posted negative returns in six of 60 months but has never lost money in more than two consecutive months (during the 2011 taper tantrum). The fund’s median loss in a down month is 0.30%.

The fund’s Sharpe ratio, the most widely quoted calculation of an investment’s risk/return balance, is 2.35. That’s in the top one-third of one percent of all funds in the Morningstar database. Only 26 of 7250 funds can match or exceed that ratio and just six (including Intrepid Income ICMUX and the closed RiverPark Short Term High Yield RPHYX funds) have generated better returns.

Zeo’s managers, like RiverPark’s, think of the fund as a strategic cash management option; that is, it’s the sort of place where your emergency fund or that fraction of your portfolio that you have chosen to keep permanently in cash might reside. Both managers think of their funds as something appropriate for money that you might need in six months, but neither would be comfortable thinking of it as “a money market on steroids” or any such. Both are intensely risk-alert and have been very clear that they’d far rather protect principal than reach for yield. Nonetheless, some bumps are inevitable. For visual learners, here’s the chart of Zeo’s total returns since inception (blue) charted against RPHYX (orange), the average short-term bond fund (green) and a really good money market fund (Vanguard Prime, the yellow line).

ZEOIX

Bottom Line

All funds pay lip service to the claim “we’re not for everybody.” Zeo means it. Their reluctance to launch a website, their desire to speak directly with you before you invest in the fund and their willingness to turn away large investments (twice of late) when they don’t think they’re a good match with their potential investor’s needs and expectations, all signal an extraordinarily thoughtful relationship between manager and investor. Both their business and investment models are working. Current investors – about a 50/50 mix of advisors and family offices – are both adding to their positions and helping to bring new investors to the fund, both of which are powerful endorsements. Modestly affluent folks who are looking to both finish ahead of inflation and sleep at night should likely make the effort to reach out and learn more.

Fund website

Effectively none. Zeo.com contains the same information you’d find on a business card. (Yeah, I know.) Because most of their investors come through referrals and personal interactions it’s not a really high priority for them. They aspire to a nicely minimalist site at some point in the foreseeable future. Until then you’re best off calling and chatting with them.

Fund Fact Sheet

© Mutual Fund Observer, 2014. All rights reserved. The information here reflects publicly available information current at the time of publication. For reprint/e-rights contact us.

Dodge and Cox Global Bond (DODLX), June 2014

By David Snowball

Objective and strategy

DODLX is seeking a high rate of total return consistent with long-term preservation of capital. They’ll invest in both government and corporate securities, including those of firms domiciled in emerging markets. They begin with a set of macro-level judgments about the global economy, currency fluctuation and political conditions in various regions. The security selection process seems wide-ranging. They’re able to hedge currency, interest rate and other risks.

Adviser

Dodge & Cox was founded in 1930, by Van Duyn Dodge and E. Morris Cox. The firm, headquartered in San Francisco, launched its first mutual fund (now called Dodge & Cox Balanced) in 1931 then added four additional funds (Stock, Income, International and Global Stock) over the next 85 years. Dodge & Cox manages around $200 billion, of which $160 billion are in their mutual funds. The remainder is in 800+ separate accounts. Their funds are all low-cost, low-turnover, value-conscious and team-managed.

Managers

Dana Emery, Diana Strandberg, Thomas Dugan, James Dignan, Adam Rubinson, and Lucinda Johns.  They are, collectively, the Global Bond Investment Policy Committee. The fact that the manager bios aren’t mentioned, and then briefly, until page 56 of the prospectus but the SAI lists the brief bio of every investment professional at the firm (down to the assistant treasurer) tells you something about the Dodge culture. In any case, the members have been with D&C for 12 – 31 years and have a combined 116 years with the firm.

Strategy capacity and closure

Unknown, but the firm is prone to large funds. They’re also willing to close those funds and seem to have managed well the balance between performance and assets.

Management’s stake in the fund

Unknown since the fund opened after the reporting data in the SAI. That said, almost every director has a substantial personal investment in almost every fund, and every director (except a recent appointee, who has under $50,000 but has been onboard for just one year) has over $100,000 invested with the firm. Likewise every member of the Investment Committee invests heavily in every D&C; most managers have more than $1 million in each fund. The smallest reported holding is still over $100,000.

Opening date

December 5, 2012 if you count the predecessor fund, a private partnership, or May 1, 2014 if you date it from conversion to a mutual fund.

Minimum investment

$2,500 initial minimum investment, reduced to $1,000 for IRAs.

Expense ratio

0.45% on assets of $1.9 Billion, as of July 2023. 

Comments

Many people assume that the funds managed by venerable “white shoe” firms are automatically timid. They are not. They are frequently value-conscious, risk-conscious, tax-conscious and expense-conscious. They are frequently very fine. But they are not necessarily timid. Welcome to Dodge & Cox, a firm founded during the Great Depression to help the rich remain rich. They are, by all measures, an exemplary institution. Their funds are all run by low-profile teams of long-tenured professionals and they are inclined to avoid contact with the media. Their decision-making is legitimately collective and their performance is consistently admirable. Here’s the argument for owning what Dodge & Cox sells:

Name Ticker Inception M* Ranking M* Analyst Rating M* Expenses
Balanced DODBX 1931 Four star Gold Low
Global Stock DODWX 2008 Four star Gold Low
International Stock DODFX 2001 Four star Gold Low
Income DODIX 1989 Four star Gold Low
Stock DODGX 1965 Four star Gold Low

Here’s the argument against it:

    Assets, in billions Peer rank in 2008 M* risk Great Owl or not MFO Risk Group
Balanced DODBX 15 Bottom 11% High No Above average
Global Stock DODWX 5 n/a Above average No Average
International Stock DODFX 59 Bottom 18% Above Average to High No High
Income DODIX 26 Top third Average No High
Stock DODGX 56 Bottom 9% Above Average No High

The sum of the argument is this: D&C is independent. They have perspectives not shared by the vast majority of their competitors. When they encounter what they believe to be a fundamentally good idea, they move decisively on it. Sometimes their decisive moves are premature, and considerable dislocation can result. Dodge & Cox Global Fund started as a private partnership and documents filed with the SEC suggests that the fund had a single shareholder. As a result, the portfolio could be quite finely tuned to the risk tolerance of its investors. The fund’s current portfolio contains 25.4% emerging markets bonds. It has 14% of its money in Latin American bonds (the average global bond fund has 1%) and 5% in African bonds (versus 1%). 59% of the bond is rated by Moody’s as Baa (lower medium-grade bonds) or lower. Those imply a different risk-return profile than you will find in the average global bond fund. Why worry about a global bond fund at all? Four reasons come to mind:

  1. International bonds now represent the world’s largest asset class: about 32% of the total value of the global stock and bond market, up from 19% of the global market in 2000.

  2. The average American investor has very limited exposure to non-U.S. bonds. Vanguard’s analysis (linked below) concludes “ U.S. investors generally have little, if any, exposure to foreign bonds in their portfolios.”

  3. The average American investor with non-U.S. bond exposure is likely exposed to the wrong bonds. Both index funds and timid managers replicate the mistakes embodied in their indexes: they weight their portfolios by the amount of debt issuance rather than by the quality of issuer. What does that mean? It means that most bond indexes (hence most index and closet-index funds) give the largest weighting to whoever issues the greatest volume of debt, rather than to the issuers who are most capable of repaying that debt promptly and in full.

  4. Adding “the right bonds” to your portfolio will fundamentally improve your portfolio’s risk/return profile. A 2014 Vanguard study on the effects of increasing international bond exposure reaches two conclusions: (1) adding unhedged international bonds increases volatility without offsetting increase in returns because it represents a simple currency bet but (2) adding currency-hedged international bond exposure decreases volatility in almost all portfolios. They report:

    It is interesting that, once the currency risk is removed through hedging, the least-volatile portfolio is 42% U.S. stocks, 18% international stocks, and 40% international bonds. Further, with bond currency risk negated, the inclusion of international bonds has relatively little effect on the allocation decision regarding international stocks. In other words, a 30% allocation to international stocks within the equity portion of the portfolio (18% divided by 60%) remains optimal for reducing volatility over the period analyzed, regardless of the level of international bond allocation.

    This makes it easier for investors to assess the impact of adding international bonds to a portfolio. In addition, we find that hedged international bonds historically have offered consistent risk-reduction benefits: Portfolio volatility decreases with each incremental allocation to international bonds.

    The greatest positive effect they found was from the addition of emerging markets bonds.

Bottom Line

The odds favor the following statement: DODLX will be a very solid long-term core holding. The managers’ independence from the market, but dependence on D&C’s group culture, will occasionally blow up. If you check your portfolio only once every three-to-five years, you’ll be very satisfied with D&C’s stewardship of your money.

Fund website

Dodge & Cox Global Bond Fund. For those interested in working through the details of the D&C Global Bond Fund L.L.C., the audited financials are available through the SEC archive. © Mutual Fund Observer, 2014. All rights reserved. The information here reflects publicly available information current at the time of publication. For reprint/e-rights contact us.

Guinness Atkinson Dividend Builder (GAINX), March 2014

By David Snowball

*This fund has been converted into an ETF (February 2021)*

Objective and Strategy

Guinness Atkinson Inflation Managed Dividend seeks consistent dividend growth at a rate greater than the rate of inflation by investing in a global portfolio of about 30 dividend paying stocks. Stocks in the portfolio have survived four screens, one for business quality and three for valuation. They are:

  1. They first identify dividend-paying companies that have provided an inflation-adjusted cash flow return on investment of at least 10% in each of the last 10 years. (That process reduces the potential field from 14,000 companies to about 400.) That’s the “10 over 10” strategy that they refer to often.
  2. They screen for companies with at least a moderate dividend yield, a history of rising dividends, low levels of debt and a low payout ratio.
  3. They do rigorous fundamental analysis of each firm, including reflections on macro issues and the state of the company’s business.
  4. They invest in the 35 most attractively valued stocks that survived those screens and weight each equally in the portfolio.

Active share is a measure of a portfolio’s independence, the degree to which is differs from its benchmark. In general, for a fund with a large cap bias, a value above 70 is desirable. The most recent calculation (February 2014) places this fund’s active share at 92.

Adviser

Guinness Atkinson Asset Management. The firm started in 1993 as the US arm of Guinness Flight Global Asset Management and their first American funds were Guinness Flight China and Hong Kong (1994) and Asia Focus (1996). Guinness Flight was acquired by Investec, then Tim Guinness and Jim Atkinson’s acquired Investec’s US funds business to form Guinness Atkinson. Their London-based sister company is Guinness Asset Management which runs European funds that parallel the U.S. ones. The U.S. operation has about $375 million in assets under management and advises the eight GA funds.

Manager

Ian Mortimer and Matthew Page. Dr. Mortimer joined GA in 2006 and also co-manages the Global Innovators (IWIRX) fund. Prior to joining GA, he completed a doctorate in experimental physics at the University of Oxford. Mr. Page joined GA in 2005 and working for Goldman Sachs. He earned an M.A. from Oxford in 2004. The guys also co-manage European versions of their funds including the Dublin-based version of this one, called Guinness Global Equity Income.

Strategy capacity and closure

About $1 billion. The smallest stock the fund will invest in is about $1 billion. With a compact, equal-weighted portfolio, having much more than $1 billion in the strategy would impede their ability to invest in their smallest targeted names.

Management’s stake in the fund

It’s a little complicated. The managers, both residents of England, do not own shares of the American version of the fund but both do own shares of the European version. That provides the same portfolio, but a different legal structure and far better tax treatment. Matt avers “it’s most of my pension pot.” Corporately Guinness Atkinson has about $180,000 invested in the fund and, separately, President Jim Atkinson appears to be the fund’s largest shareholder

Opening date

March 30, 2012. The European version of the fund is about a year older.

Minimum investment

$10,000, reduced to $5,000 for IRAs. There are lower minimums at some brokerages. Schwab, for example, has the fund NTF for $2500 for regular accounts and $1000 for IRAs. Fidelity requires $2500 for either sort of account.

Expense ratio

0.68% on assets of $3 million (as of February 2014). That’s competitive with the ETFs in the same space and lower than the ETNs.

Comments

There are, in general, two flavors of value investing: buy cigar butts on the cheap (wretched companies whose stocks more than discount their misery) or buy great companies at good prices. GAINX is firmly in the latter camp. Many investors share their enthusiasm for the sorts of great firms that Morningstar designates as having “wide moats.”

The question is: how can we best determine what qualifies as a “great company”? Most investors, Morningstar included, rely on a series of qualitative judgments about the quality of management, entry barriers, irreproducible niches and so on. Messrs. Mortimer and Page start with a simpler, more objective premise: great companies consistently produce great results. They believe the best measurement of “great results” is high and consistent cash flow return on investment (CFROI). In its simplest terms, CFROI asks “when a firm invests, say, a million dollars, how much additional cash flow does that investment create?” Crafty managers like cash flow calculations because they’re harder for firms to manipulate than are the many flavors of earnings. One proof of its validity is the fact that a firm’s own management will generally use CFROI – often called the internal rate of return – to determine whether a project, expansion or acquisition is worth undertaking. If you invest a million and get $10,000 in cash flows the first year, your CFROI is 1%. At that rate, it would take the firm a century to recoup its investment.

The GAINX managers set a high and objective initial bar: firms must be paying a dividend and must have a CFROI greater than 10% in each of the past 10 years. Only about 3% of all publicly-traded companies clear that hurdle. Cyclical firms whose fortunes soar and dive disappear from the pool, as well as many utilities and telecomm firms whose “excess” returns get regulated away. More importantly, they screen out firms whose management do not consistently and substantially add demonstrable value. That 3% are, by their standards, great companies.

One important signal that they’ve found a valid measure of a firm’s quality is the stability of the list. About 95% of the stocks that qualify this year will qualify next year as well, and about 80% will continue to qualify four years hence. This helps contribute to the fund’s very low turnover rate, 13%.

Because such firms tend to see their stocks bid up, the guys then apply a series of valuation and financial stability screens as well as fundamental analyses of the firm’s industry and challenges. In the end they select the 30-35 most attractively valued names in their pool. That value-consciousness led them to add defense contractors when they hit 10 year valuation lows in the midst of rumors of defense cutbacks and H&R Block when the specter of tax simplification loomed. Overall, the portfolio sells at about a 9% discount to the MSCI World index despite holding higher-quality firms.

The fund has done well since inception: from inception through December 30, 2013, $10,000 in GAINX would have grown to $13,600 versus $12,900 in its average global stock peer. In that same period the fund outperformed its peers in five of six months when the peer group lost money.

The fund underperformed in the first two months of 2014 for a surprising reason: volatility in the emerging markets. While the fund owns very few firms domiciled in the emerging markets, about 25% of the total revenues of all of their portfolios firms are generated in the emerging markets. That’s a powerful source of long-term growth but also a palpable drag during short-term panics; in particular, top holding Aberdeen Asset Management took a huge hit in January because of the performance of their emerging markets investments.

Bottom Line

The fund strives for two things: investments in great firms and a moderate, growing income stream (current 2.9%) that might help investors in a yield-starved world. Their selection criteria strike us as distinctive, objective, rigorous and reasonable, giving them structural advantages over both passive products and the great majority of their active-managed peers. While no investment thrives in every market, this one has the hallmarks of an exceptional, long-term holding. Investors worried about the fund’s tiny U.S. asset base should take comfort from the fact that the strategy is actually around $80 million when you account for the fund’s Dublin-domiciled version.

Fund website

Guinness Atkinson Inflation-Managed Dividend. Folks interested in the underlying strategy might want to read their white paper, 10 over 10 Investment Strategy. The managers offered a really nice portfolio update, in February 2014, for their European investors.

© Mutual Fund Observer, 2014. All rights reserved. The information here reflects publicly available information current at the time of publication. For reprint/e-rights contact us.

Driehaus Emerging Markets Small Cap Growth Fund (DRESX), March, 2014

By David Snowball

Objective and strategy

Driehaus Emerging Markets Small Cap Growth Fund seeks superior risk-adjusted returns over full market cycles relative to those of the MSCI Emerging Markets Small Cap Index. The managers combine about 100 small cap names with an actively-managed portfolio hedge. They create the hedge by purchasing sector, country, or broad market index options, generally. 

Adviser

Driehaus Capital Management is a privately-held investment management firm based in Chicago.  They have about $12 billion in assets under management as of January 31, 2014. The firm manages five broad sets of strategies (global, emerging markets, and U.S. growth equity, hedged equity, and alternative investment) for a global collection of institutional investors, family offices, and financial advisors. Driehaus also advises the 10 Driehaus funds which have about $8 billion in assets between them, more than half of that in Driehaus Active Income (LCMAX, closed) and 90% in three funds (LCMAX, Driehaus Select Credit DRSLX, also closed and Driehaus Emerging Markets Growth DREGX).

Managers

Chad Cleaver and Howard Schwab. Mr. Cleaver is the lead manager on this fund and co-manager for the Emerging Markets Growth strategy. He’s responsible for the strategy’s portfolio construction and buy/sell decisions. He began his career with the Board of Governors of the Federal Reserve System and joined Driehaus Capital Management in 2004.  Mr. Schwab is the lead portfolio manager for the Emerging Markets Growth strategy and co-manager here and with the International Small Cap Growth strategy. In his role as lead portfolio manager, Mr. Schwab is responsible for the strategy’s portfolio construction. As co-manager he oversees the research team and evaluates investment ideas. He is also involved in analyzing macro-level trends and associated market risks. Mr. Schwab joined Driehaus Capital Management in 2001. Both of the managers have undergraduate degrees from strong liberal arts colleges, as well as the requisite graduate degrees and certifications.

Strategy capacity and closure

Between $600 – 800 million, at which point the firm would soft-close the fund as they’ve done to several others. DRESX is the only manifestation of the strategy.

Active Share

Active share is a measure of a portfolio’s independence, the degree to which is differs from its benchmark. The combination of agnosticism about their benchmark, fundamental security selection that often identifies out-of-index names and their calls typically results in a high active share. The most recent calculation (February 2014) places it at 96.4.

Management’s stake in the fund

Each of the managers has invested between $100,000 and $500,000 in the fund. They have a comparable amount invested in the Emerging Markets Growth Fund (DREGX), which they also co-manage. As of March 2013, insiders own 23% of the fund shares, including 8.4% held by the Driehaus Family Partnership.

Opening date

The fund began life on December 1, 2008 as Driehaus Emerging Markets Small Cap Growth Fund, L.P. It converted to a mutual fund on August 22, 2011.

Minimum investment

$10,000, reduced to $2000 for IRAs.

Expense ratio

1.25%, after waivers, on assets of $109.5 million (as of July 2023). 

Comments

Emerging markets small cap stocks are underappreciated. The common stereotype is just like other emerging markets stocks, only more so: more growth, more volatility, more thrills, more chills.

That stereotype is wrong. Stock ownership derives value from the call it gives you on a firm’s earnings, and the characteristic of EM small cap earnings are fundamentally and substantially different from those of larger EM firms. In particular, EM small caps represent, or offer:

Different countries: not all countries are equally amenable to entrepreneurship. In Russia, for instance, 60% of the market capitalization is in just five large firms. In Brazil, it’s closer to 25%.

Different sectors: small caps are generally not in sectors that require huge capital outlays or provide large economies of scale. They’re substantially underrepresented in the energy and telecom sectors but overrepresented in manufacturing, consumer stocks and health care.

More local exposure: the small cap sectors tend to be driven by relatively local demand and conditions, rather than global macro-factors. On whole EM small caps derive about 24% of their earnings from international markets (including their immediate neighbors) while EM large caps have a 50% greater exposure. As a result, about 20% of the volatility in global cap small stocks is explained by macro factors, compared to 33% for all global stocks.

Higher dividends: EM small caps, as a group, pay about 3.2% while large caps pay 3.0%.

Greater insider ownership: about 44% of the stock for EM small caps is held by corporate insiders against 34% for larger EM stocks. The more important question might be who doesn’t own EM small caps. “State-owned enterprises” are more commonly larger firms whose financial decisions may be driven more by the government’s needs than the private investors’.  Only 2% of the stock of EM small caps is owned by local governments.

Historically higher returns: from 2001-2013, EM small caps returned 12.7% annually versus 11.1% for EM large caps and 3.7% for US large caps.

But, oddly, slower growth (11.2% EPS growth versus 12.2% for all EM) and comparable volatility (26.1 SD versus 24.4 for large caps).

The data understates the magnitude of those differences because of biases built into EM indexes.  Those indexes are created to support exchange-traded and other passive investment products (no one builds indexes just for the heck of it). In order to be useful, they have to be built to support massive, rapid trades so that if a hedge fund wants to plunk a couple hundred million into EM small caps this morning and get back out in the afternoon, it can. To accommodate that, indexes build in liquidity, scalability and tradeability screens. That means indexes (hence ETFs) exclude about 600 publicly-traded EM small caps – about 25% of that universe – and those microcap names are among the firms least like the larger-cap indexes.

The downfall of EM small caps comes as a result of liquidity crises: street protests in Turkey, a corporate failure in Mexico, a somber statement by a bank in Malaysia and suddenly institutional investors are dumping baskets of stocks, driving down the good with the bad and driving small stocks down most of all. Templeton Emerging Markets Small Cap (TEMMX), for example, lost 66% of its value during the 2007-09 crash.

Driehaus thinks it has a way to harness the substantial and intriguing potential of EM small caps while buffering a chunk of the downside risk. Their strategy has two elements.

They construct a long portfolio of about 100 stocks.  In general they’re looking for firms at “growth inflection points.”  The translation is stocks where a change in the price trend is foreseeable. They often draw on insights from behavioral finance to identify securities mispriced because of investor biases in reacting to changes in the magnitude, acceleration or duration of growth prospects.

They hedge the portfolio with options. They call purchase or write options on ETFs, or short ETFs when no option is available. The extent of the hedge varies with market conditions; a 10-40% hedge would be in the normal range. In general they attempt to hedge country, sector and market risk. They can use options strategies offensively but mostly they’re for defense.

The available evidence suggests their strategy works well. Really well.  Really, really well.  Over the past three years (through 12/30/13), the fund has excelled in all of the standard risk metrics when benchmarked against the MSCI Emerging Markets Small Cap Index.


Driehaus

MSCI EM Small Cap

Beta

0.73

1.00

Standard deviation

16.2

19.1

Downside deviation

11.9

15.0

Downside capture

56.4%

100%

# negative months

11

18

The strategy of winning-by-not-losing has been vastly profitable over the past three, volatile years.  Between January 2011 – December 2013, DRESX returned 7.4% annually while its EM small cap peers lost 3.2% and EM stocks overall dropped 1.7% annually.

The universal question is, “but aren’t there cheaper, passive alternatives?”  There are four or five EM small cap ETFs.  They are, on whole, inferior to Driehaus. While they boast lower expenses, they’re marred by inferior portfolios designed for tradeability rather than value, and inferior performance.  Here’s the past three years of DRESX (the blue line) and the SPDR, WisdomTree and iShares ETFs:

dresx chart

Bottom Line

For long-term investors, substantial emerging markets exposure makes sense. Actively managing that investment to avoid the substantial, inherent biases which afflict EM indexes, and the passive products built around them, makes sense. In general, that means that the most attractive corner of the EM universe – measured by both fundamentals and diversification value – are smaller cap stocks.  There are only 18 funds oriented to small- and mid-cap EM stocks and just seven true small caps.  Driehaus’s careful portfolio construction and effective hedging should put them high on any EM investor’s due diligence list. They’ve done really first-rate work. 

Fund website

The Driehaus Emerging Markets Small Cap Growth homepage links to an embarrassing richness of information on the fund, its portfolio and its performance. The country-by-country attribution tables are, for the average investor, probably a bit much but the statistical information is unmatched.

Much of the information on EM small caps as a group was presented in two MSCI research papers, “Adding Global Small Caps: The New Investable Equity Opportunity Set?” (October 2012) and “Small Caps – No Small Oversight: Institutional Investors and Global Small Cap Equities” (March 2012). Both are available from MSCI but require free registration and I felt it unfair to link directly to them. In addition, Advisory Research has a nice summary of the EM small cap distinctions in a short marketing piece entitled “Investing in value oriented emerging market small cap and mid cap equities” (October 2013). 

© Mutual Fund Observer, 2014. All rights reserved. The information here reflects publicly available information current at the time of publication. For reprint/e-rights contact us.

Grandeur Peak Emerging Markets Opportunities (formerly Grandeur Peak Emerging Opportunities), (GPEOX), February 2014

By David Snowball

At the time of publication, this fund was named Grandeur Peak Emerging Opportunities.

Objective and Strategy

Emerging Opportunities pursues long-term capital growth primarily by investing in a small and micro-cap portfolio of emerging and, to a lesser extent, frontier market stocks. Up to 90% of the fund might normally be invested in microcaps (stocks with market cap under $1 billion at the time of purchase), but they’re also allowed to invest up to 35% in stocks over $5 billion. The managers seek high quality companies that they place in one of three classifications:

Best-In-Class Growth Companies: fast earnings growth, good management, strong financials. The strategy is to “find them small and undiscovered; buy and hold” until the market catches on. In the interim, capture the compounded earnings growth.

Fallen Angels: good growth companies that hit “a bump in the road” and are priced as value stocks. The strategy is to buy them low and hold through the recovery.

Stalwarts: basically, blue chip mid-cap stocks. Decent but not great growth, great financials, and the prospect of dividends or stock buy-backs. The strategy is to buy them at a fair price, but be careful of overpaying since their growth may be decelerating.

The stocks in GPEOX represent the emerging and frontier stocks in the flagship Grandeur Peak Global Reach (GPROX) portfolio.

Adviser

Grandeur Peak Global Advisors is a small- and micro-cap focused global equities investment firm, founded in mid-2011, and comprised of a very experienced and collaborative investment team that worked together for years managing some of the Wasatch funds. They advise four Grandeur Peak funds and one “pooled investment vehicle.” The adviser passed $1 billion in assets under management in July, 2013.

Managers

Blake Walker and Spencer Stewart, benignly overseen by Robert Gardiner. Blake Walker is co-founder of and Chief Investment Officer for Grandeur Peak. Mr. Walker was a portfolio manager for two funds at Wasatch Advisors. Mr. Walker joined the research team at Wasatch Advisors in 2001 and launched his first fund, the Wasatch International Opportunities Fund (WAIOX) in 2005. He teamed up with Mr. Gardiner in 2008 to launch the Wasatch Global Opportunities (WAGOX). Mr. Stewart has been a senior research analyst at Grandeur Peak Global Advisors since 2011. He joined Grandeur Peak from Sidoti & Company, a small-cap boutique in New York and had previously worked at Wasatch, which his father founded. Mr. Gardiner is designated as an “Advising Manager,” which positions him to offer oversight and strategy without being the day-to-day guy. Prior to founding Grandeur Peak, he managed or co-managed Wasatch Microcap (WMICX), Small Cap Value (WMCVX) and Microcap Value (WAMVX, in which I own shares). They’re supported by four Senior Research Associates.

Strategy capacity and closure

$200 million. Grandeur Peak specializes in global small and micro-cap investing. Their estimate, given current conditions, is that they could effectively manage about $3 billion in assets. They could imagine running seven distinct small- to micro-cap funds and close all of them (likely a soft close) when the firm’s assets under management reach about $2 billion. The adviser has target closure levels for each current and planned fund.

Management’s stake in the fund

None yet disclosed, but the Grandeur Peak folks tend to invest heavily in their funds.

Opening date

December 16, 2013.

Minimum investment

$2,000, reduced to $1,000 for an account established with an automatic investment plan.

Expense ratio

1.78% for Investor class shares on assets of $452 million, as of July 2023. 

Comments

There’s little to be said about Emerging Opportunities but much to be said for it.

Grandeur Peak operates a single master profile, which is offered to the public through their Global Reach fund. The other current and pending Grandeur Peak funds are essentially just subsets of that portfolio. Emerging Opportunities are the EM and frontier stocks from that portfolio. While there are 178 diversified emerging markets funds, only 18 invest primarily in small- and mid-cap stocks. Of the 18 smid-cap funds, only two end up in Morningstar’s “small cap” style box (Templeton Emerging Markets Small Cap TEMMX is the other). Of the two true EM small caps, only one will give you significant exposure to both small and micro-cap stocks (TEMMX, still open with a half billion in assets, higher expenses and a front-load, is 14% microcap while GPEOX is 44% microcap).

That’s what we can say about GPEOX. What we can say for it is this: the fund is managed by one of the most experienced, distinguished and consistently successful small cap teams around. The general picture of investing with Grandeur Peak looks rather like this:

GPGOX snip

In general, past performance is a rotten way of selecting an investment. When that performance is generated consistently, across decades, categories and funds, by the same team, it strikes me as rather more important.

Their investable universe is about 30,000 publicly-traded stocks, most particularly small and microcap, from around the globe, many with little external analyst coverage. The plan is for Global Reach to function as a sort of master portfolio, holding all of the stocks that the firm finds, at any given point, to be compelling. They estimate that that will be somewhere between 300 and 500 names. Those stocks will be selected based on the same criteria that drove portfolio construction at Global Opportunities and International Opportunities and at the Wasatch funds before them. Those selection criteria drive Grandeur Peak to seek out high quality small companies with a strong bias toward microcap stocks. This has traditionally been a distinctive niche and a highly rewarding one. Each of their three earlier funds boasts their categories’ the smallest market caps by far and, in first 30 months of existence, some of their category’s strongest returns. The pattern seems likely to repeat.

Are there reasons for concern? Three come to mind.

The characteristics of the market are largely unknown. In general, EM small caps offer greater growth prospects, less efficient pricing and greater diversification benefits than do other EM stocks. The companies’ prospects are often more tied to local economies and less dependent on commodity exports to the developed world. The three ETFs investing in such stocks have had solid to spectacular relative performance. That said, there’s a very limited public track record for portfolios of such stocks, with the oldest ETF being just five years old and the only active fund being seven years old. Investing here represents an act of faith as much as a rational calculation.

Managing seven funds could, eventually, stretch the managers’ resources. Cutting against this is the unique relationship of Global Reach to its sister portfolios. The great bulk of the research effort will manifest itself in the Global Reach portfolio; the remaining funds will remain subsidiary to it. That is, they will represent slices of the larger portfolio, not distinct burdens in addition to it.

The fund’s expense ratios are structurally, persistently high. The fund will charge 1.95%, below the fees for many EM smid caps, but substantially above the 1.60% charged by the average no-load EM fund. The management fee alone is 1.35%. Cutting against that, of course, is the fact that Mr. Gardiner has for nearly three decades now, more than earned the fees assessed to his investors. It appears that you’re getting more than what you are paying for; while the fee is substantial, it seems to be well-earned.

Bottom Line

This is a very young, but very promising fund. It is also tightly capacity constrained, so that it is likely to close early in 2014 despite Grandeur Peak’s decision not to publicize the fund at launch. For investors interested in a portfolio of high-quality, growth-oriented stocks from the fastest growing markets, there are few more-attractive opportunities available.

Fund website

Grandeur Peak Emerging Opportunities

Disclosure

By way of disclosure, while the Observer has no financial relationship with or interest in Grandeur Peak, I do own shares of GPEOX in my Roth IRA, along with shares of Wasatch Microcap Value (WAMVX) which Mr. Gardiner once managed.

© Mutual Fund Observer, 2014. All rights reserved. The information here reflects publicly available information current at the time of publication. For reprint/e-rights contact us.

RiverPark Strategic Income Fund (RSIVX), January 2014

By David Snowball

Objective and strategy

The fund is seeking high current income and capital appreciation consistent with the preservation of capital. The manager does not seek the highest available return.  He’s pursuing 7-8% annual returns but he will not “reach for returns” at the risk of loss of capital.  The portfolio will generally contain 30-40 fixed income securities, all designated as “money good” but the majority also categorized as high-yield.  There will be limited exposure to corporate debt in other developed nations and no direct exposure to emerging markets.  While the manager has the freedom to invest in equities, they are unlikely ever to occupy a noticeable slice of the portfolio. 

Adviser

RiverPark Advisors, LLC.   RiverPark was formed in 2009 by former executives of Baron Asset Management.  The firm is privately owned, with 84% of the company being owned by its employees.  They advise, directly or through the selection of sub-advisers, the seven RiverPark funds.

Manager

David K. Sherman, president and founder of the subadvisor, Cohanzick Management, LLC. Mr. Sherman founded Cohanzick in 1996 after a decade spent in various director and executive positions with Leucadia National Corporation. Mr. Sherman has a B.S. in Business Administration from Washington University and an odd affection for the Philadelphia Eagles. He is also the manager of the recently soft-closed RiverPark Short Term High Yield Fund (RPHYX).

Strategy capacity and closure

The strategy has a capacity of about $2 billion but its execution requires that the fund remain “nimble and small.”  As a result, management will consider asset levels and fund flows carefully as they move in the vicinity of their cap.

Management’s stake in the fund

Collectively the professionals at RiverPark and Cohanzick have invested more than $3 million in the fund, including $2.5 million in “seed money” from Mr. Sherman and RiverPark’s president, Morty Schaja. Both men are increasing their investment in the fund with a combination of “new money” and funds rebalanced from other investments.

Opening date

September 30, 2013

Minimum investment

$1,000 minimum initial investment for retail shares. There is no minimum for subsequent investments if payment is mailed by check; otherwise the minimum is $100.

Expense ratio

1.25% after waivers of 0.40% on assets of $116 million (as of December, 2013).

Comments

RiverPark Strategic Income has a simple philosophy, an understandable strategy and a hard-to-explain portfolio.  The combination is, frankly, pretty compelling.

The philosophy: don’t get greedy.  After a quarter century of researching and investing in distressed, high-yield and special situations fixed income securities, Mr. Sherman has concluded that he can either make 7% with minimal risk of permanent loss, or he could shoot for substantially higher returns at the risk of losing your money.  He has consistently and adamantly chosen the former.

The strategy: invest in “money good” fixed-income securities.  “Money good” securities are where the manager is very sure (very, very sure) that he’s going to get 100% of his principal and interest back, no matter what happens.  That means 100% if the market tanks.  And it means a bit more than 100% if the issuer goes bankrupt, since he’ll invest in companies whose assets are sufficient that, even in bankruptcy, creditors will eventually receive their principal plus their interest plus their interest on their interest.

Such securities take a fair amount of time to ferret out and might occur in relatively limited quantities, so that some of the biggest funds simply cannot pursue them.  But, once found, they generate an annuity-like stream of income for the fund regardless of market conditions.

The portfolio: in general, the fund is apt to dwell somewhere near the border of short- and intermediate-term bonds.  The fact that shorter duration bonds became the investment du jour for many anxious investors in 2013 meant that they were bid up to unreasonable levels, and Mr. Sherman found greater value in 3- to 5-year issues.

The manager has a great deal of flexibility in investing the fund’s assets and often finds “orphaned” issues or other special situations which are difficult to classify.  As he and RiverPark’s president, Morty Schaja, reflected on the composition of the portfolio, they imagined six broad categories that might help investors better understand what the fund owns.  They are:

  1. Short Term High Yield overlap – securities that are also holdings in the RiverPark Short Term High Yield Fund.
  2. Buy and hold – securities that hold limited credit risk, provide above market yields and might reasonably be held to redemption.
  3. Priority-based – securities from issuers who are in distress, but which would be paid off in full even if the issue were to go bankrupt.  Most investors would instinctively avoid such issues but Mr. Sherman argues that they’re often priced at a discount and are sufficiently senior in the capital structure that they’re safe so long as an investor is willing to wait out the bankruptcy process in exchange for receiving full recompense. An investor can, he says, “get paid a lot of money for your willingness to go through the process.” Cohanzick calls these investments “above-the-fray securities of dented credits”.
  4. Off the beaten path – securities that are not widely-followed and/or are less liquid. These might well be issues too small or too inconvenient for a manager responsible for billions or tens of billions of assets, but attractive to a smaller fund.
  5. Rate expectations – securities that present opportunities because of rising or falling interest rates.  This category would include traditional floating rate securities and opportunities that present themselves because of a difference between a security’s yield to maturity and yield to worst.
  6. Other – which is all of the … other stuff.

Fixed-income investing shouldn’t be exciting.  It should allow you to sleep at night, knowing that your principal is safe and that you’re earning a real return – something greater than the rate of inflation.  Few fixed-income funds lately have met those two expectations and the next few years are not likely to be kind to traditional fixed-income funds.  RiverPark’s combination of opportunism and conservatism, illustrated in the return graph below, offer a rare and appealing combination.

rsivx

Bottom Line

In all honesty, about 80% of all mutual funds could shut their doors today and not be missed.  They thrive by never being bad enough to dump, nominally active funds whose strategy and portfolio are barely distinguishable from an index. The mission of the Observer is to help identify the small, thoughtful, disciplined, active funds whose existence actually matters.

David Sherman runs such funds. His strategies are labor-intensive, consistent, thoughtful, disciplined and profitable.  He has a clear commitment to performance over asset gathering, and to caution over impulse.  Folks navigating the question “what makes sense in fixed-income investing these days?”  owe it to themselves to learn more about RSIVX.

Fund website

RiverPark Funds

RiverPark Strategic Income Fund

Fact Sheet

Disclosure

While the Observer has neither a stake in nor a business relationship with either RiverPark or Cohanzick, both individual members of the Observer staff and the Observer collectively have invested in RPHYX and/or RSIVX.

© Mutual Fund Observer, 2014. All rights reserved. The information here reflects publicly available information current at the time of publication. For reprint/e-rights contact us.

T. Rowe Price Global Allocation (RPGAX), December 2013

By David Snowball

Objective and Strategy

The fund’s objective is to seek long-term capital appreciation and income by investing in a broadly diversified global portfolio of investments, including U.S. and international stocks, bonds, and alternative investments.  The plan is to add alpha through a combination of active asset allocation and individual security selection.  Under normal conditions, the fund’s portfolio will consist of approximately 60% stocks; 30% bonds and cash; and 10% alternative investments.  Both the equity and fixed-income sleeves will have significant non-U.S. exposure.

Adviser

T. Rowe Price. Price was founded in 1937 by Thomas Rowe Price, widely acknowledged as “the father of growth investing.” The firm now serves retail and institutional clients through more than 450 separate and commingled institutional accounts and more than 90 stock, bond, and money market funds. As of September 2013, the firm managed approximately $650 billion for more than 11 million individual and institutional investor accounts.

Manager

Charles M. Shriver, who technically heads the fund’s Investment Advisory Committee.  As the chair he has day-to-day responsibility for managing the fund’s portfolio and works with the other fund managers on the committee to develop the fund’s investment program. Mr. Shriver joined Price in 1991 and began working as an investment professional in 1999.  In May 2011 he became the lead manager for Price’s Balanced, Personal Strategy and Spectrum Funds (except for Spectrum International, which he picked up in May 2012).  Stefan Hubrich, Price’s director of asset allocation research, will act as the associate manager.

Strategy capacity and closure

Given the breadth of the fund’s investment universe (all publicly-traded securities worldwide plus a multi-strategy hedge), Price believes there’s no set limit.  They do emphasize their documented willingness to close funds when either the size of the fund or the rate of inflows makes the strategy unmanageable.

Management’s Stake in the Fund

Not yet available.  Mr. Schriver has a total investment of between $500,000 and $1,000,000 in the other funds he helps manage.

Opening date

May 28, 2013.

Minimum investment

$2,500, reduced to $1,000 for IRAs.

Expense ratio

0.87% on assets of $1 Billion, as of July 2023.  

Comments

It’s no secret that the investing world is unstable, now more than usual. Governments, corporations and individuals in the developed world are deeply and systemically in debt. There’s anxiety about the consequences of the Fed’s inevitable end of their easy-money policy; one estimate suggests that a one percentage point rise in the interest rate could cost investors nearly $2.5 trillion.  Analysts foresee the end of the 30 year bull market in bonds, with some predicting 20 lean years and others forecasting The Great Rotation into income-producing equity.  The great drivers of economic growth in the developed world seem to be lagging, China might be restructuring and the global climate is destabilizing with, literally, incalculable results.

Where, in the midst of all that, does opportunity lie?

One answer to the question, “what should you do when you don’t know what to do?” is “do nothing.”  The other answer is “try a bit of everything!”  RPGAX represents an attempt at the latter.

This is designed to be Price’s most flexible, broadly diversified fund.  Its strategic design incorporates nearly 20 asset classes and strategies.  Those will include, including:

  • both large and small-cap domestic and developed international equities
  • both value and growth global equities
  • emerging market equities
  • international bonds
  • short-duration TIPS
  • high yield, floating rate
  • emerging market local currency bonds
  • a multi-strategy hedge fund or two.

Beyond that, they can engage in currency hedging and index call writing to manage risk and generate income that’s uncorrelated to the stock and bond markets.

In short: a bit of everything with a side of hedging, please.

This fund is expected to have a risk profile akin to a balanced portfolio made up of 60% stocks and 40% bonds.

It’s entirely likely that the fund will succeed.  Price has a very good record in assembling asset allocation products.  T. Rowe Price Retirement series, for instance, is recognized as one of the industry’s best, most thoughtful options.  Where other firms started with off-the-cuff estimations of appropriation asset mixes, Price started by actually researching how people lived in retirement and built their funds backward from there.

Their research suggested we spent more in retirement than we anticipate and risk outliving their savings. As a result, they increased both the amount of equity exposure at each turning point and also the exposure to risky sub-classes.  So it wasn’t just “more equity,” it will “more international small cap.”  Both that careful design and the fund’s subsequent performance earned the series of “Gold” rating from Morningstar. 

In 2013 they realized that some investors weren’t comfortable with the extent of equity exposure, and created an entirely separate set of retirement funds with a milder risk profile.  That sort of research and vigilance permeates Price’s culture.

It’s also reflected in the performance of the other funds that Mr. Shriver manages.  They share three characteristics: they are carefully designed, that are uniformly solid and dependable, but they are not designed as low risk funds. 

Morningstar’s current star ratings illustrate the second point:

Star rating:

3 Year

5 Year

10 Year

Overall

Balanced RPBAX

4

4

4

4

Personal Strategy Balanced TRPBX

4

4

4

4

Personal Strategy Growth TRSGX

5

5

4

5

Personal Strategy Income PRSIX

4

4

4

4

Spectrum Growth PRSGX

3

3

4

3

Spectrum Income RPSIX

3

3

3

3

Spectrum International PSILX

3

4

4

4

At the same time, the funds’10 year risks are sometimes just average (Spectrum Income) but mostly above average (Balanced, Personal Strategy Balanced, Personal Strategy Income, Spectrum Growth, Spectrum International).  But never “high.”  That’s not the Price way.

Bottom Line

Investors who have traditionally favored a simple 60/40 hybrid approach and long-term investors who are simply baffled by where to move next should look carefully at RPGAX.  It doesn’t pretend to be a magic bullet, but it offers incredibly broad asset exposure, a modest degree of opportunism and a fair dose of risk hedging in a single, affordable package.  In a fund category marked by high expenses, opaque strategies and untested management teams, it’s apt to stand modestly out.

Fund website

T. Rowe Price Global Allocation

© Mutual Fund Observer, 2013. All rights reserved. The information here reflects publicly available information current at the time of publication. For reprint/e-rights contact us.