


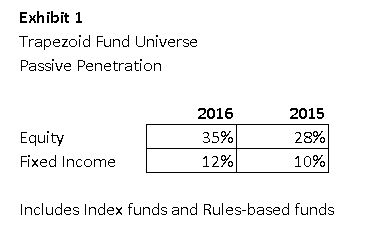
Over the past eight years the US mutual fund industry has witnessed a massive shift from active to passive management. In the Trapezoid universe, 35% of equity funds are now passively managed compared with 28% a year ago. This figure is AUM weighted, includes exchange-traded and closed-end funds, captures flows through July. The fixed income universe gets less attention but we observe 12% of AUM are now passively managed.
 How far this trend will extend is up for debate. But the penetration rate actually steepened this year. The new DOL fiduciary rules, which take full effect at the end of 2017, may be a catalyst. If you believe in the classic S curve from Marketing 101, we are (to paraphrase Bon Jovi) only half way there.
Trapezoid believes fewer than 10% of actively managed funds justify their expense ratio. Readers unfamiliar with Trapezoid and FundAttribution can visit the methodology page on our website. Readers can register for a no-obligation demo on the site. So while a small number of managers give us statistical evidence that they can beat the market and justify
next year’s fees, most of that $70 billion outlay is unjustified. A lot of money is at stake. US mutual and closed-end fund investors are paying over $70 billion per year for active management. Considering all investment vehicles and looking more globally the impact is several times greater.
Who is the beneficiary of all that largesse? Seventy percent of the fees are going to active equity funds, by our reckoning, with fixed income and target date funds accounting for most of the balance. Capital Group, Fidelity, and T. Rowe represent about 30% of the pot. Franklin Resources, BlackRock, Invesco, Allianz, Natixis, JPMorgan, Sun Life, Mass Mutual, and Principal comprise another 20%. The rest is spread widely. The asset managers share their wealth with a number of service providers, distributors, and subadvisors. Without more transparency, we must make some educated guesses.
If we are really only “halfway there” – in other words passive and rules-based funds will end up with 60+ % of the market, the economics of the industry will come under heavy pressure and will have to manage expenses tightly.
A number of these players are publicly traded. To gauge where the industry is headed, it might be useful to look at the stock prices of the asset managers, particularly those with a high dependence on actively managed funds. Exhibit II shows that the past 24 months have not been kind to this group. Still, some have held up much better than others. Of the larger players, T Rowe Price Group Inc. (TROW) is down 15% while Legg Mason Inc. (LM) is down 30%. Among the hardest hit are Waddell & Reed (WDR), Calamos (CLMS), and Virtus (VRTS) The basket of stocks in Exhibit II trade at 13.7x 2017 earnings. This compare with 17x for the S&P500. The market is discounting stormy weather, but not an avalanche.
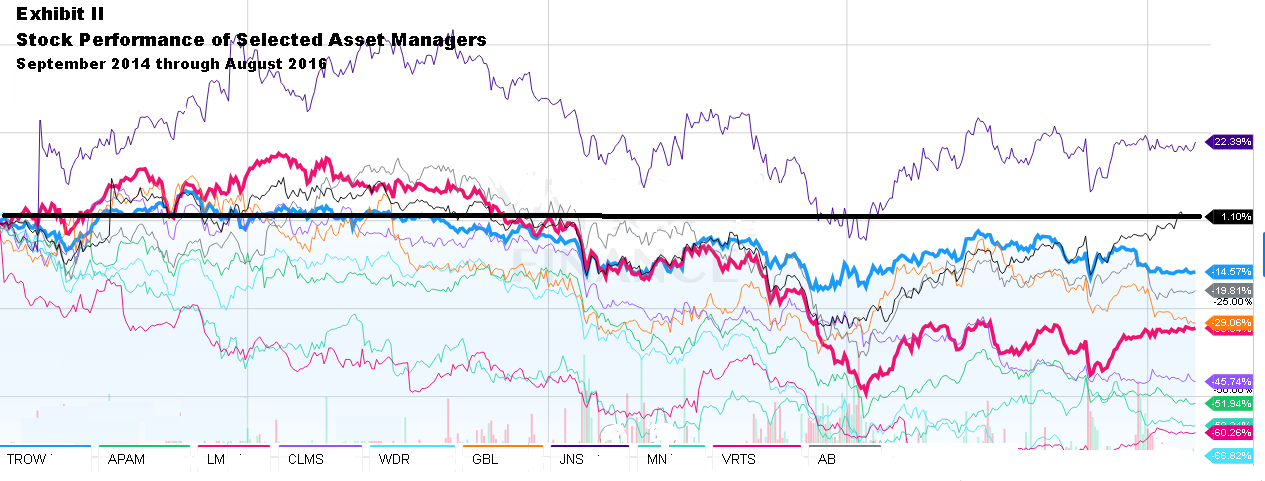
Credit: Yahoo Finance
Without commenting too much on individual securities, we can make some general observations. The market seems to believe fixed income is relatively immune; fund groups with a high concentration do better. Some companies benefit from sticky products or distribution. Others have benefitted from acquisitions. Many are now on the passive bandwagon. The hardest hit stocks are relatively concentrated in active equity mutual funds.
Sell-side analysts on the whole seem selective, looking for companies with defensive qualities. They anxiously monitor retail outflows. Although liquid alts have registered disappointing performance (see our July article “Liquid Alts; The Thrill is Gone” ) and outflows, some still view it as a source of growth.The performance of a firm’s investment products matters greatly. WDR (which markets funds under the Waddell & Reed and Ivy monikers) delivered a stunningly bad sS of -3.4 for the 12 months ending July 2016. (Recall sS is skill from Security Selection. This doesn’t even factor the expenses associated with active fund management) Our skill estimate is based on a bottoms-up analysis of 43 funds with AUM totaling $65 billion; these funds comprise ¾ of the firm’s overall assets. As a result, the firm’s AUM have dropped by 1/3 and the stock price has fallen by half over the past year. One bright spot for the new CEO is strong performance from small-cap strategies.
Playing Defense
No mutual fund executive wants their company to be the next Waddell & Reed. Mutual fund executives must be tempted to ask their successful fund managers with well-established track records to protect the franchise by tamping down on risk and not straying too far from the benchmarks.
Conversely, investors in actively managed funds must do their homework to ferret out elite managers who continue to justify their higher costs. Funds with low active share are sometimes called closet indexers. The term refers to a fund which bills itself as an active fund, charges like an active fund, but performs very much like an index fund. Generally, these funds track their benchmarks closely. Investors who are paying the added freight of an active fund demand a differentiated portfolio. As you would expect, closet index funds score poorly at FundAttribution.com because they deliver no value-added and thus are almost certain to underperform after fees.
Morningstar estimates that 15-20% of funds (by assets) are closet indexers. Professor Thomas Howard of the University of Colorado believes 70% of funds fall into this category. He evidently includes funds whose results match the benchmarks, even if the manager tried to differentiate the holdings.
How to tell if your fund is a closet indexer? One strategy in vogue is to seek funds with high active share. These are funds whose managers make a concerted effort to differ their portfolio from the indices. WSJ subscribers can refer to this list published several years ago.
We combed our universe for “Closet Passives”. In some ways our definition is a little more expansive because we include funds which track a blend of several indices. We allow that blend to vary over time based on a formula (think of a target fund) or at the discretion of the manager (i.e., a fund of closet index funds). In other respects, our definition is narrower. Closet Passives must track their indices over time, and must be fairly consistent over their lifetimes. We exclude funds which market themselves as index funds as well as those with low expense ratios.
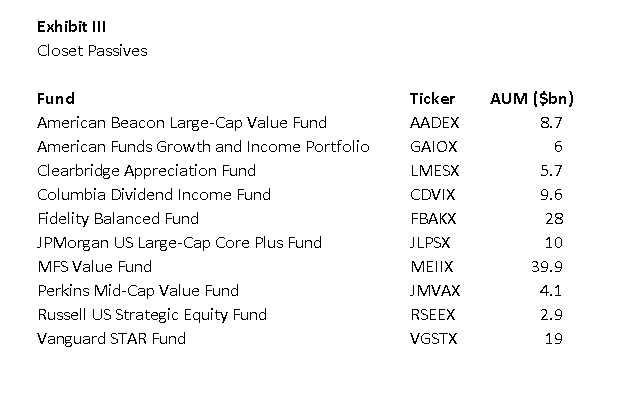 Here are some representative funds we found. These are not true passives. The portfolio holdings will not resemble their benchmarks. Performance will deviate a bit from year to year due to security selection. But the funds gross returns stay ~98% correlated to the Trapezoid “replication portfolio” at all times.
For a more complete list of Closet Passives, the FundAttribution.com website shows an R-squared for every fund in our universe. (Register for the free demo and navigate to the Fund Analysis/Details page.) An R-squared close to 100 means we can replicate it almost exactly.
Interestingly, the funds in Exhibit III do show a modicum of sS skill, roughly +0.3 over both the most recent one year and three year periods. (That level of skill is not statistically significant and could be explained by survivorship bias.)
A lot of offerings from insurance companies seem geared to stay fairly close to the benchmarks but are priced like active funds. And many target date funds look a lot like cocktails blending equity and bond indices; the bartender gets a healthy markup for stirring the drink.
What if you find you are holding a closet passive with lots of capital gains? I put this question to Sam Lee, fellow contributor and principal of Severian Asset Management. Assuming the fund is in a taxable portfolio, Sam advises you should generally not rush to dump the fund unless the fund is very expensive and/or will distribute lots of capital gains anyway. With some patience, there is usually a future opportunity to get rid of the fund with a smaller tax hit, usually due to some combination of losses in the fund and harvestable losses elsewhere in the portfolio.
Unfortunately, avoiding Closet Passives isn’t good enough. Out of the $70 billion in excess fees cited above, avoiding them will ameliorate only 5% of the problem. But it is a good place to start.
 What’s the Trapezoid story? Leigh Walzer has over 25 years of experience in the investment management industry as a portfolio manager and investment analyst. He’s worked with and for some frighteningly good folks. He holds an A.B. in Statistics from Princeton University and an M.B.A. from Harvard University. Leigh is the CEO and founder of Trapezoid, LLC, as well as the creator of the Orthogonal Attribution Engine. The Orthogonal Attribution Engine isolates the skill delivered by fund managers in excess of what is available through investable passive alternatives and other indices. The system aspires to, and already shows encouraging signs of, a fair degree of predictive validity.
The stuff Leigh shares here reflects the richness of the analytics available on his site and through Trapezoid’s services. If you’re an independent RIA or an individual investor who need serious data to make serious decisions, Leigh offers something no one else comes close to. More complete information can be found at www.fundattribution.com. MFO readers can sign up for a free demo.