


(Making Your Portfolio Great Again)
The election 3 weeks ago ushered in a new investment paradigm. To Make America Great Again, President-elect Trump is committed to lower taxes, run large deficits, and spent trillions on infrastructure. Trump is no friend of the bond market, and judging by the steep decline in bond prices over the following week, the feeling is mutual. Bondholders took note when Mr. Trump bragged on CNBC back in May that he had a lot of experience negotiating with bondholders which he could bring to bear in addressing the government’s debts. But they were probably more spooked by the subsequent clarification that the government would never default because it could print money at will.
We have no crystal ball on whether Trump will follow through on his spending plans or if the Republican Congress will restrain him. Dennis Gartman predicts Trump will “Out-Keynes Keynes”. Judging by the tepid growth rate, the US and world economy still have plenty of slack. But even a dovish Fed seems to recognize now the risk barometer is tipping toward inflation.
A few days before the election, a prescient money manager from the rust belt asked me how to best protect clients from inflation. Treasury Inflation Protected Securities (TIPS) didn’t meet his needs because his clients didn’t want to completely forego equity-like returns. He considered some fund products which coupled fixed income or equity strategies with derivatives intended to protect against inflation. But he wasn’t sure they justified their expenses.
Inflation Risk and TIPS
If a portfolio earns 4% when inflation is running 5%, the client’s purchasing power declines by 1%. But we view “Inflation Risk” based on what the portfolio should have been earning. One benchmark is the return available had the client allocated 100% to TIPS. So if TIPS are yielding CPI + 1%, we would deem the shortfall as 2%.
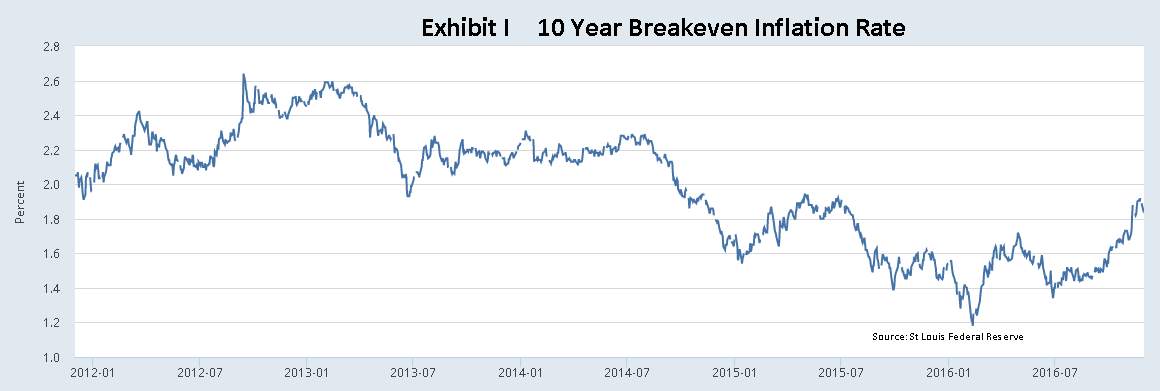
TIPS are pricing future inflation of 1.86% at this writing up from a trough of 1.2% and 1.71% before the election. (Exhibit I) If a client is inflation averse, TIPS may deserve an allocation
This is not to suggest TIPS bonds are the “gold standard “of inflation protection. TIPS are backed by a government promise to pay a fixed rate which increases with the Consumer Price Index (CPI). There is good reason to question the value of CPI as an inflation measure. The government has made profound changes over time in the computation of CPI and, as Forbes Magazine notes, has incentives to continue to do so
Other than relying on TIPS, how can an investor reduce his inflation risk? Many investors turn to commodities or gold as an inflation hedge. But these save havens historically offer much lower yield. Are they worthwhile? Are there better inflation hedges? To bring some insight to the question we crunch some numbers using the Trapezoid database. Trapezoid attributes performance and skill of mutual fund managers using data which goes back to 1995. Qualified MFO readers can demo the capabilities at www.fundattribution.com. The methodology behind the skill ratings is explained here.
The data we use for this article covers the period 11/1/01 to 10/31/16. So we can speak to what worked over the past generation. As the motor of slowing inflation goes into reverse, there is no guarantee patterns will hold. Trumpian inflation may work through the demand side while our recent historical experience is linked to declining input costs.
Inflation Sensitivity: How much is enough
The key to protecting a portfolio from inflation is acquiring assets with Inflation Sensitivity (“IS”). Exhibit II lays out the IS of some of the major fund categories. For those with a penchant for matters mathematical, we compute IS by defining an inflation index based on the difference in price movement in a basket of Real Return funds against a basket of bond funds with comparable durations. We then use regressions to determine how much each category moved in inflationary periods. An IS of 1.0 means the investment responds to inflation about the same as a typical Real Return fund.
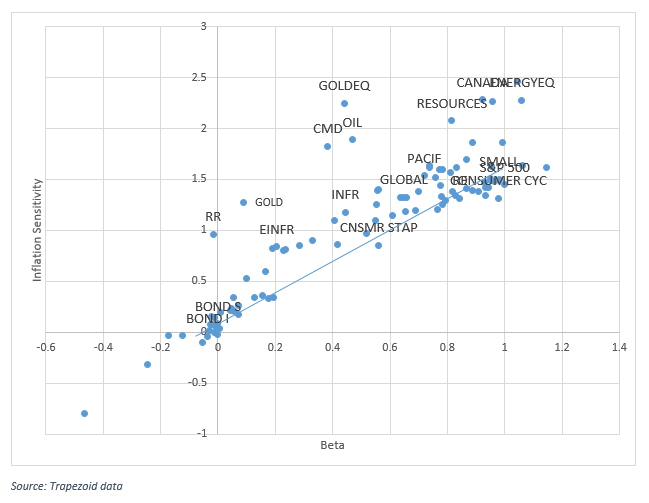
Exhibit II: Inflation Sensitivity by Investment Category
Some investment categories move nearly 2.5% for a 1% move in our inflation index. This includes Gold Mining Equities (GOLDEQ), Energy Equities (ENERGYEQ), and Canadian funds. Others like traditional bond funds move not at all with inflation. The S&P500 has an IS of 1.44.
How much Inflation Sensitivity a Client Portfolio needs is a matter of debate. An IS of 1 is sufficient to match CPI. This is a good start, but most MFO readers probably agree it is not sufficient.
A number of academic studies suggest that even the S&P500 tends not to keep up with inflation. Why isn’t the S&P500 a more effective hedge? The most common explanation is that rising inflation leads to falling consumer demand. Accelerating inflation probably also puts pressure on corporate profit margins. If these studies are correct, inflation-averse investors should target an IS of at least 1.5x. In other words, a portfolio with IS of less than 1.5x has inflation risk.
Inflation Fighting Strategies
We observe that the IS of most investment categories is closely tied to their Beta. This means the easiest way to reduce inflation risk is to amp up your Beta. (Beta is a measure of systemic risk. For this article, Beta is the expected percentage change in the portfolio when the S&P500 moves 1%)
If a client is willing to stay fully invested in the S&P500, he can get an IS of 1.45x which will nearly hedge inflation. Clients who are targeting IS higher than 1.45 or who aren’t willing to be fully invested must either tolerate inflation risk or acquire more IS.
Since most clients are willing to endure only so much systemic risk in their portfolio, we focus on the question of how to get the most IS per unit of Beta. Exhibit III is one attempt to address this question. For our major investment categories, we normalize both Return and IS for the impact of Beta.
The vertical axis here is Normalized Inflation Sensitivity (NIS) NIS measures whether investments provided high IS relative to their Beta. You can think of this as the distance between the point in Exhibit II and the trendline. Real Return (RR) provides an IS of 1 with almost no beta. Gold provided (over the past 15 years) a little more IS with a modest amount of beta. Mining stocks (gold and precious metal equities) provided the highest IS relative to beta,
The horizontal axis reflects whether these categories offered good investment returns over the past 15 years, once again normalized for the amount of systemic risk.
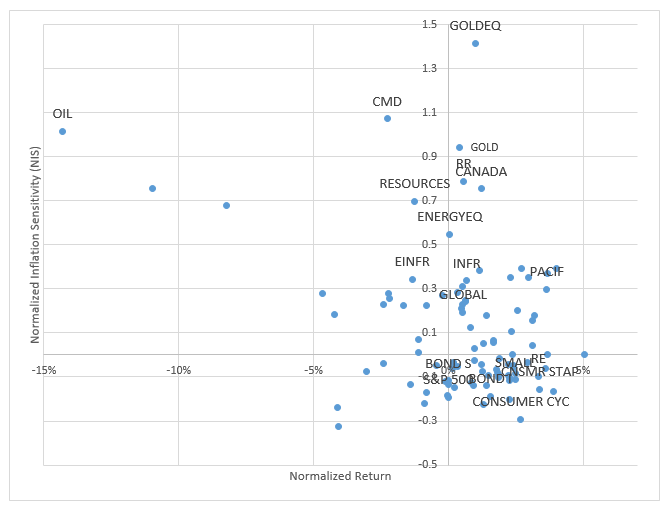
Exhibit III: Normalized Inflation Sensitivity vs Normalized Return by Investment Category
What Works, What Doesn’t
Investments in the Pacific region had good Normalized Return with positive NIS. Investments in the consumer sector also did well, but NIS was negative. Commodities for the most part offered positive NIS but Normalized Returns were negative.
Infrastructure and real estate were helpful from an inflation perspective and didn’t seem to cost investors at all. Directionally, allocating more to foreign stocks and small cap also helped. Growth might work slightly better than value.
Make Your Portfolio Great Again(#MYPGA)
Let’s illustrate how these principles can be put to work. An investment portfolio is currently allocated 80% to Equities (using an S&P 500 Index) and 20% to intermediate bonds. This portfolio has an IS of only 1.15, enough to keep pace with CPI but probably not enough to match “true” inflation.
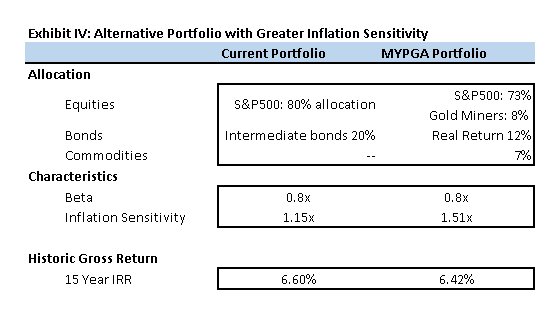
Exhibit IV illustrates how a portfolio can be tailored to fight inflation. Although the fixed income allocation falls, the Beta is unchanged at .8. However, the IS increases from 1.15 to 1.51. Over the past 15 years, the Alternative portfolio yielded 18 basis points less. Commodities has not been the best inflation hedge over the past decade, but we still think it merits an allocation, particularly for inflation-averse clients.
Inflation-Fighting Funds
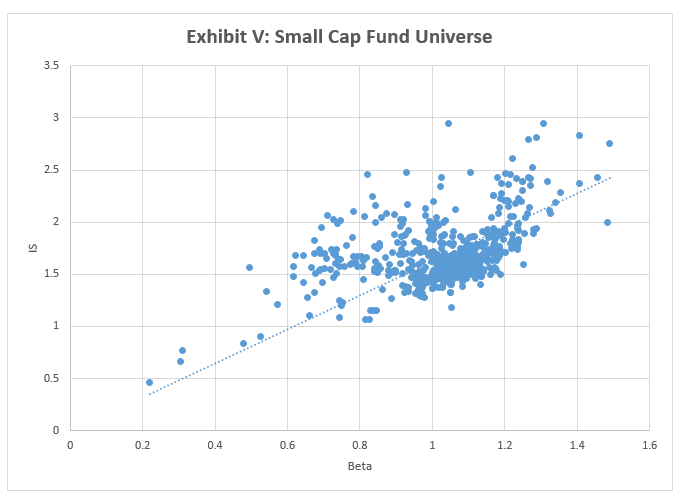
For investors allocating within an investment category, the same principles apply. For example, within the small cap fund universe Inflation Sensitivity has a wide dispersion – and a strong correlation to Beta.
Are there actively managed funds which are good inflation fighters?
We applied the same criteria to search the Trapezoid database for individual funds with positive NIS and good Normalized Returns.
Not surprisingly, Gold and Precious Metal Equity Funds are well represented in that list. Several regional or country funds made the list including funds from Canada, Hong Kong, and (yes) Indonesia. Our list also turned up several commodity funds. The commodity funds with highest IS were utilizing high leverage (explicit or implicit) and produced volatile returns. Goldman Sachs Commodities Strategies Fund has an IS of 2.7, meaning it is 50% more potent as an inflation hedge compared with the average fund in the category.
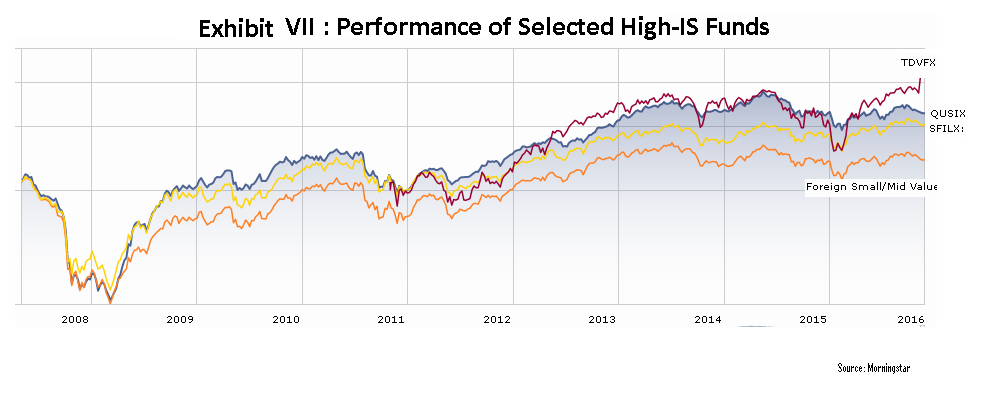
Exhibit VI lists three equity managers. These funds fare well in inflationary periods with positive NIS and good historic Normalized Returns. They also satisfy our traditional criteria, meaning expected skill over the next 12 months is justifies expense ratio with 60% confidence. Exhibit VII shows cumulative return since 2008 for these funds was much better than a common benchmark.
| SYM | AUM | EXP | Stars | Beta | IS | ||
| Pear Tree Polaris Foreign Value Small-Cap Fund | Foreign SMID Value | QUSIX | 532 | 1.30% | 4 | 0.7x | 2.45 |
| Schwab Fundamental International Small-Cap Company index | Foreign SMID Blend | SFILX, FNDC | 1116 | 0.49% | 4 | 0.9x | 2.34 |
| Towle Deep Value Fund | Small Blend | TDVFX | 134 | 1.20% | 3 | 1.1x | 2.95 |
Interestingly, all three funds focus on small caps. Pear Tree Polaris Foreign Value Small-Cap Fund (QUSIX) and Towle Deep Value Fund (TDVFX) were profiled recently by Professor Snowball. Towle Deep Value Fund has been around just give years; we note Morningstar initially gave them 5 stars, dropped them to 2, and then raised them back to 3 stars. Despite a high expense ratio, their strong performance seems to justify a higher rating. Polaris holds many volatile positions, including some microcaps, but they diversify their portfolio effectively. Schwab Fundamental International Small-Cap Company Index Fund (SFILX) is managed quantitatively by Research Associates. The domestic small cap sector has rallied since the election but the foreign small caps have not.
There are many good Real Return funds to choose from. (There are also quite a few which seem very overpriced.) One of the good funds is PIMCO 15+ Year US TIPS Index ETF. (LTPZ) This fund has an IS 1.6x the category average. So a 7.5% allocation will arguably produce the same result as a 12% allocation to the average Real Return fund. The expense ratio is a moderate 20 basis points
Bottom Line
Inflation has the potential to be a portfolio wrecker. Advisers may want to consider Real Return funds, commodities, energy and mining stocks, infrastructure, and real estate. Investors should also consider taking more systemic risk and maintaining higher overseas weighting, especially resource-intensive economies like Canada. But Exhibit IV indicates the IS can be boosted significantly without a major reallocation. We identify several small-cap funds with excellent track records who score well as inflation fighters.