Category Archives: Old Profile

These profiles have been updated since the original publication, but remain here for permalinks. A link to the fully updated profile should be included at the top.

Centaur Total Return Fund (TILDX), June 2018

By David Snowball


This profile is no longer valid and remains purely for historical reasons. The fund has a new manager and a new strategy.


Objective

The fund seeks “maximum total return” through a combination of capital appreciation and income. The fund invests in undervalued securities, mostly mid- to large-cap dividend paying stocks. The manager has the option of investing in REITs, master limited partnerships, royalty trusts, preferred shares, convertibles, bonds and cash. The manager invests in companies “that he understands well.” The manager also generates income by selling covered calls on some of his stocks. As of February 28, 2018, the fund held 21 different investments, which Continue reading →

Aston/River Road Independent Value (ARIVX)

By David Snowball

Update: This fund has been liquidated.

This fund was previously profiled in September 2012. You can find that profile here.

Objective

The fund seeks to provide long-term total return by investing in common and preferred stocks, convertibles and REITs. The manager attempts to invest in high quality, small- to mid-cap firms (those with market caps between $100 million and $5 billion). He thinks of himself as having an “absolute return” mandate, which means an exceptional degree of risk-consciousness. He’ll pursue the same style of investing as in his previous charges, but has more flexibility than before because this fund does not include the “small cap” name.

Adviser

Aston Asset Management, LP. It’s an interesting setup. Aston oversees 24 funds with $9.3 billion in assets, and is a subsidiary of the Affiliated Managers Group. River Road Asset Management LLC subadvises six Aston funds; i.e., provides the management teams. River Road, founded in 2005, oversees $6.1 billion and was acquired by AMG in 2014. River Road also manages seven separate account strategies, including the Independent Value strategy used here.

Manager

Eric Cinnamond. Mr. Cinnamond is a Vice President and Portfolio Manager of River Road’s independent value investment strategy. Mr. Cinnamond has 23 years of investment industry experience. Mr. Cinnamond managed the Intrepid Small Cap (ICMAX) fund from 2005-2010 and Intrepid’s small cap separate accounts from 1998-2010. He co-managed, with Nola Falcone, Evergreen Small Cap Equity Income from 1996-1998.

Management’s Stake in the Fund

Mr. Cinnamond has invested between $500,000 – $1,000,000 in the fund.

Strategy capacity

Mr. Cinnamond anticipates a soft close at about a billion. The strategy has $450 million in assets, which hot money drove close to a billion during the last market crisis.

Opening date

December 30, 2010.

Minimum investment

$2,000 for regular accounts, $1000 for various sorts of tax-advantaged products (IRAs, Coverdells, UTMAs).

Expense ratio

1.42%, after waivers, on $410 million in assets.

Comments

If James Brown is the godfather of soul, then Eric Cinnamond might be thought the godfather of small cap, absolute value investing. He’s been at it since 1996 and he suspects that folks who own lots of small cap stocks today are going to want to sell them to him, for a lot less than they paid, sooner rather than later.

This fund’s first incarnation appeared in 1996, as the Evergreen Small Cap Equity Income fund. Mr. Cinnamond had been hired by First Union, Evergreen’s advisor, as an analyst and soon co-manager of their small cap separate account strategy and fund. The fund grew quickly, from $5 million in ’96 to $350 million in ’98. It earned a five-star designation from Morningstar and was twice recognized by Barron’s as a Top 100 mutual fund.

In 1998, Mr. Cinnamond became engaged to a Floridian, moved south and was hired by Intrepid (located in Jacksonville Beach, Florida) to replicate the Evergreen fund. For the next several years, he built and managed a successful separate accounts portfolio for Intrepid, which eventually aspired to a publicly available fund.

The fund’s second incarnation appeared in 2005, with the launch of Intrepid Small Cap (now called Intrepid Endurance, ICMAX). In his five years with the fund, Mr. Cinnamond built a remarkable record which attracted $700 million in assets and earned a five-star rating from Morningstar and a Lipper Leader for total returns and capital preservation. If you had invested $10,000 at inception, your account would have grown to $17,300 by the time he left. Over that same period, the average small cap value fund lost money.

The fund’s third incarnation appeared on the last day of 2010, with the launch of Aston / River Road Independent Value (ARIVX). While ARIVX is run using the same discipline as its predecessors, Mr. Cinnamond intentionally avoided the “small cap” name. While the new fund will maintain its historic small cap value focus, he wanted to avoid the SEC stricture which would have mandated him to keep 80% of assets in small caps.

Over an extended period, Mr. Cinnamond’s small cap composite (that is, the weighted average of the separately managed accounts under his charge over the past 20 years) has returned 10% per year to his investors. That figure understates his stock picking skills, since it includes the low returns he earned on his often-substantial cash holdings.

The key to Mr. Cinnamond’s performance (which, Morningstar observed, “trounced nearly all equity funds”) is achieved, in his words, “by not making mistakes.” He articulates a strong focus on absolute returns; that is, he’d rather position his portfolio to make some money, steadily, in all markets, rather than having it alternately soar and swoon. There seem to be three elements involved in investing without mistakes:

  • Buy the right firms.
  • At the right price.
  • Move decisively when circumstances demand.

All things being equal, his “right” firms are “steady-Eddy companies.” They’re firms with look for companies with strong cash flows and solid operating histories. Many of the firms in his portfolio are 50 or more years old, often market leaders, more mature firms with lower growth and little debt.

His judgment, as of early 2016, is that virtually any new investments in his universe – which requires both high business quality and low stock prices – would be a mistake. He writes:

As a result of extremely expensive small cap valuations, especially in higher quality small cap stocks, the Independent Value Portfolio maintains its very contrarian positioning. Cash is near record levels, while expensive, high quality small cap holdings have been sold. We expect our unique, but disciplined, positioning to cause the Portfolio to continue to look and perform very differently than the market and its peers.

… we do not believe the current market cycle will continue indefinitely. We feel we are positioned well for the end of the current cycle and the inevitable return to more rational and justifiable equity valuations. As disciplined value investors, we have not strayed from our valuation practices and investment discipline. We continue to require an adequate return for risk assumed on each stock we consider for purchase, and will not invest your (and our) capital simply for the sake of being invested.

He’s at 85% cash currently (late April 2016), but that does not mean he’s some sort of ultra-cautious perma-bear. He has moved decisively to pursue bargains when they arise. “I’m willing to be aggressive in undervalued markets,” he says. For example, his fund went from 0% energy and 20% cash in 2008 to 20% energy and no cash at the market trough in March, 2009. Similarly, his small cap composite moved from 40% cash to 5% in the same period. That quick move let the fund follow an excellent 2008 (when defense was the key) with an excellent 2009 (where he was paid for taking risks). The fund’s 40% return in 2009 beat his index by 20 percentage points for a second consecutive year. As the market began frothy in 2010 (“names you just can’t value are leading the market,” he noted), he began to let cash build. While he found a few pockets of value in 2015 (he surprised himself by buying gold miners, something he’d never done), prices rose so quickly that he needed to sell.

The argument against owning is captured in Cinnamond’s cheery declaration, “I like volatility.” Because he’s unwilling to overpay for a stock, or to expose his shareholders to risk in an overextended market, he sidelines more and more cash which means the fund lags in extended rallies. But when stocks begin cratering, he moves quickly in which means he increases his exposure as the market falls. Buying before the final bottom is, in the short term, painful and might be taken, by some, as a sign that the manager has lost his marbles. Again.

Bottom Line

Mr. Cinnamond’s view, informed by a quarter century of investing and a careful review of history, is that small cap stocks are in a bubble. More particularly, they might be in a historic bubble that exceeds those in 2000 and 2007. Each of those peaks was followed by 40% declines. The fragility of the small cap space is illustrated by the sudden decline in those stocks in the stock half of 2015. In eight months, from their peak in June 2015 to their bottom in February 2016, small cap indexes dropped 22%. Then, in 10 weeks, they shrugged it off, rose 19% and returned to historically high valuations. Investing in small cap stocks can be rational and rewarding. Reaping those rewards requires a manager who is willing to protect you from the market’s worst excesses and your own all-to-human impulses. You might check here if you’re in search of such a manager.

Fund website

Aston/River Road Independent Value

© Mutual Fund Observer, 2016. All rights reserved. The information here reflects publicly available information current at the time of publication. For reprint/e-rights contact us.

Centaur Total Return Fund (TILDX)

By David Snowball


This profile is no longer valid and remains purely for historical reasons. The fund has a new manager and a new strategy.


Objective

The fund seeks “maximum total return” through a combination of capital appreciation and income. The fund invests in undervalued securities, mostly mid- to large-cap dividend paying stocks. The manager has the option of investing in REITs, master limited partnerships, royalty trusts, preferred shares, convertibles, bonds and cash. The manager invests in companies “that it understands well.” The managers also generate income by selling covered calls on some of their stocks. The portfolio currently consists of about 30 holdings, 16 of which are stocks.

Adviser

Centaur Capital Partners, L.P., headquartered in Southlake, TX, has been the investment advisor for the fund since September 3, 2013. Before that, T2 Partners Management, LP advised the fund with Centaur serving as the sub-advisor. The first “T” of T2 was Whitney Tilson and this fund was named Tilson Dividend Fund. Centaur is a three person shop with about $90 million in AUM. It also advises the Centaur Value Fund LP, a hedge fund.

Manager

Zeke Ashton, founder, managing partner, and a portfolio manager of Centaur Capital Partners L.P., has managed the fund since inception. Before founding Centaur in 2002, he spent three years working for The Motley Fool where he developed and produced investing seminars, subscription investing newsletters and stock research reports in addition to writing online investing articles. He graduated from Austin College, a good liberal arts college, in 1995 with degrees in Economics and German.

Management’s Stake in the Fund

Mr. Ashton has somewhere between $500,000 and $1,000,000 invested in the fund. One of the fund’s two trustees has a modest investment in it.

Strategy capacity

That’s dependent on market conditions. Mr. Ashton speculates that he could have quickly and profitably deployed $25 billion in March, 2009. In early 2016, he saw more reason to hold cash in anticipation of a significant market reset. He’s managed a couple hundred million before but has no aspiration to take it to a billion.

Opening date

March 16, 2005

Minimum investment

$1,500 for regular and tax-advantaged accounts, reduced to $1000 for accounts with an automatic investing plan.

Expense ratio

1.95% after waivers on an asset base of $27 million.

Comments

You’d think that a fund that had squashed the S&P 500 over the course of the current market cycle, and had done so with vastly less risk, would be swamped with potential investors. Indeed, you’d even hope so. And you’d be disappointed.

centaur

Here’s how to read that chart: over the course of the full market cycle that began in October 2007, Centaur has outperformed its peers and the S&P 500 by 2.6 and 1.7 percent annually, respectively. In normal times, it’s about 20% less volatile while in bear market months it’s about 25% less volatile. In the worst-case – the 2007-09 meltdown – it lost 17% less than the S&P and recovered 30 months sooner.

$10,000 invested in October 2007 would have grown to $18,700 in Centaur against $16,300 in Vanguard’s 500 Index Fund.

tildx

Centaur Total Return presents itself as an income-oriented fund. The argument for that orientation is simple: income stabilizes returns in bad times and adds to them in good. The manager imagines two sources of income: (1) dividends paid by the companies whose stock they own and (2) fees generated by selling covered calls on portfolio investments. The latter, of late, have been pretty minimal.

The core of the portfolio is a limited number (currently about 16) of high quality stocks. In bad markets, such stocks benefit from the dividend income – which helps support their share price – and from a sort of “flight to quality” effect, where investors prefer (and, to an extent, bid up) steady firms in preference to volatile ones. Almost all of those are domestic firms, though he’s had significant direct foreign exposure when market conditions permit. Mr. Ashton reports becoming “a bit less dogmatic” on valuations over time, but he remains one of the industry’s most disciplined managers.

The manager also sells covered calls on a portion of the portfolio. At base, he’s offering to sell a stock to another investor at a guaranteed price. “If GM hits $40 a share within the next six months, we’ll sell it to you at that price.” Investors buying those options pay a small upfront price, which generates income for the fund. As long as the agreed-to price is approximately the manager’s estimate of fair value, the fund doesn’t lose much upside (since they’d sell anyway) and gains a bit of income. The profitability of that strategy depends on market conditions; in a calm market, the manager might place only 0.5% of his assets in covered calls but, in volatile markets, it might be ten times as much.

Mr. Ashton brings a hedge fund manager’s ethos to this fund. That’s natural since he also runs a hedge fund in parallel to this. Long before he launched Centaur, he became convinced that a good hedge fund manager needs to have “an absolute value mentality,” in part because a fund’s decline hits the manager’s finances personally. The goal is to “avoid significant drawdowns which bring the prospect of catastrophic or permanent capital loss. That made so much sense. I asked myself, what if somebody tried to help the average investor out – took away the moments of deep fear and wild exuberance? They could engineer a relatively easy ride. And so I designed a fund for folks like my parents. Dad’s in his 70s, he can’t live on no-risk bonds but he’d be badly tempted to pull out of his stock investments at the bottom. And so I decided to try to create a home for those people.”

And he’s done precisely that: a big part of his assets are from family and friends, people who know him and whose fates are visible to him almost daily. He’s served them well.


This profile is no longer valid and remains purely for historical reasons. The fund has a new manager and a new strategy.


Bottom Line

You’re certain to least want funds like Centaur just when you most need them. As the US market reaches historic highs that might be today. For folks looking to maintain their stock exposure cautiously, and be ready when richer opportunities present themselves, this is an awfully compelling little fund.

Fund website

Centaur Total Return Fund

© Mutual Fund Observer, 2016. All rights reserved. The information here reflects publicly available information current at the time of publication. For reprint/e-rights contact us.

TCW/Gargoyle Hedged Value (TFHVX/TFHIX), September 2015

By David Snowball

This fund has been liquidated.

Objective and strategy

TCW/Gargoyle Hedged Value seeks long-term capital appreciation while exposing investors to less risk than broad stock market indices. The strategy is to hold a diversified portfolio mid- to large-cap value stocks, mostly domestic, and to hedge part of the stock market risk by selling a blend of index call options. In theory, the mix will allow investors to enjoy most of the market’s upside while being buffered for a fair chunk of its downside.

Adviser

TCW. TCW, based in Los Angeles, was founded in 1971 as Trust Company of the West. About $140 billion of that are in fixed income assets. The Carlyle Group owns about 60% of the adviser while TCW’s employees own the remainder. They advise 22 TCW funds, as well as nine Metropolitan West funds with a new series of TCW Alternative funds in registration. As of June 30, 2015, the firm had about $180 billion in AUM; of that, $18 billion resides in TCW funds and $76 billion in the mostly fixed-income MetWest funds.

Manager

Joshua B. Parker and Alan Salzbank. Messrs. Parker and Salzbank are the Managing Partners of Gargoyle Investment Advisor, LLC. They were the architects of the combined strategy and managed the hedge fund which became RiverPark/Gargoyle, and now TCW/Gargoyle, and also oversee about a half billion in separate accounts. Mr. Parker, a securities lawyer by training is also an internationally competitive bridge player (Gates, Buffett, Parker…) and there’s some reason to believe that the habits of mind that make for successful bridge play also makes for successful options trading. They both have over three decades of experience and all of the investment folks who support them at Gargoyle have at least 20 years of experience in the industry.

Strategy capacity and closure

The managers estimate that they could manage about $2 billion in the stock portion of the portfolio and a vastly greater sum in the large, liquid options market. TCW appears not to have any clear standards controlling fund closures.

Active share

“Active share” measures the degree to which a fund’s portfolio differs from the holdings of its benchmark portfolio. High active share indicates management which is providing a portfolio that is substantially different from, and independent of, the index. An active share of zero indicates perfect overlap with the index, 100 indicates perfect independence. Gargoyle has calculated the active share of the equity portion of the portfolio but is legally constrained from making that information public. Given the portfolio’s distinctive construction, it’s apt to be reasonably high.

Management’s stake in the fund

As of January 2014, the managers had $5 million invested in the strategy (including $500,000 in this fund). Gargoyle Partners and employees have over $10 million invested in the strategy.

Opening date

The strategy was originally embodied in a hedge fund which launched December 31, 1999. The hedge fund converted to a mutual fund on April 30, 2012. TCW adopted the RiverPark fund on June 26, 2015.

Minimum investment

$5000, reduced to $1000 for retirement accounts. There’s also an institutional share class (TFHIX) with a $1 million minimum and 1.25% expense ratio.

Expense ratio

1.50%, after waivers, on assets of $74.5 million, as of July, 2015.

Comments

Shakespeare was right. Juliet, the world’s most famously confused 13-year-old, decries the harm that a name can do:

‘Tis but thy name that is my enemy;
Thou art thyself, though not a Montague.
What’s Montague? it is nor hand, nor foot,
Nor arm, nor face, nor any other part
Belonging to a man. O, be some other name!
What’s in a name? that which we call a rose
By any other name would smell as sweet;
So Romeo would, were he not Romeo call’d,
Retain that dear perfection which he owes
Without that title.

Her point is clear: people react to the name, no matter how little sense that makes. In many ways, they make the same mistake with this fund. The word “hedged” as the first significant term of the name leads many people to think “low volatility,” “mild-mannered,” “market neutral” or something comparable. Those who understand the fund’s strategy recognize that it isn’t any of those things.

The Gargoyle fund has two components. The fund combines an unleveraged long portfolio and a 50% short portfolio, for a steady market exposure of 50%. The portfolio rebalances between those strategies monthly, but monitors and trades its options portfolio “in real time” throughout the month.

The long portfolio is 80-120 stocks, and stock selection is algorithmic. They screen the 1000 largest US stocks on four valuation criteria (price to book, earnings, cash flow and sales) and then assign a “J score” to each stock based on how its current valuation compares with (1) its historic valuation and (2) its industry peers’ valuation. They then buy the hundred most undervalued stocks, but maintain sector weightings that are close to the S&P 500’s.

The options portfolio is index call options. At base, they’re selling insurance policies to nervous investors. Those policies pay an average premium of 2% per month and rise in value as the market falls. That 2% is a long-term average, during the market panic in the fall of 2008, their options were generating 8% per month in premiums.

Why index calls? Two reasons: (1) they are systematically mispriced, and so they generate more profit (or suffer less of a loss) than they theoretically should. Apparently anxious investors are not as price-sensitive as they should be. In particular, these options are overpriced by about 35 basis points per month 88% of the time. For sellers such as Gargoyle, that means something like a 35 bps free lunch. Moreover, (2) selling calls on their individual stocks – that is, betting that the stocks in their long portfolio will fall – would reduce returns. They believe that their long portfolio is a collection of stocks superior to any index and so they don’t want to hedge away any of their stock-specific upside. By managing their options overlay, the team can react to changes in the extent to which their investors are exposed to the stock markets movements. At base, as they sell more index options, they reduce the degree to which the fund is exposed to the market. Their plan is to keep net market exposure somewhere in the range of 35-65%, with a 50% average and a healthy amount of income.

On whole, the strategy works.

The entire strategy has outperformed the S&P. Since inception, its returns have roughly doubled those of the S&P 500. It’s done so with modestly less volatility.

Throughout, it has sort of clubbed its actively-managed long-short peers. More significantly, it has substantially outperformed the gargantuan Gateway Fund (GATEX). At $7.8 billion, Gateway is – for many institutions and advisors – the automatic go-to fund for an options-hedged portfolio. It’s not clear to me that it should be. Here’s the long-term performance of Gateway (green) versus Gargoyle (blue):

GATEX

Two things stand out: an initial investment in Gargoyle fifteen years ago would have returned more than twice as much as the same investment at the same time in Gateway (or the S&P 500). That outperformance is neither a fluke nor a one-time occurrence: Gargoyle leads Gateway over the past one, three, five, seven and ten-year periods as well.

The second thing that stands out is Gargoyle’s weak performance in the 2008 crash. The fund’s maximum drawdown was 48%, between 10/07 and 03/09. The managers attribute that loss to the nature of the fund’s long portfolio: it buys stocks in badly dented companies when the price of the stock is even lower than the company’s dents would warrant. Unfortunately in the meltdown, those were the stocks people least wanted to own so they got killed. The fund’s discipline kept them from wavering: they stayed 100% invested and rebalanced monthly to buy more of the stocks that were cratering. The payback come in 2009 when they posted a 42% return against the S&P’s 26% and again in 2010 when they made 18% to the index’s 15%.

The managers believe that ’08 was exceptional, and note that the strategy actually made money from 2000-02 when the market suffered from the bursting of the dot-com bubble. Morty Schaja, president of River Park Funds, notes that “We are going to have meltdowns in the future, but it is unlikely that they will play out the same way as it did 2008 . . . a market decline that is substantial but lasts a long time, would play better for Gargoyle that sells 1-2% option premium and therefore has that as a cushion every month as compared to a sudden drop in one quarter where they are more exposed. Similarly, a market decline that experiences movement from growth stocks to value stocks would benefit a Gargoyle, as compared to a 2008.” I concur. Just as the French obsession with avoiding a repeat of WW1 led to the disastrous decision to build the Maginot Line in the 1930s, so an investor’s obsession with avoiding “another ‘08” will lead him badly astray.

What about the ETF option? Josh and Alan anticipate clubbing the emerging bevy of buy-write ETFs. The guys identify two structural advantages they have over an ETF: (1) they buy stocks superior to those in broad indexes, and (2) they manage their options portfolio moment by moment, while the ETF just sits and takes hits for 29 out of 30 days each month.

There’s evidence that they’re right. The ETFs are largely based on the CBOE S&P Buy-Write Index (BXM). Between 2000 and 2012, the S&P 500 returned 24% and the BXM returned 52%; the options portion of the Gargoyle portfolio returned 110% while the long portfolio crushed the S&P.

Nonetheless, investors need to know that returns are lumpy; it’s quite capable of beating the S&P 500 for three or four years in a row, and then trailing it for the next three or four. The fund’s returns are not highly correlated with the returns of the S&P 500; the fund may lose money when the index makes money, and vice versa. That’s true in the short term – it beat the S&P 500 during August’s turbulence but substantially trailed during the quieter July – as well as the long-term. All of that is driven by the fact that this is a fairly aggressive value portfolio. In years when value investing is out of favor and momentum rules the day, the fund will lag.

Bottom line

On average and over time, a value-oriented portfolio works. It outperforms growth-oriented portfolios and generally does so with lower volatility. On average and over time, an options overlay works and an actively-managed one works better. It generates substantial income and effectively buffers market volatility with modest loss of upside potential. There will always be periods, such as the rapidly rising market of the past several years, where their performance is merely solid rather than spectacular. That said, Messrs. Parker and Salzbank have been doing this and doing this well for decades. What’s the role of the fund in a portfolio? For the guys, it’s virtually 100% of their US equity exposure. In talking with investors, they discuss it as a substitute for a large-cap value investment; so if your asset allocation plan is 20% LCV, then you could profitably invest up to 20% of your portfolio in Gargoyle. Indeed, the record suggests “very profitably.”

Fund website

TCW/Gargoyle Hedged Value homepage. If you’re a fan of web video, there’s even a sort of infomercial for Gargoyle on Vimeo but relatively little additional information on the Gargoyle Group website.

Fact Sheet

© Mutual Fund Observer, 2015. All rights reserved. The information here reflects publicly available information current at the time of publication. For reprint/e-rights contact us.

Northern Global Tactical Asset Allocation (BBALX), March 2015

By David Snowball

This profile has been updated. Find the new profile here.

Objective

The fund seeks a combination of growth and income. Northern Trust’s Investment Policy Committee develops tactical asset allocation recommendations based on economic factors such as GDP and inflation; fixed-income market factors such as sovereign yields, credit spreads and currency trends; and stock market factors such as domestic and foreign earnings growth and valuations. The managers execute that allocation by investing in other Northern funds and ETFs. As of 12/30/2014, the fund held three Northern funds and eight ETFs.

Adviser

Northern Trust Investments is part of Northern Trust Corp., a bank founded in 1889. The parent company provides investment management, asset and fund administration, fiduciary and banking solutions for corporations, institutions and affluent individuals worldwide. As of June 30, 2014, Northern Trust had assets under custody of $6.0 trillion, and assets under investment management of $924.4 billion. The Northern funds account for about $52 billion in assets. When these folks say, “affluent individuals,” they really mean it. Access to Northern Institutional Funds is limited to retirement plans with at least $30 million in assets, corporations and similar institutions, and “personal financial services clients having at least $500 million in total assets at Northern Trust.” Yikes. There are 42 Northern funds, nine sub-advised by multiple institutional managers.

Managers

Daniel Phillips, Robert Browne and James McDonald. Mr. Phillips joined Northern in 2005 and became co-manager in April, 2011. He’s one of Northern’s lead asset-allocation specialists. Mr. Browne joined as chief investment officer of Northern Trust in 2009 after serving as ING’s chief investment officer for fixed income. Mr. McDonald, Northern Trust’s chief investment strategist, joined the firm in 2001. This is the only mutual fund they manage.

Management’s Stake in the Fund

Northern Trust representatives report that, “that the SAI update will show Bob Browne and Jim McDonald each own BBALX shares in the $100,001-$500,000 range, and Daniel Phillips owns shares in the $1-$10,000 range.” Only one of the fund’s nine trustees has invested in it, though most have substantial investments across the fund complex. 

Opening date

Northern Institutional Balanced, this fund’s initial incarnation, launched in July 1, 1993. On April 1, 2008, this became an institutional fund of funds with a new name, manager and mission and offered four share classes. On August 1, 2011, all four share classes were combined into a single no-load retail fund.

Minimum investment

$2500, reduced to $500 for IRAs and $250 for accounts with an automatic investing plan.

Expense ratio

0.64%, after waivers, on assets of $79 million.

Comments

When we reviewed BBALX in 2011 and 2012, Morningstar classified it as a five-star moderate allocation fund. We made two points:

  1. It’s a really intriguing fund
  2. But it’s not a moderate allocation fund; you’ll be misled if you judge it against that group.

Here we are in 2015, following up on BBALX. Morningstar now classifies it as a two star moderate allocation fund. We’d like to make two points:

  1. It’s a really intriguing fund.
  2. But it’s not a moderate allocation fund; you’ll be misled if you judge it against that group.

We’ll take those points in order.

It’s a really intriguing fund. As the ticker implies, BBALX began life is a bland, perfectly respectable balanced fund that invests in larger US firms and investment grade US bonds. Northern’s core clientele are very affluent people who’d like to remain affluent, so Northern tends toward “A conservative investment approach . . . strength and stability . . . disciplined, risk-managed investment . . .” which promises “peace of mind.” The fund was mild-mannered and respectable, but not particularly interesting, much less compelling.

In April 2008, the fund morphed from conservative balanced to a global tactical fund of funds. At a swoop, the fund underwent a series of useful changes.

The strategic or “neutral” asset allocation became more aggressive, with the shift to a global portfolio and the addition of a wide range of asset classes.

Tactical asset allocation shifts became possible, with an investment committee able to substantially shift asset class exposure as opportunities changed.

Execution of the portfolio plan was through index funds and, increasingly, factor-tilted ETFs, mostly Northern’s FlexShare products. For any given asset class, the FlexShare ETFs modestly overweight factors such as dividends, quality and size which predict long-term outperformance.

Both the broadened strategic allocation and the flexibility of the tactical shifts have increased shareholder returns and reduced their risk. Compared to a simple benchmark of 60% global stocks/40% bonds, the strategic allocation adds about 50 basis points of return (4.4% vs 3.9, since inception) while reducing volatility by about 70 bps (11.6% versus 12.3%). The tactical shifts have produced dramatic improvements, adding 110 bps of return while trimming 100 bps of volatility.

trailing

In short, Northern has managed since inception to produce about 40% more upside than a global balanced benchmark while suffering about 15% less volatility.

But it’s not a moderate allocation fund. Morningstar’s moderate allocation group is dominated by funds like the pre-2008 BBALX; lots of US large caps, lots of intermediate term, investment grade bonds and little prospect for distinction. That’s an honorable niche but it is not a fair benchmark for BBALX. A quick comparison of the portfolios highlights the difference:


BBALX

Moderate Allocation Group

U.S. equity

19%

47

Developed non U.S. equity

15

10

Emerging markets

5

1.5

Bonds

43

31

“Other” assets, which might include commodities, global real estate, gold, and other real asset plays

17

2

Cash

1

7

Average market cap

$15 billion

$46 billion

Dividend yield

3.3%

2.2%

When US markets dominate, as they have in four of the past five years, funds with a strong home bias will typically outperform those with a global portfolio.

With BBALX, you get a truly global asset allocation, disciplined management and remarkably low operating and trading expenses.

Over longer period, the larger opportunity set available to global investors – assuming that they’re not offset by higher expenses – gives them a distinct and systemic advantage. With BBALX, you get a truly global asset allocation, disciplined management and remarkably low operating and trading expenses. 

The strength of the fund is more evident when you make more valid comparisons. Morningstar purports to offer up “the best of the best of the best, sir!” in the form of the Gold-rated funds and its “best of the best of the rest” in its Silver funds. Using the Observer’s premium Multisearch Tool, we generated a comparison of BBALX against the only Gold fund (BlackRock Global Allocation) and the four Silver funds in Morningstar’s global allocation group.

Over both the full market cycle (November 2007-present) and the upmarket cycle (March 2009-present), BBALX is competitive with the best global allocation funds in existence. Here are the full-cycle risk-return metrics:

full cycle risk return

Here’s how to read the table: the three ratios at the end measure risk-adjusted returns. For them, higher is better. The Maximum Drawdown, Downside Deviation and Ulcer Indexes are measures of risk. For them, lower is better. APR is the annual percentage return. In general, your best investments over the period – the GMO funds – aren’t available to mere mortals, they require minimum investments of $10 million. Northern has been a better investment than either BlackRock or Capital Income Builder.

The pattern is similar if we look just at the rebound from the market bottom in 2009. Ivy, not available in 2007, gets added to the mix. GMO leads while BBALX remains one of the best options for retail global investors.

since 09

In short, the fund’s biggest detriment is that it’s misclassified, not that it’s underperforming.

Bottom Line

There is a very strong case to be made that BBALX might be a core holding for two groups of investors. Conservative equity investors will be well-served by its uncommonly broad diversification, risk-consciousness and team management. Young families or investors looking for their first equity fund would find it one of the most affordable options, no-load with low expenses and a $250 minimum initial investment for folks willing to establish an automatic investment plan. Frankly, we know of no comparable options. This remains a cautious fund, but one which offers exposure to a diverse array of asset classes. It has used its flexibility and low expenses to outperform some very distinguished competition. Folks looking for an interesting and affordable core fund owe it to themselves to add this one to their short-list.

Fund website

Northern Global Tactical Asset Allocation.  Northern has an exceptional commitment to transparency and education; they provide a lot of detailed, current information about what they’re up to in managing the fund. A pretty readable current introduction is 2015 Outlook: Watching our Overweights (12/2014).

Disclosure:

I have owned shares of BBALX in my personal portfolio for about three years. My intent is to continue making modest, automatic monthly additions.

© Mutual Fund Observer, 2015. All rights reserved. The information here reflects publicly available information current at the time of publication. For reprint/e-rights contact us.

TrimTabs Float Shrink ETF (TTFS), Feburary 2015

By Charles Boccadoro

This fund has been liquidated.

Objective and Strategy

The AdvisorShares TrimTabs Float Shrink ETF (TTFS) objective is to generate long-term gains in excess of the Russell 3000 Index, which measures the performance of the largest 3000 U.S. companies representing approximately 98% of the investable U.S. equity market.

The fund’s actively managed strategy is to exploit supply-and-demand opportunities created when companies repurchase shares in a manner deemed beneficial to shareholders. More specifically, the fund seeks to own companies that are buying-back shares with free cash flow while not increasing debt. Such buy-backs benefit shareholders in a couple ways. First, they reduce float, which is the number of regular shares available to the public for trading. “All else being equal,” the reasoning goes, “if the same money is chasing a smaller float, then the share price increases.” Second, they signal that top company insiders see value in their own stock, opportunistically at least.

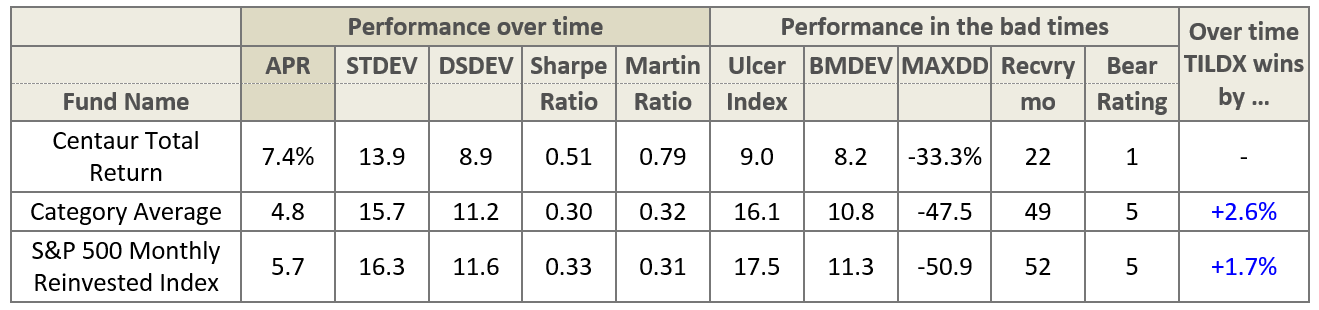
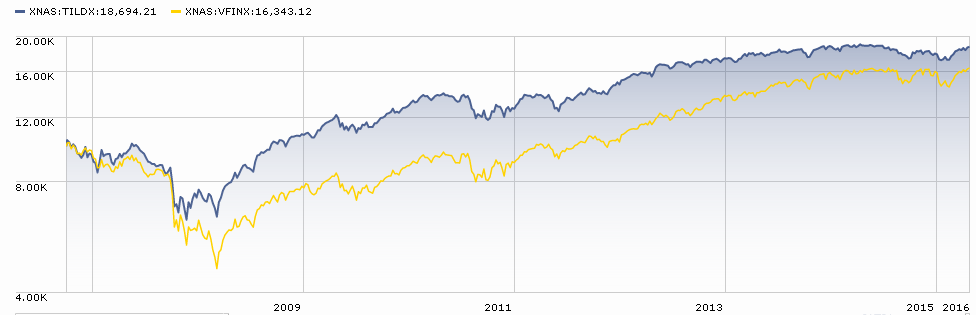
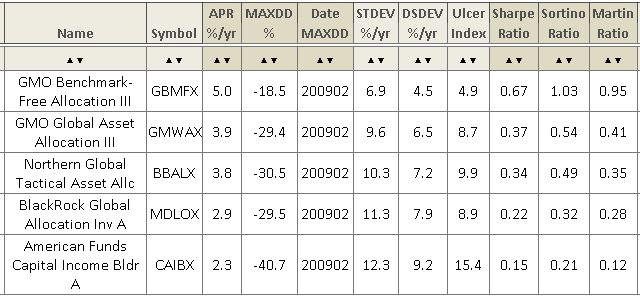
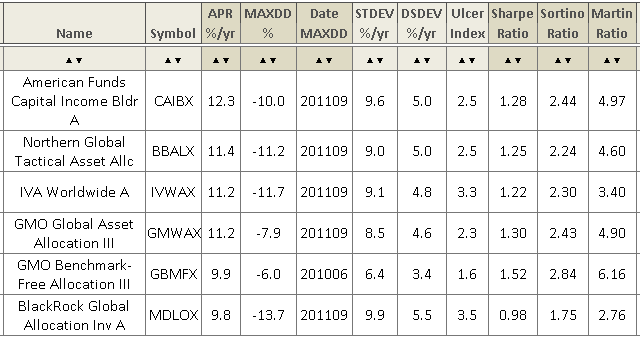
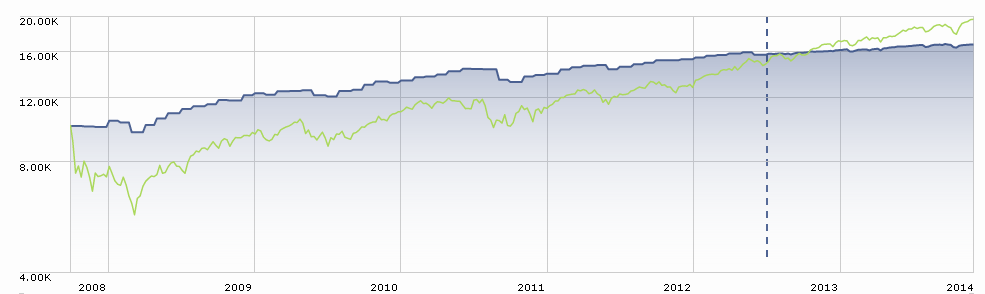
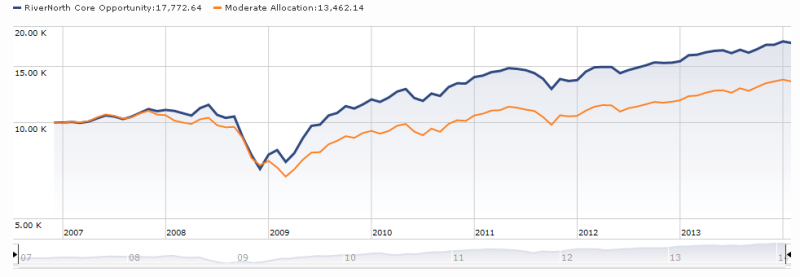
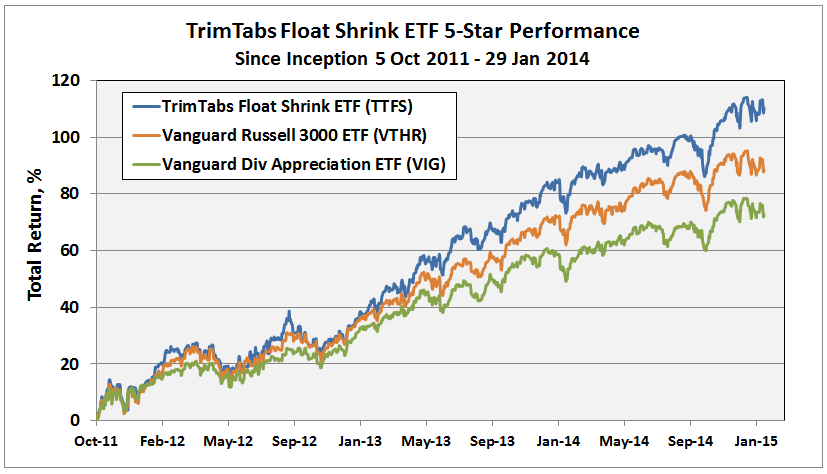
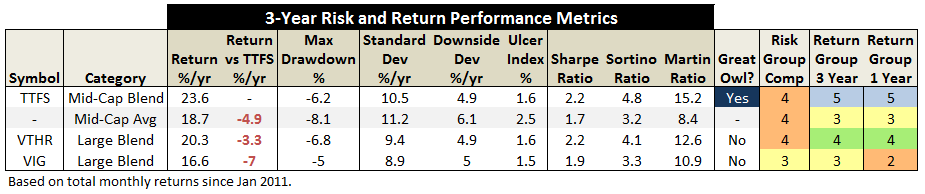
So far, the strategy has delivered superbly. Last November, TTFS past its three year mark and received Morningstar’s 5-Star quantitative rating and MFO’s Great Owl designation. TTFS rewarded investors with significantly higher absolute return and lower volatility than its category average of 134 peers. It also bested Vanguard’s Russell 3000 Index ETF (VTHR) and Vanguard’s Dividend Appreciation ETF (VIG). Here’s snapshot of return since inception with accompanying table of 3-year metrics (ref. Ratings Definitions):

TTFS_1

TTFS_2

Adviser

AdvisorShares is the fund adviser for TTFS. It’s based in Bethesda, Maryland. It maintains the statutory trust for a lineup of 20 disparate ETFs with an almost equal number of subadvisers. The ETFs have collectively gathered about $1.3B in assets. All 20 are under five years of age. Of the 10 at the 3-year mark, 9 have delivered average to bottom quintile performance. The younger 10 have similarly dismal numbers at the 1-year mark or since inception. The firm generally charges too much and delivers too little for me to recommend. There is perhaps one exception.

TrimTabs Asset Management, LLC is the subadviser and portfolio manager for TTFS. A small company with half a dozen employees located in Salsilitdo, California, a waterfront town just north of the Golden Gate Bridge. The subadviser manages about $184M AUM, all through its one ETF. It has no separately managed accounts.

The subadviser is a subsidiary of TrimTabs Investment Research, Inc., which tracks money flows of stock markets, mutual funds, hedge funds, and commodity traders, as well as corporate buy-backs, new offerings, and insider trading. The research company sells its data and research reports through paid subscription to hedge funds and financial institutions. It briefly ran its own hedge fund in 2008, called TrimTabs Absolute Return Fund, LP.

The name “trim tab” refers to the small control effector found on the main rudder of a ship or plane. Like the trim tab helps the main rudder steer its vehicle through application of a small force at the right location, so too does the company hope to aid its subscribers and investors through insight provided by its data into market behavior. The company hopes TTFS’s recent success will enable it to offer new ETFs as an adviser proper.

Managers

The portfolio managers are Charles Biderman and Minyi Chen.

Charles Biderman founded TrimTabs in 1990 and remains its CEO. He holds a B.A. from Brooklyn College and an M.B.A. from Harvard Business School. He co-authored the Wiley book “TrimTabs Investing: Using Liquidity Theory to Beat the Stock Market” in 2005. It scores mixed reviews, but it forms the basis for principles followed by TTFS.

His bio touts that he is “interviewed regularly on CNBC and Bloomberg and is quoted frequently in the financial media…” He does indeed appear to be the TV media spokesman and frontman for the firm and ETF. His views are contrarian and his appearances seem to be a flashpoint for debate. But his record at predicting the future based on those views is spotty at best. A few examples:

  • In September 2006 on Squawk Box, he was bullish on US economy based on strong take home pay and company buy-backs.
  • In September of 2007 on CNBC, he predicted the credit problems were short-lived.
  • In summer of 2010, he warned multiple times of an imminent collapse in US market (eg., Fox, CNBC, and via webpost).
  • In 2012, he again predicted a 50% market collapse.

More recently on Squawk Box, his contrarian views on what drives markets seemed to resonate with Joe Kernen’s own speculation about potential for conspiracy theory regarding wealth distribution and the Fed’s role in it.

He maintains Biderman’s Money Blog and the online course Biderman’s Practices of Success, which are based upon ontological training (the science of being present to life). Course proceeds go to support foster youth. Both activities are based on Mr. Biderman’s personal opinions and do not reflect the opinions of TrimTabs proper.

Minyi Chen, on the other hand, appears to be the ideal inside person, handling day-to-day operation of the ETF and answering more detailed questions on the fund’s back-testing and methodology. He appears to be the “yin” and to his co-manager’s “yang.” He joined TrimTabs Investment Research in 2008 and serves as its Chief Operating Officer and Chief Financial Officer. Mr. Chen holds a B.A. from Shanghai International Studies University in China and a M.B.A from Northwestern Polytechnic University in California. He is a Chartered Financial Analyst (CFA) charterholder. He speaks English and Chinese.

I first interviewed him last fall during the Morningstar ETF Conference. He’s soft spoken with a reserved but confident demeanor. He answers questions about the fund in direct and simple terms. He explains that there is “no human input” in the implementation of TTFS’s strategy. It follows a stable, rules-based methodology. When asked about the buzz surrounding “strategic beta” at the conference, he stated “I would rather have strategic alpha.”

Strategy capacity and closure

Minyi estimates the fund’s capacity at $5B and is only limited by trading volume of the underlying stocks. He explains that the fund invests in 100 stocks from the Russell 3000 membership, which has an average market cap of $110B and a median market cap of $1.5B. The fund must be able to buy-and-sell stocks that trade frequently enough to not be adversely impacted with trades of 1/100th of its AUM. When the fund launched in 2011 with $2M in AUM, virtually all 3000 stocks traded at sufficient liquidity. At today’s AUM, which is closer to $200M, 25-30 of the benchmark’s more illiquid stocks can’t handle a $2M daily buy/sell order and are screened-out. ETFs can’t be closed, but the larger the AUM, the more restricted the application of its strategy…but any significant impact is still a long way off.

Active share

TrimTabs does not maintain an “active share” statistic, which measures the degree to which a fund’s portfolio differs from the holdings of its benchmark portfolio. Given that TTFS’s benchmark is the Russell 3000 and cap-weighted, I’d be surprised if its active share was not near 80% or higher.

Management’s Stake in the Fund

As of December, 2014, the SAI filing indicates Mr. Biderman has between $100-500K and Mr. Chen between $10-50K in the fund. Direct correspondence with the firm indicates that the actual levels are closer to the minimums of these brackets. The adviser appears to have only one trustee with a stake in the fund somewhere between $1 and $10K.

On Mr. Biderman’s website, he states “I am someone who started with nothing three times and created three multi-million dollar net worths.” If accurate, his modest stake in TTFS gives pause. The much younger Mr. Chen states that his investment is a substantial part of his 401K. As for AdvisorShares, its consistent lack of direct investment by its interested and independent trustees in any of the firm’s offerings never ceases to disappointment.

Opening date

October 04, 2011. TTFS’s strong performance since inception has attracted close to $200M, an impressive accomplishment given the increasingly crowded ETF market. Among actively managed ETFs across Moningstar’s 3×3 category box, TTFS is second in AUM only to Cambria Shareholder Yield ETF (SYLD), and has more than twice the AUM of its next closest competitor iShares Enhanced US Large-Cap (IELG).

Minimum investment

TTFS is an ETF, which means it trades like a stock. At market close on January 29, 2015, the share price was $55.07.

Expense ratio

0.99%. There is no 12b-1 fee. The annual 0.99% reflects a contractually agreed cap, but is still above average for actively managed ETFs.

The fee to the subadviser is 0.64%.

Minyi cannot envision its expense ratio ever exceeding 0.99%; in fact, he states that as AUM increases, TrimTabs will approach AdvisorShares to reduce fee. He also states that TrimTabs avoids conflict of interest by having no soft dollars in the TTFS fee structure. [See SEC Report and recent ValueShares US Quantitative Value (QVAL) profile.]

Comments

Many legendary investors, like Howard Marks, believe that the greatest gains come from buying when everybody else is selling. Since doing so can be extremely uncomfortable, investors must have a confident view of intrinsic value calculation. While this sounds reasonable, comforting, and even admirable, the folks at TrimTabs believe that such a calculation is simply not possible. They argue:

Most fundamental investment approaches, such as the discounted cash flow method, attempt to calculate a company’s intrinsic value. Investors attempt to exploit discrepancies between intrinsic value and the market value. The problem with these approaches is that it is impossible to know exactly what intrinsic value is.

If you have ever worked through discounted cash flow valuation methods, like those described in Aswath Damorarn’s definitive Wiley book “Investment Valuation…Tools and Techniques for Determining the Value of Any Asset,” you can quickly see their point. With so many variables and assumptions involved, including estimates of terminal value 10 years out, the “fair value” calculation can become 1) simply a means to rationalize the price you are willing to pay, and 2) a futile exercise similar to measuring a marshmallow with a micrometer.

In his many interviews, Mr. Biderman argues that “valuation has never been a good predictor of stock price.” Vanguard’s 2012 study “Forecasting stock returns: What signals matter, and what do they say now?” seems to back his position (the study was highlighted by MJG during a debate on the MFO Discussion Board):

Although valuations have been the most useful measure…even they have performed modestly, leaving nearly 60% of the variation in long-term returns unexplained. What predictive power valuations do have is further clouded by our observation that different valuations, although statistically equivalent, can produce different “point forecasts” for future stock returns.

Minyi uses the recent price collapse in oil to illustrate the firm’s position that “instead of guessing about intrinsic value, we contend that the prices of stocks, like the prices of other tradable goods, are set by the underlying conditions of supply and demand.”

The three principles TrimTabs uses to guide its TTFS portfolio selection follow:

  1. Float shrink: Invest in companies that reduce their float over time. Most companies shrink the float through stock buybacks, but companies can also reduce the float by taking other actions, such as reverse stock splits or spin-offs.
  2. Free cash flow: Invest in companies that shrink the float because their underlying business is profitable, not because they are divesting assets.
  3. Leverage: Do not invest in companies that simply swap equity for debt. Such exchanges do not add real value because the risk of equity capital rises when the proportion of debt capital grows.

To implement the strategy, TrimTabs calculates a so-called “liquidity score” for each of the Russell 3000 companies, after screening out those whose trading volumes are too low. Their back-tests from September 20, 2000 through November 17, 2011 showed that risk-adjusted returns were strongest when the composite liquidity score used 60% weight on float, 30% weight on free cash flow, and 10% weight on leverage. The three input metrics are measured over the most recent 120-day trading window.

In a nutshell, start with the 3000 names, screen-out least liquid stocks based on current AUM, rank the remaining with a composite liquidity score, invest in the top 100 names equal dollar amounts.

A few other considerations…

TrimTabs argues that their expertise, their foundation and edge, comes from two decades of experience researching money flows in markets and providing these data to hedge funds, investment banks, and trading desks. Today, TrimTabs is able to rapidly and accurately distill this information, which comes from 10K and 10Q filings, company announcements, and other sources, into an actionable ETF strategy.

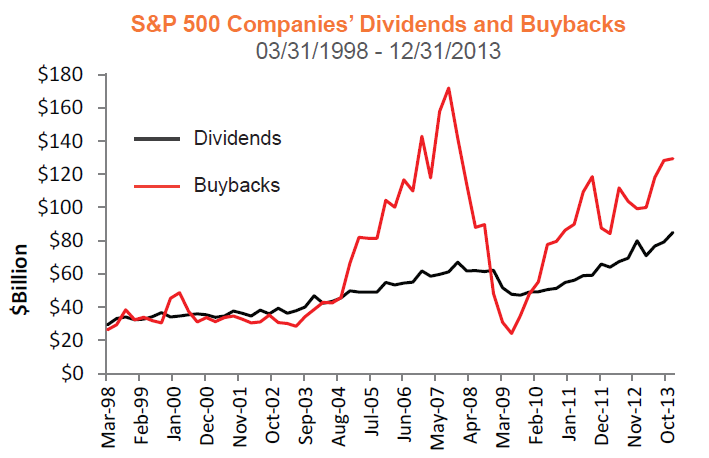
Since the late 1990’s, companies have been spending more of their free cash flow on buy-back than dividends. In his 2013 book “Shareholder Yield:  A Better Approach to Dividend Investing,” Mebane Faber attributes some of the rational to SEC Rule 10b-18 established in 1982, which provides safe harbor for firms conducting share repurchases from stock manipulation charges. More recently, Mr. Biderman argues that the Fed’s zero interest policy encourages buy-backs and that companies are not seeing enough demand to invest instead in capital expenditure. Whatever the motivation, there is no arguing that buy-backs have become the norm and reducing float raises earnings per share. Here is a plot from a recent TrimTabs white paper that compares quarterly dividends and buybacks since 1998:

TTFS_3

In a table of S&P 500 buy-backs provided by TrimTabs when requesting an interview before the Morningstar conference, about 300 companies (more than half) had reduced float during the previous year. Some 15 had reduced float by more than 10%, including CBS, Viacom (VIAB), ADT, Hess (HES), Corning (GLW), FedEx (FDX) and Northrop Grumman (NOC). Other big names with healthy buy-backs were Kellogg (K), Weyerhaeuser (WY), Travelers (TRV), Gap (GPS), IBM, Coca-Cola (CCE), Dollar Tree (DLTR), Express Scripts (ESRX) and WellPoint (WLP).

The firm believes metrics like float shrink, free cash flow, and leverage are less subject to accounting manipulation than other metrics used in traditional fundamental analysis; furthermore, companies that can buy-back shares, while simultaneously increasing free cash flow and decreasing debt are essentially golden.

Minyi explains that the strategy pursues companies with the highest composite liquidity score regardless of market cap or sector diversification, because “that’s where the alpha is.” For example, as of month ending December 2014, the portfolio was heavy consumer discretionary and light energy versus the benchmark. (The methodology does impose a 25% ultimate sector concentration limit for regulatory reasons, but that limit has never been reached since inception or in back-tests.) Similarly, TTFS held more mid-cap companies that its benchmark.

The turnover, while reducing as buy-backs increase, is high. It was 200% in 2014, down from 290% in 2013. But ETFs seem to enjoy a more friendly tax treatment than mutual funds, since they create and redeem shares with in-kind transactions that are not considered sales. (It’s something I still do not completely understand.) Sure enough, TTFS had zero short- and long-term cap-gains distributions for 2014.

Bottom Line

TTFS employs a rather unique and unconventional strategy that seems to have tapped current trends in the US stock market. It’s enabled by years of research in monitoring and providing data on money flows of markets.

Critics of the approach argue that buy-backs are not always a prudent use of capital, as evidenced by the massive amount of buy-backs in 2007 at elevated prices. And, as impressive as this young fund’s performance has been, it has existed only during bull market conditions.

I find the strategy intriguing and Minyi Chen instills confidence that it’s prosecuted in a transparent, easily understood and pragmatic manner. But the fund’s formal advisor is uninspired and only provides a drag on performance by adding an additional level of fees. There appears to be little “skin in the game” among stakeholders. And the fund’s most public spokesman warns often of imminent market collapse, seemingly undermining company attempts to grow AUM in the long-only portfolio.

Some investors care only about “listening to the market” in order to make money. They could care less about more qualitative assessments of a fund’s merits, like parent company, expenses, stewardship, or even risk-adjusted measures. A classic book on the topic is Ned Davis’ “Being Right or Making Money.”

So far, TTFS is making money for its shareholders.

I for one will wait with interest to see how the subadviser evolves to take advantage of its recent success.

Fund website

AdvisorShares maintains a webpage for TTFS here. To get quarterly commentaries, free registration is required. TrimTabs website offers little insight and is more geared toward selling database and newsletter subscriptions.

Fact Sheet

© Mutual Fund Observer, 2015. All rights reserved. The information here reflects publicly available information current at the time of publication. For reprint/e-rights contact us.

RiverPark Structural Alpha Fund (RSAFX/RSAIX), December 2014

By David Snowball

This fund has been liquidated.

Objective and strategy

The RiverPark Structural Alpha Fund seeks long-term capital appreciation while exposing investors to less risk than broad stock market indices. The managers invest in a portfolio of listed and over-the-counter option spreads and short option positions that they believe structurally will generate exposure to equity markets with less volatility. They also maintain a short position against the broad stock market to hedge against a market decline and invest the majority of their assets in cash alternatives and high quality, short-term fixed income securities.

Adviser

RiverPark Advisors, LLC. RiverPark was formed in 2009 by former executives of Baron Asset Management. The firm is privately owned, with 84% of the company being owned by its employees. They advise, directly or through the selection of sub-advisers, the seven RiverPark funds. Overall assets under management at the RiverPark funds were over $3.5 billion as of September, 2014.

Manager

Jeremy Berman and Justin Frankel. The managers joined RiverPark in June 2013 when their Wavecrest Partners Fund was converted into the RiverPark Structural Alpha Fund. Prior to co-founding Wavecrest, Jeremy managed Morgan Stanley’s Structured Solutions group for eastern US; prior to that he held similar positions at Bank of America and JP Morgan. Before RiverPark and Wavecrest, Mr. Frankel managed the Structured Investments business at Morgan Stanley. He began his career on the floor of the NYSE, became a market maker for a NASDAQ, helped Merrill Lynch grow their structured products business and served as a Private Wealth Advisor at UBS. They also graduated from liberal arts colleges (hah!).

Strategy capacity and closure

Something on the order for $3-5 billion. The derivatives market is “incredibly liquid,” so that the managers could accommodate substantially more assets by simply holding larger positions. Currently they have about 35 positions; by their calculation, a 100-fold increase in assets could be accommodated with a doubling of the number of positions. The unique nature of this market means that “more positions would decrease volatility without impinging returns. Given our portfolio structure, there’s no downside to growth.”

Active share

Not calculable for this sort of fund.

Management’s stake in the fund

Each of the managers has between $100,000 – 500,000 in the fund, as of the January 2014 Statement of Additional Information. RiverPark’s president is the fund’s single biggest shareholder; both he and the managers have been adding to their holdings lately. Two of the fund’s three trustees have substantial investments in the fund, which is particularly striking since they receive modest compensation for their work as trustees. In broad terms, they’ve invested hundreds of thousands more than they’ve received.

We’d also like to compliment RiverPark for exemplary disclosure: the SEC allows funds to use “over $100,000” as the highest report for trustee ownership. RiverPark instead reports three higher bands: $100,000-500,000, $500,000-1 million, over $1 million. That’s really much more informative than the norm.

Opening date

June 28, 2013, though the preceding limited partnership launched on September 26, 2008.

Minimum investment

The minimum initial investment in the retail class is $1,000 and in the institutional class is $100,000.

Expense ratio

Retail class at 2.00% after waivers, institutional class at 1.75% after waivers, on total assets of $9.1 million. While that is high in comparison to traditional stock or bond funds, it’s competitive with other alt funds and cheap by hedge fund standards. If Wavecrest’s returns were recalculated assuming this expense structure, they’d be 2.0 – 2.5% higher than reported.

Comments

It’s time to get past having one five-word phrase, repeated out of context, define your understanding of an options-based strategy. In his 2002 letter, Warren Buffett described derivatives as (here are the five words): “financial weapons of mass destruction.” Set aside for the moment the fact that Buffett invests in derivatives and has made hundreds of millions of dollars from them and take time to read his original letter on the matter. His indictment was narrowly focused on uncollateralized positions and Buffett now has backed away from his earlier statement (“I don’t think they’re evil per se. It’s just, they, I mean there’s nothing wrong with having a futures contract or something of the sort”). His latest version of the warning is couched in terms of what happens to the derivatives market if there’s a nuclear strike or major biological weapons attack.

I suspect that Messrs. Berman and Frankel would agree that, in the case of a nuclear attack, the derivatives market would be in trouble. As would the stock markets. And my local farmer’s market. Indeed, all of us would be in trouble.

Structural Alpha is designed to address a far more immediate challenge: where should investors who are horrified by the prospects of the bond market but are already sufficiently exposed to the stock market turn for stable, credible returns?

The managers believe that have found an answer which is grounded in one of the enduring characteristics of investor (read: “human”) psychology. We hate losing and we have an almost overwhelming fear of huge losses. That fear underlies our willingness to overpay for car, life, homeowners or health insurance for decades (the average US house suffers one serious fire every 300 years, does that make you want to drop your fire coverage?) and is reflected in the huge compensation packages received by top insurance company executives (the average insurance CEO pockets $8 million/year, the CEO of Aetna took in $30 million). They make that money because risk is overpriced.

Berman and Frankel found the same is true for volatility. Investors are willing to systematically overpay to manage the risks that make them most anxious. A carefully structured portfolio has allowed Structural Alpha and its predecessor limited partnership to benefit from that risk aversion, and to offer several distinctive advantages to their investors.

Unlike an ETF or other passive product, this is not simply a mechanical collection of options. The portfolio has four complementary components whose weighting varies based on market conditions.

  1. Long-dated options which rise as the stock market does. The amount of the rise is capped, so that the fund trades away the prospect of capturing all of a bull market run in exchange for consistent returns in markets that are rising more normally.
  2. Short-dated options (called “straddles and strangles,” for reasons that are beyond me) which are essentially market neutral; they generate income and contribute to alpha in stable or range-bound markets.
  3. A short position against the stock market, designed to offset the portfolio’s exposure to market declines.
  4. A lot of high-quality, short-term fixed income products. Most of the fund’s portfolio is in cash, which serves as collateral on its options. Investing that cash carefully generates a modest, consistent stream of income.

Over the better part of a full market cycle, the Structural Alpha strategy captured 80% of the stock index’s returns – the strategy gained about 70% while the S&P rose 87% – while largely sidestepping any sustained losses. On average, it captures about 20% of the market’s down market performance and 40% of its up market. The magic of compounding then works in their favor – by minimizing their losses in falling markets, they have little ground to make up when markets rally and so, little by little, they catch up with a pure equity portfolio.

Here’s what that looks like:

riverpark

The blue line is Structural Alpha (you’ll notice it largely ignoring the 2008 crash) and the green line is the S&P 500. The dotted line is the point that Wavecrest became RiverPark. From inception, this strategy turned $10,000 into $16,700 with very low volatility while the S&P reached $19,600.

The chart offers a pretty clear illustration of the managers’ goal: providing equity-like returns (around 9% annually) with fixed income-like volatility (around 30% of the stock market’s).

There are two other claims worth considering:

  1. The fund benefits from market volatility, since the tendency to overpay rises as anxiety does.
  2. The fund benefits from rising interest rates, since its core strategies are uncorrelated with the bond market and its cash stash benefits from rising rates.

Mr. Frankel notes that “if volatility and interest rates return to their historic means, it’s going to be a significant tailwind for us. That’s part of the reason we’re absolutely buying more shares for our own accounts.” That’s a rare combination.

Bottom Line

Fear causes us to act poorly. This is one of the few funds designed to allow you to use other’s fears to address your own. It seems to offer a plausible third path to reasonable returns, away from and independent of traditional but historically overpriced asset classes. Investors looking to lighten their bond exposure or dampen their equity portfolio owe it to consider Buffett’s actions rather than just his words. They should look closely here.

Fund website

RiverPark Structural Alpha. The managers lay out the research behind the strategy in The Benefits of Systematically Selling Volatility (2014), which is readable and well worth reading. If you’d like to listen to a précis of the strategy, they have a cute homemade video on the fund’s webpage. Start listening at about the 4:00 minute mark through to about 6:50. They make a complex strategy about as clear as anyone I’ve yet heard. The stuff before 4:00 is biography and the stuff afterward is legalese.

Fact Sheet

© Mutual Fund Observer, 2014. All rights reserved. The information here reflects publicly available information current at the time of publication. For reprint/e-rights contact us.

Martin Focused Value (MFVRX)

By David Snowball

Update: This fund has been liquidated.

Objective and strategy

The Fund seeks to achieve long-term capital growth of capital by investing in an all-cap portfolio of undervalued stocks.  The managers look for three qualities in their portfolio companies:

  • High quality business, those companies that have a competitive advantage, high profit margins and returns on capital, sustainable results and/or low-cost operations,
  • High quality management, an assessment grounded in the management’s record for ethical action, inside ownership and responsible allocation of capital
  • Undervalued stock, which factors in future cash flow as well as conventional measures such as price/earnings and price/sales.

Mr. Martin summarizes his discipline this way: “When companies we favor reach what our analysis concludes are economically compelling prices, we will buy them.  Period.” If there are no compelling bargains in the securities markets, the Fund may have a substantial portion of its assets in cash or cash equivalents such as short-term Treasuries. The fund is non-diversified and has not yet had more than 9% in equities, although that would certainly rise if stock prices fell dramatically.

Adviser

Martin Capital Management (MCM), headquartered in Elkhart, IN.  Established in 1987, MCM has stated an ongoing commitment to a “rational, disciplined, concentrated, value-oriented investment philosophy.”  Their first priority is preservation of capital, but seek opportunities for growth when they find underpriced, but well-run companies. They manage about $160 million, roughly 10% of which is in their mutual fund.

Manager

Frank Martin is portfolio manager, as well as the founder and CIO of the adviser. A 1964 graduate of Northwestern University’s investment management program, Mr. Martin went on to obtain an MBA from Indiana University. He does a lot of charitable work, including his role as founder and chairman of the board of DreamsWork, a mentoring and scholarship program for inner-city children. Mr. Martin has published two books on investing, Speculative Contagion and A Decade of Delusions.  He’s assisted by a four person research team.

Strategy capacity and closure

Mr. Martin allows that the theoretical capacity is “pretty darn large,” but that having a fund that was big is “too distracting” from the work on investing so he’d look for a manageable portfolio size.

Active share

Not formally calculated but undoubtedly near 100, given a portfolio with just four stocks.

Management’s stake in the fund

Mr. Martin has invested over $1 million in the fund and, as of the early 2014, is the fund’s largest shareholder. No member of the board of directors has invested in the fund but then four of the six directors haven’t invested in any of the 18 funds they oversee. The firm’s employees invest in this strategy largely through separately managed accounts, which reflects the fact that the fund did not exist when his folks began investing. The portfolio is small enough that Mr. Martin knows many of his shareholders, five of whom own 35% of the retail shares between them.

Opening date

May 03, 2012

Minimum investment

$2,500 for an initial investment for retail shares. $100 minimum for subsequent investments.

Expense ratio

1.39%, after waivers, on about $15 million in assets (as of April 2014). There’s also an institutional share class (MFVIX) with an e.r. of 0.99% and a $100,000 minimum.

Comments

Absolute value investors are different.  These are guys who don’t want to live at the edge.  They take the phrase “margin of safety” very seriously.  For them, “risk” is about “permanent losses,” not “foregone gains.” They don’t BASE jump. They don’t order fugu. They don’t answer the question “I wonder if this will hold my weight?” by hopping on it.  They do drive, often in Volvos and generally within five MPH of the posted speed limit, to Omaha every May to hear The Word from Warren and fellowship with like-minded investors.

Unlike relative value and growth guys, they don’t believe that you hired them to pick the best stocks available.  They do believe you hired them to compose the best equity portfolio available.  The difference is that “the best equity portfolio” might well be one that, potentially for long periods, holds few stocks and huge amounts of cash.  Why? Because markets are neither efficient nor rational; they are the aggregated decisions of millions of humans who often move as herds and sometimes as stampeding herds.  Those stampedes – sometimes called manias or bubbles, sometimes simply frothy markets or periods of irrational exuberance – are a lot of fun while they last and catastrophic when they end.  We don’t know when they will end, but we do know that every market that overshoots on the upside is followed by one that overshoots on the downside.

In general, absolute value investors try to protect you from those entirely predictable risks.  Rather than relying on you to judge the state of the market and its level of riskiness, they act on your behalf by leaving early, sacrificing part of the gain in order to spare you as much of the pain as possible.

In general, that translates to stockpiling cash (or implementing some sort of hedging position) when stocks with absolutely attractive valuations are unavailable, in anticipation of being able to strike quickly on the day when attractively-priced stocks are again available.

Mr. Martin takes that caution one step further.  In addition to protecting you from predictable risks (“known unknowns,” in Mr. Rumsfeld’s parlance), he has attempted to create a portfolio that offers some protection against risks that are impossible to anticipate (“unknown unknowns” for Mr. Rumsfeld, “black swans” if you prefer Mr. Taleb’s term).  His strategy, also drawing from Mr. Taleb’s research, is to create an “antifragile” portfolio; that is, one which grows stronger as the stress on it rises.

Mr. Martin, a value investor with 40 years of experience, has won praise from the likes of Jack Bogle, Jim Grant and Edward Studzinski.  Earlier in his career, he ran fully-invested portfolios.  In the past 20 years, he’s become less willing to buy marginally-priced stocks and has rarely been more than 70% invested in the market.  With the launch of Martin Focused Value Fund in 2011, he moved more decisively into pursuing a barbell strategy in his portfolio, which he believes to be decidedly anti-fragile.  The bulk of the portfolio is now invested in short-term Treasuries while under 10% is in undervalued, high-quality equities.  In normal markets, the equities will provide much of the fund’s upside while the bonds contribute modest returns.  The portfolio’s advantage is that in market crises, panicked investors are prone to bid up the price of the ultra-safe bonds in his portfolio, giving him both downside protection and “dry powder” to deploy when stocks tank.

The result is a low volatility portfolio which has produced consistent results.  While his mutual fund is new, he’s been using the same discipline in private accounts and those investments have decisively outperformed the S&P this century. The following chart reflects the performance of those private accounts:

mcm

Those returns include the effects of some outstanding stock picking.  The equity portion of Mr. Martin’s portfolio returned 13.1% annually from 2000 – 2014Q1, while the S&P banked just 3.7% for the same period.  He and his analysts are, in short, really talented at picking stocks.  Over this same period, the composite had a standard deviation (a measure of volatility) of 3.4% while the S&P 500 bounced 12.3%, a difference of 350%.

Why might you want to consider a low-equity, antifragile portfolio?  Like many absolute value investors, Mr. Martin believes that we’re now seeing “a market that seems increasingly detached from its fundamental moorings.”  That’s a “known unknown.”  He goes further than most and posits the worrisome presence of an unknown unknown.  Here’s the argument: corporations can do one of four things with their income (technically, their free cash flow):

  1. They can invest in the business through new capital expenditures or by hiring new workers.
  2. They can give money back to their investors in the form of dividends.
  3. They can buy back shares of the corporation’s stock on the open market.
  4. They can acquire someone else’s company to add to the corporate empire.

Of these four activities, one and only one – re-investment – is consistently beneficial to a corporation’s long-term prospects.  It is also the one that least interests corporate leaders who are being pushed to maximize immediate stock returns; focusing on the long-term now poses a palpable risk of being dismissed if it causes short-term performance to lag.

Amazon’s chief and founder, Jeff Bezos, and Amazon’s stock are both being pounded in mid-2014 because Bezos stubbornly insists on pouring money into research and development and capital projects.  Amazon’s stock has fallen 25% YTD through May 1, an event that Bezos can survive when most other CEOs would fall.

“Since 2008, the proportion of cash flow invested in capital assets is the lowest on record” while both the debt to GDP ratio and the amount of margin debt (that is, money borrowed to speculate in the market) are at their highest levels ever. At the same time, the 100 largest companies in the U.S. have spent a trillion dollars buying back stock since 2008 while dividend payments in 2013 were 40% above their 10-year average; by Mr. Martin’s calculation, “90% of cash flow is being expended for purposes that don’t increase the value of most companies over the longer-term.”  In short, stock prices are rising steadily for firms whose futures are increasingly at risk.

His aim, then, is to build a portfolio which will, first, preserve investors’ wealth and then grow it over the course of a life.

Potential investors should note two cautions:

  1. They need to understand that double-digit returns will be relatively rare; his separate account composition had returns above 10% in four of 14 years from 2000-13.
  2. Succession planning at the firm has not yet born fruit.  At 71, Mr. Martin is actively, but so far unsuccessfully, engaged in a search for a successor.  He wants someone who shares his passion for long-term success and his willingness to sacrifice short-term gains when need be.  One simple test that he’s subjected candidates to is to look at whether their portfolios outperformed the S&P during the 2007-09 meltdown.  So far, the answer has mostly been “no.”

Bottom Line

There are some investors for whom this strategy is a very good fit, though few have yet found their way to the fund.  Folks who share Mr. Martin’s concern about the effects of perverse financial incentives (or even the growing risks of global technology that’s outracing our ability to comprehend, much less control, its consequences) should consider the fund.  Likewise investors who are trying to preserve wealth against the effects of inflation over decades would find a comfortable home here.  Folks who are convinced that they can outsmart the market, who are banking on double-digit rights and expect to out-time its gyrations are apt to be disappointed.

Fund website

www.martinfocusedvaluefund.com.  He’s got a remarkable body of writings at the fund website, but rather more at the main Martin Capital Management site.  His essays are well-written, both substantial and wide-ranging, sort of the antithesis of the usual marketing stuff that passes for mutual fund white papers.

Evermore Global Value (EVGBX), April 2014

By David Snowball


This profile has been updated. Find the new profile here.
This is an update of our profile from April 2011.  The original profile is still available.

Objective and Strategy

Evermore Global Value Fund seeks capital appreciation by investing in a global portfolio of 30-40 securities. Their focus is on micro to mid-cap. They’re willing “to dabble” in larger cap names, but it’s not their core. Similarly they may invest beyond the equity market in “less liquid” investments such as distressed debt. They’ve frequently held short positions to hedge market risk and are willing to hold a lot of cash.

Adviser

Evermore Global Advisors, LLC. Evermore was founded by Mutual Series alumni David Marcus and Eric LeGoff in June 2009. David Marcus manages the portfolios. While they manage several products, including their US mutual fund, all of them follow the same “special situations” strategy. They have about $400 million in AUM.

Manager

David Marcus. Mr. Marcus co-founded the adviser. He was hired in the late 1980s by Michael Price at the Mutual Series Funds, started there as an intern and describes himself as “a believer” in the discipline pursued by Max Heine and Michael Price. He managed Mutual European (MEURX) and co-managed Mutual Discovery (MDISX) and Mutual Shares (MUTHX), but left in 2000 to establish a Europe-domiciled hedge fund with a Swedish billionaire partner. Marcus liquidated this fund after his partner’s passing and spent several years helping manage his partner’s family fortune and restructure a number of the public and private companies they controlled. He then went back to investing and started another European-focused hedge fund. In that role he was an activist investor, ending up on corporate boards and gaining additional operational experience. That operational experience “added tools to my tool belt,” but did not change the underlying discipline.

Strategy capacity and closure

$2 – 3 billion, which is large for a fund with a strong focus on small firms. Mr. Marcus explains that he’s previously managed far larger sums in this style, that he’s willing to take “controlling” positions in small firms which raises the size of his potential position in his smallest holdings and raises the manageable cap. He currently manages about $400 million, including some separate accounts which rely on the same discipline. He’ll close if he’s ever forced into style drift.

Active share

100. “Active share” measures the degree to which a fund’s portfolio differs from the holdings of its benchmark portfolio.  High active share indicates management which is providing a portfolio that is substantially different from, and independent of, the index.  An active share of zero indicates perfect overlap with the index, 100 indicates perfect independence. The active share for Evermore is 100.6, which reflects extreme independence plus the effect of several hedged positions.

Management’s stake in the fund

Substantial. The fund provides all of Mr. Marcus’s equity exposure except for long-held legacy positions that predate the launch of Evermore. He’s slowly “migrating assets” from those positions to greater investments in the fund and anticipates that his holdings will grow substantially. His family, business partner and all of his employees are invested. In addition, he co-owns the firm to which he and his partner have committed millions of their personal wealth. It’s striking that one of his two outside board members, the guy who helped build the Oppenheimer Funds group, has invested more than a million in the fund (despite receiving just a few thousand dollars a year for his work with the fund). That’s incredibly rare.

Opening date

December 31, 2009.

Minimum investment

$5000, reduced to $2000 for tax-advantaged accounts. The institutional share class (EVGIX) has a $1 million minimum, no load and a 1.37% expense ratio.

Expense ratio

1.62%, on assets of $235 million. There’s a 5% sales load which, because of agreements with advisers and financial intermediaries, is almost never paid.

Comments

Kermit the Frog famously crooned (or croaked) the song “It’s Not Easy Being Green” (“it seems you blend in with so many other ordinary things, And people tend to pass you over”). I suspect that if Mr. Marcus were the lyricist, the song would have been “It’s Not Easy Being Independent.” By any measure, Evermore Global is one of the most independent funds around.

Everyone else wants to be Warren Buffett. They’re all about buying “a wonderful company at a fair price.”  Mr. Marcus is not looking for “great companies selling at a modest price.” There are, he notes, a million guys already out there chasing those companies. That sort of growth-at-a-reasonable price focus isn’t in his genes and isn’t where he can distinguish himself. He does, faithfully and well, what Michael Price taught him to do: find and exploit special situations, often in uncovered or under-covered smaller stocks. That predisposition is reflected in his fund’s active share: 100.6 on a scale that normally tops-out at 100.

An active share of 100 means that it has essentially no overlap with its benchmark. The same applies to its peer group: Evermore has seven-times the exposure to small- and micro-cap stocks as does its peers. It has half of the US exposure and twice the European exposure of the average global fund.  And it has zero exposure to three defensive sectors (consumer defensive, healthcare, utilities) that make up a quarter of the average global fund.

The fund focuses on a small number of positions – rarely more than 40 – that fall into one of two categories:

  1. Cheap with a catalyst: he describes this as a private-equity mentality where “cheap” is attractive only if there’s good reason to believe it’s not going to remain cheap. The goal is to find businesses that merely have to stop being awful in order to recruit a profit to their investors, rather than requiring earnings growth to do so. This helps explain why the fund is lightly invested in both Japan (cheap, few catalysts) and the U.S. (lot of catalysts, broadly overpriced).
  2. Compounders: a term that means different things to different investors. Here he means family owned or controlled firms that have activist internal management. Some of these folks are “ruthless value creators.”  The key is to get to know personally the patriarch or matriarch who’s behind it all; establish whether they’re “on the same side” as their investors, have a record of value creation and are good people.

Mr. Marcus thinks of himself as an absolute value investor and follows Seth Klarman’s adage, “invest when you have the edge; when you don’t have the edge, don’t invest.”

There are two real downsides to being independent: you’re sometimes disastrously out-of-step with the herd and it’s devilishly hard to find an appropriate benchmark for the fund’s risk-return profile.

Evermore was substantially out-of-step for its first three years. It posted mid-single digit returns in 2010 and 2012, and crashed in 2011.  2011 was a turbulent year in the markets and Evermore’s loss of nearly 20% was among the worst suffered by global stock funds. Mr. Marcus would ask you to keep two considerations in mind before placing too much weight on those returns:

  1. Special situations stocks are, almost by definition, poorly understood, feared or loathed. These are often battered or untested companies with little or no analyst coverage. When markets correct, these stocks often fall fastest and furthest. 
  2. Special situations portfolios take time to mature. By definition, these are firms with unusual challenges. Mr. Marcus invests when there’s evidence that the firm is able to overcome their challenges and is moving to do so (i.e., there’s a catalyst), but that process might take years to unfold. In consequence, it takes time for the underlying value to be unlocked. He argues that the stocks he purchased in 2010-11 were beginning to pay off in 2012 and, especially, 2013. In baseball terms, he believes he now has a solid line-up of mid- to late-inning names.

The upside of special situations investing is two-fold. First, mispricing in their securities can be severe. There are few corners of the market further from efficient pricing than this. These stocks can’t be found or analyzed using standard quantitative measures and there are fewer and fewer seasoned analysts out there capable of understanding them. Second, a lot of the stocks’ returns are independent of the market. That is, these firms don’t need to grow revenue in order to see sharp share-price gains. If you have a firm that’s struggling because its CEO is a dolt and its board is in revolt, you’re likely to see the firm’s stock rebound once the dolt is removed. If you have a firm that used to be a solidly profitable division of a conglomerate but has been spun-off, you should expect an abnormally low stock price relatively to its value until it has a documented operating history. Investors like Mr. Marcus buy them cheap and early, then wait for what are essentially arbitrage gains.

Bottom Line

There’s no question that Evermore Global Value is a hard fund to love. It sports a one-star Morningstar rating and bottom-tier three year returns. The question is, does that say more about the fund or more about our ability to understand really independent, distinctive funds? The discipline that Max Heine taught to Michael Price, that Michael Price (who consulted on the launch of this fund) taught to David Marcus, and that David Marcus is teaching to his analysts, is highly-specialized, rarely practiced and – over long cycles – very profitable. Mr. Marcus, who has been described as the best and brightest of Price’s protégés, has attracted serious money from professional investors. That suggests that looking beyond the stars might well be in order here.

Fund website

Evermore Global Value Fund. In general, when a fund is presented as one manifestation of a strategy, it’s informative to wander around the site to learn what you can. With Evermore, there’s a nice discussion under “Active Value” of Mr. Marcus’s experience as an operating officer and its relevance for his work as an investor.

© Mutual Fund Observer, 2014. All rights reserved. The information here reflects publicly available information current at the time of publication. For reprint/e-rights contact us.

RiverNorth Equity Opportunity (RNEOX), February 2014

By David Snowball

This fund has been liquidated.

Objective and Strategy

The Fund’s investment objective is overall total return consisting of long-term capital appreciation and income. They pursue their objective by investing in equities. The managers start with a tactical asset allocation plan that lets them know what sectors they’d like to have exposure to. They can gain that exposure directly, by purchasing common or preferred shares, but their core strategy is to gain the exposure through owning shares of closed-end funds and ETFs. Their specialty is in trading CEFs when those funds’ are selling at historically unsustainable discounts. The inevitable closure of those discounts provides a market-neutral arbitrage gain on top of any market gains the fund posts.

Adviser

RiverNorth Capital Management, LLC. RiverNorth, founded in 2000, specializes in quantitative and qualitative closed-end fund trading strategies and advises the RiverNorth Core Opportunity (RNCOX), RiverNorth/DoubleLine Strategic Income (RNDLX), RiverNorth Managed Volatility (RNBWX), and RiverNorth/OakTree High Income (RNHIX). As of January 2014, they managed $1.9 billion through limited partnerships, mutual funds and employee benefit plans.

Manager

Patrick W. Galley and Stephen O’Neill. Mr. Galley is RiverNorth’s President, Chairman and Chief Investment Officer. He also manages all or parts of four RiverNorth funds. Before joining RiverNorth Capital in 2004, he was a Vice President at Bank of America in the Global Investment Bank’s Portfolio Management group. Mr. O’Neill specializes in qualitative and quantitative analysis of closed-end funds and their respective asset classes. Prior to joining RiverNorth in 2007, he was an Assistant Vice President at Bank of America in the Global Investment Bank’s Portfolio Management group. Messrs Galley and O’Neill manage about $2 billion in other pooled assets.

Strategy capacity and closure

Not yet determined, but the broader RiverNorth Core Opportunity (RNCOX) fund using the same strategy closed at under $500 million.

Management’s Stake in the Fund

Mr. Galley has over $100,000 invested in the fund and owns 25% of the parent, RiverNorth Holdings Company. Mr. O’Neill has invested between $10,000 – $50,000 in the fund. One of the four independent directors has a small investment (under $10,000) in the fund.

Opening date

The original fund opened on July 18, 2012. The rechristened version opened on January 1, 2014.

Minimum investment

$5000

Expense ratio

Operating expenses are capped at1.60%, on assets of $13 million, as of January 2014. Like RiverNorth Core Opportunity, the fund also incurs additional expenses in the form of the operating costs of the funds it buys for the portfolio. Those expenses vary based on the managers’ ability to find attractively discounted closed-end funds; as the number of CEFs in the portfolio goes up, so does the expense ratio. RiverNorth estimates the all-in expense ratio to be about 2.17%.

Comments

Polonius, in his death scene, famously puts it this way:

Neither a borrower nor a lender be;
For loan oft loses both itself and friend,
And borrowing dulls the edge of husbandry.
This above all- to thine own self be true,
And it must follow, as the night the day,
Thou canst not then be false to any man.

Gramma Snowball reduced it to, “stick to your knitting, boy.”

It’s good advice. RiverNorth is following it.

RiverNorth’s distinctive strength is their ability to exploit the pricing dislocations caused by short-term irrationality and panic in the market. Their investment process has two basic elements:

  1. Determine where to invest
  2. Determine how to invest.

RiverNorth uses a number of quantitative models to determine what asset allocation to pursue. In the case of RNEOX, that comes down to determining things like size and sector.

They implement that allocation by investing either through low cost ETFs or through closed-end funds. Closed-end funds can trade at a discount or premium to the value of their holdings. Most funds trade consistently within a narrow band (Adams Express ADX, for example, pretty consistently trades at a discount of 14 – 15.5% so you pay $86 to buy $100 worth of stock). In times of panic, investors anxious to get out of the market have foolishly sold shares of the CEFs for discounts of greater than 40%. RiverNorth has better data on the trading patterns of CEFs than anyone else so they know that ADX at a 14.5% discount is nothing to write home about but ADX at a 22% discount might be a major opportunity because that discount will revert back to its normal range. So, whether the market goes up or down, the ADX discount will narrow.

If RiverNorth gets it right, investors have two sources of gain: investing in rising sectors because of the asset allocation and in CEFs whose returns are super-charged by the contracting discount. They are, for all practical purposes, the sole experienced player in this game.

In December 2012, RiverNorth launched RiverNorth/Manning & Napier Dividend Income Fund. The fund struck us as a curious hybrid: one half of the portfolio with RiverNorth’s opportunistic, higher-turnover closed-end fund strategy while the other half was Manning & Napier’s low-key, enhanced index strategy which rebalances its holdings just once a year. It was a sort of attempt to marry spumoni and vanilla. While we have great respect for each of the managers, the fund didn’t strike us as offering a compelling option and so we chose not to profile it.

Three things became clear in the succeeding twelve months:

The fund’s performance was not outstanding. The fund posted very respectable absolute returns in 2013 (25.6%) but managed to trail 90% of its peers. Manning and Napier Dividend Focus (MNDFX) whose strategy was replicated here, trailed 90% of its peers in 2013 and in three of the past four years.

Investors were not intrigued. At the end of November, 2013, the fund’s assets stood at $14 million.

RiverNorth noticed. In November, RiverNorth’s Board of Trustees voted not to renew the sub-advisory contract with Manning & Napier.

The reborn fund will stick to RiverNorth’s knitting: a tactical asset allocation plan implemented through CEFs when possible. It’s a strategy that they’ve put to good use in their (closed) RiverNorth Core Opportunity Fund (RNCOX), a stock/bond hybrid fund that uses this same discipline. 

Here’s the story of RiverNorth Core in two pictures.

rneox chart

From inception, Core Opportunity turned $10,000 into $17,700. Its average balanced competitor generated $13,500. You might note that Core made two supercharged moves upward in late 2008 and early 2009, which strongly affected the cumulative return.

rneox risk return

From inception, Core Opportunity has had noticeably greater short-term volatility than has its average competitor, but also noticeably higher returns. And, in comparison to the S&P 500, it has offered both higher returns and lower volatility.

Investors do need to be aware of some of the implications of RiverNorth’s approach.  Three things will happen when market volatility rises sharply:

The opportunities for excess returns rise. When people panic, mispricing becomes abundant and the managers have the opportunity to deploy cash in a rich collection of funds.

The fund’s short-term volatility rises. Moving into a market panic is profitable in the long-term, but can be hair-raising in the short term. 30% discounts can go to 40% before returning to 5%. The managers know that and are accustomed to sharp, short-term moves. The standard deviation, above, both reflects and misrepresents that volatility. It correctly notes the fund’s greater price movement, but fails to note that some of the volatility is to the upside as the discounts contract.

The fund’s expense ratio rises. The managers have the option of using inexpensive ETFs to implement their asset allocation, which they do when they are not compelling opportunities in the CEF arena. CEFs are noticeably costlier than ETFs, so as the move toward the prospect of excess return, they also incur higher expenses.

And, subsequently, portfolio turnover rises. An arbitrage strategy dictates selling the CEF when its discount has closed, which can happen quite suddenly. That may make the fund less tax-efficient than some of its vanilla peers.

Bottom Line

RiverNorth has a distinctive strategy that has served its investors well. The rechristened fund deserves serious consideration from investors who understand its unique characteristics and are willing to ride out short-term bumps in pursuit of the funds extra layer of long-term returns.

Fund website

RiverNorth Equity Opportunity

Fact Sheet

© Mutual Fund Observer, 2014. All rights reserved. The information here reflects publicly available information current at the time of publication. For reprint/e-rights contact us.

Artisan Global Small Cap (ARTWX), February 2014

By David Snowball

This fund has been liquidated.

Objective and Strategy

The fund seeks maximum long-term capital growth by investing in a compact portfolio of global small cap stocks. In general they pursue “high-quality companies that typically have a sustainable competitive advantage, a superior business model and a high-quality management team.” “Small caps” are stocks with a capitalization under $4 billion at time of purchase. The fund holds about 40 stocks. No more than 50% of the portfolio will be investing in emerging markets and the managers do not expect to hold more than 10%.

Adviser

Artisan Partners, L.P. Artisan is a remarkable operation. They advise the 13 Artisan funds (the 12 funds with a retail share class plus an institutional emerging markets fund), as well as a number of separate accounts. The firm has managed to amass over $105 billion in assets under management, of which approximately $45 billion are in their mutual funds. Despite that, they have a very good track record for closing their funds and, less visibly, their separate account strategies while they’re still nimble. Seven of the firm’s funds are closed to new investors, as of February 2014. Their management teams are stable, autonomous and invest heavily in their own funds.

Manager

Mark Yockey, Charles-Henri Hamker and David Geisler. Mr. Yockey joined Artisan in 1995 and has been repeatedly recognized as one of the industry’s premier international stock investors. He is a portfolio manager for Artisan InternationalArtisan International Small Cap and Artisan Global Equity Funds. He is, Artisan notes, fluent in French. Charles-Henri Hamker is an associate portfolio manager on Artisan International Fund, and a portfolio manager with Artisan International Small Cap and Artisan Global Equity Funds. He is fluent in French and German. (Take that, Yockey.)  Messrs Yockey and Hamker manage rather more than $10 billion in other assets and were nominated as Morningstar’s international-stock fund managers of the year in both 2012 and 2013. Mr. Yockey won the honor in 1998. Mr. Geisler joined Artisan as an analyst in 2007 after working for Cowen and Company. This is his first portfolio management assignment.

Strategy capacity and closure

Between $1 – 2 billion, depending on how quickly money is flowing in and the state of the market.  Artisan has an exceptional record for closing funds before they become overly large – seven of their 12 retail funds are, or imminently will be, closed to new investors and Artisan International Small Cap closed in 2003 with about $500 million in assets. As a result, closing the fund well before it hits the $2 billion cap seems likely.

Management’s Stake in the Fund

Mr. Yockey has over $1 million in the fund, Mr. Geisler has between $50,000 – 100,000 and Mr. Hamker has no investment in it. Only one of the funds five independent directors has an investment in the fund; in general, the Artisan directors have invested between hundreds of thousands to millions of their own dollars in the Artisan complex.

Opening date

June 23, 2013

Minimum investment

$1,000

Expense ratio

1.50% after waivers on assets of $53 million, as of January 2014.

Comments

There is a real question about whether early 2014 is a good time to begin investing in small cap stocks. The Leuthold Group reports that small cap stocks are selling at record or near-record premiums to large caps and manager David Geisler concurs that “U.S. small caps are close to peak valuations.” The managers have added just one or two names to the portfolio in recent months; they are not, Mr. Geisler reports, “on a buying strike but we try to be thoughtful.”  Perhaps in recognition of those factors, Mike Roos, a vice president and managing director at Artisan (also a consistently thoughtful, articulate guy), reports that Artisan will do no marketing of the fund.  “We look forward to organic growth of the fund, but we’re simply not pushing it.”

If you decide that you want to increase your exposure to global small caps, though, there are few safer bets than Artisan. Artisan’s managers are organized into six autonomous teams, each with responsibility for its own portfolios and personnel. The teams are united by four characteristics:

  • pervasive alignment of interests with their shareholders – managers, analysts and directors are all deeply invested in their funds, the managers have and have frequently exercised the right to close funds and other manifestations of their strategies, the partners own the firm and the teams are exceedingly stable.
  • price sensitivity – while it’s not exclusively a GARP shop, it’s clear that neither the value guys nor the growth guys pursue stocks with extreme valuations.
  • a careful, articulate strategy for portfolio weightings – the funds generally have clear criteria for the size of initial positions in the portfolio, the upsizing of those positions with time and their eventual elimination, and
  • uniformly high levels of talent.  Artisan interviews a lot of potential managers each year, but only hires managers who they believe will be “category killers.” 

Those factors have created a tradition of consistent excellence across the Artisan family.  By way of illustration:

  • Eleven of Artisan’s 12 retail funds are old enough to have Morningstar ratings.  Ten of those 11 funds have earned four- or five-stars. 
  • Ten of the 11 have been recognized as “Silver” or “Gold” funds by Morningstar’s analysts. 
  • Nine of the 11, including all of the international and global funds, are Lipper Leaders for Total Return. 
  • Six are MFO Great Owl funds, as well.
  • Artisan teams have been nominated for Morningstar’s “manager of the year” award nine times in the past 15 years; they’ve won four times.

And none are weak funds, though some do get out of step with the market from time to time.  The managers are finding far better values outside of the US than in it: about 12% of the most recent portfolio are US-domiciled firms, about the same as its UK and China exposure. Despite popular panic about the emerging markets, E.M. stocks are 33% of the portfolio. The average global fund is 50% US, 80% large caps and just 7% EM. That independence is reflected in the fund’s active share: 99.6%. 

Bottom Line

You might imagine Global Small Cap as representing the subset of stocks which lies at the intersection of the team’s International Fund (which has had one sub-par year in a decade), it’s International Small Cap fund (which has had two sub-par years in a decade) and its Global Equity fund (which has not yet had a below-average year, though it’s just a bit over three). On face, that’s a very good place to be.

Fund website

Artisan Global Small Cap

By way of disclosure: while the Observer has no financial relationship with or interest in Artisan, I do own shares of two of the Artisan funds (Small Cap Value ARTVX and International Value ARTKX) and have done so since the funds’ inception.

© Mutual Fund Observer, 2014. All rights reserved. The information here reflects publicly available information current at the time of publication. For reprint/e-rights contact us.

FPA Paramount (FPRAX), September 2013

By David Snowball

Objective and Strategy

The FPA Global Value Strategy will seek to provide above-average capital appreciation over the long term while attempting to minimize the risk of capital losses by investing in well-run, financially robust, high-quality businesses around the world, in both developed and emerging markets.

Adviser

FPA, formerly First Pacific Advisors, which is located in Los Angeles.  The firm is entirely owned by its management which, in a singularly cool move, bought FPA from its parent company in 2006 and became independent for the first time in its 50 year history.  The firm has 28 investment professionals and 72 employees in total.  Currently, FPA manages about $25 billion across four equity strategies and one fixed income strategy.  Each strategy is manifested in a mutual fund and in separately managed accounts; for example, the Contrarian Value strategy is manifested in FPA Crescent (FPACX), in nine separate accounts and a half dozen hedge funds.  On April 1, 2013, all FPA funds became no-loads.

Managers

Pierre O. Py and Greg Herr.  Mr. Py joined FPA in September 2011. Prior to that, he was an International Research Analyst for Harris Associates, adviser to the Oakmark funds, from 2004 to 2010.  Mr. Py has managed FPA International Value (FPIVX) since launch. Mr. Herr joined the firm in 2007, after stints at Vontobel Asset Management, Sanford Bernstein and Bankers Trust.  He received a BA in Art History at Colgate University.  Mr. Herr co-manages FPA Perennial (FPPFX) and the closed-end Source Capital (SOR) funds with the team that used to co-manage FPA Paramount.  Py and Herr will be supported by the two research analysts, Jason Dempsey and Victor Liu, who also contribute to FPIVX.

Management’s Stake in the Fund

As of the last SAI (September 30, 2012), Mr. Herr had invested between $1 and $10,000 in the fund and Mr. Py had no investment in it.  Mr. Py did have a very large investment in his other charge, FPA International Value.

Opening date

September 8, 1958.

Minimum investment

$1,500, reduced to $100 for IRAs or accounts with automatic investing plans.

Expense ratio

0.94% on $323 million in assets, as of August 2013.

Comments

We’ve never before designated a 55-year-old fund as a “most intriguing new fund,” but the leadership and focus changes at FPRAX warrant the label.

I’ve written elsewhere that “Few fund companies get it consistently right.  By “right” I don’t mean “in step with current market passions” or “at the top of the charts every year.”  By “right” I mean two things: they have an excellent investment discipline and they treat their shareholders with profound respect.

FPA gets it consistently right.

FPA has been getting it right with the two funds overseen by Eric Ende and Stephen Geist: FPA Paramount (since March 2000) and FPA Perennial (since 1995 and 1999, respectively).   Morningstar designates Paramount as a five-star world stock fund and Perennial as a three-star domestic mid-cap growth fund (both as of August, 2013).  That despite the fact that there’s a negligible difference in the fund’s asset allocation (cash/US stock/international stock) and no difference in their long-term performance.  The chart below shows the two funds’ returns and volatility since Geist and Ende inherited Paramount.

fpa paramount

To put it bluntly, both have consistently clubbed every plausible peer group (mid-cap growth, global stock) and benchmark (S&P 500, Total Stock Market, Morningstar US Growth composite) that I compared them to.  By way of illustration, $10,000 invested in either of these funds in March 2000 would have grown to $35,000 by August 2013.  The same amount in the Total Stock Market index would have hit $16,000 – and that’s the best of any of the comparison groups.

To be equally blunt, the funds mostly post distinctions without a difference.  In theory Paramount has been more global than Perennial but, in practice, both remained mostly focused on high-quality U.S. stocks. 

FPA has decided to change that.  Geist and Ende will now focus on Perennial, while Py and Herr reshape Paramount.  There are two immediately evident differences:

  1. The new team is likely to transition toward a more global portfolio.  We spoke with Mr. Py after the announcement and he downplayed the magnitude of any immediate shifts.  He does believe that the most attractive valuations globally lie overseas and the most attractive ones domestically lie among large cap stocks.  That said, it’s unlikely the case that FPA brought over a young and promising international fund manager with the expectation that he’ll continue to skipper a portfolio with only 10-15% international exposure.
  2. The new team is certain to transition toward a more absolute value portfolio.  Mr. Py’s investment approach, reflected in the FPIVX prospectus, stresses “Low Absolute Valuation. The Adviser only purchases shares when the Adviser believes they offer a significant margin of safety (i.e. when they trade at a significant discount to the Adviser’s estimate of their intrinsic value).”  In consequence of that, “the limited number of holdings in the portfolio and the ability to hold cash are key aspects of the portfolio.”  At the last portfolio report, International Value held 24 stocks and 38% cash while Paramount held 31 and 10%.  Given that the investment universe here is broader than International’s, it’s unlikely to hold huge cash stakes but likely that it might drift well north of its current level at times.

Bottom Line

Paramount is apt to become a very solid, but very different fund under its new leadership.  There will certainly be a portfolio restructuring and there will likely be some movement of assets as investors committed to Ende and Geist’s style migrate to Perennial.  The pace of those changes will dictate the magnitude of the short-term tax burden that shareholders will bear. 

Fund website

FPA Paramount Fund

2013 Q3 Report and Commentary

Fact Sheet

© Mutual Fund Observer, 2013. All rights reserved. The information here reflects publicly available information current at the time of publication. For reprint/e-rights contact us.

LS Opportunity Fund (LSOFX), August 2013

By David Snowball

Objective and Strategy

The Fund aims to preserve capital while delivering above-market returns and managing volatility.  They invest, long and short, in a domestic equity portfolio.  The portfolio is driven by intensive company research and risk management protocols. The long portfolio is typically 30-50 names, though as of mid-2013 it was closer to 70.  The short portfolio is also 30-50 names.  The average long position persists for 12-24 months while the average short position is closed after 3-6.  The fund averages about 50% net long, though at any given point it might be 20-70% long.  The fund’s target standard deviation is eight.

Adviser

Long Short Advisors, LLC.   LSA launched the LS Opportunity Fund to offer access to Independence Capital Asset Partners’ long/short equity strategy. ICAP is a Denver-based long/short equity manager with approximately $500 million in assets under management.

Manager

James A. Hillary, Chief Executive Officer, Chief Investment Officer, and Portfolio Manager at ICAP.  Mr. Hillary founded Independence Capital Asset Partners (ICAP) in 2004. From 1997-2004, Mr. Hillary was a founding partner and portfolio manager at Marsico Capital Management.  While there he managed the 21st Century Fund (MXXIX) and co-managed several other products. Morningstar noted that during Mr. Hillary’s tenure “the fund [MXXIX] has sailed past the peer-group norm by a huge margin.” Bank of America bought Marsico in 2000, at which time Mr. Hillary received a substantial payout.  Before Marsico, he managed a long/short equity fund for W.H. Reaves. Effective June 1, 2013, Mr. Chris Hillary was added as a co-portfolio manager of the Fund. Messrs Hillary are supported by seven other investment professionals.

Strategy capacity and closure

The strategy, which is manifested in the mutual fund, a hedge fund (ICAP QP Absolute Return Fund), a European investment vehicle (Prosper Stars and Stripes, no less) and separate accounts, might accommodate as much as $2 billion in assets but the advisor will begin at about $1 billion to look at the prospect of soft closing the strategy.

Management’s Stake in the Fund

The senior Mr. Hillary has between $100,000 and 500,000 in the fund.  Most of his investable net wealth is invested here and in other vehicles using this strategy.  The firm’s principals and employees account for about 14% of ICAP’s AUM, though the fund’s trustees have no investment in the fund.

Opening date

September 9, 2010, though the hedge fund which runs side-by-side with it was launched in 2004.

Minimum investment

$5,000

Expense ratio

1.95% on fund assets of $40 million.  The limit was reduced in early 2013 from 2.50%.

Comments

In 2004, Jim Hillary had a serious though delightful problem.  As one of the co-founders of MCM, he had received a rich payout from the Bank of America when they purchased the firm.  The problem was what to do with that payout.

He had, of course, several options.  He might have allowed someone else to manage the money, though I suspect he would have found that option to be laughable.  In managing it himself, he might reasonably have chosen a long-only equity portfolio, a long-short equity portfolio or a long equity portfolio supplemented by some sort of fixed-income position.  He had success in managing both of the first two approaches and might easily have pursued the third.

The decision that Mr. Hillary made was to pursue a long-short equity strategy as the most prudent and sustainable way to manage his own and his family’s wealth.  That strategy achieved substantial success, measured both by its ability to achieve sustainable long-term returns (about 9% annually from 2004) and to manage volatility (a standard deviation of about 12, both better than the Total Stock Market’s performance). 

Mr. Hillary’s success became better known and he chose, bit by bit, to make the strategy available to others.  One manifestation of the strategy is that ICAP QP Absolute Return L.P. hedge fund, a second is the European SICAV Prosper Star & Stripes, and a third are separately managed accounts.  The fourth and newest manifestation, and the only one available to retail investors, is LS Opportunity Fund.  Regardless of which vehicle you invest in, you are relying on the same strategy and the portfolio in which Mr. Hillary’s own fortune resides.

Mr. Hillary’s approach combines intensive fundamental research in individual equities, both long and short. 

There are two questions for potential investors:

  • Does a long-short position make sense for me?
  • Does this particular long-short vehicle make the most sense for me?

The argument for long-short investing is complicated by the fact that there are multiple types of long-short funds which, despite having similar names or the same peer group assigned by a rating agency, have strikingly different portfolios and risk/return profiles.  A fund which combines an ETF-based long portfolio and covered calls might, for example, offer far more income but far fewer opportunities for gain than a “pure” long/short strategy such as this one.

The argument for pure long/short is straightforward: investors cannot stomach the volatility generated by unhedged exposure to the stock market.  That volatility has traditionally been high (the standard deviation for large cap stocks this century has been over 16 while the mean return has been 4; the translation is that you’ve been averaging a measly 4% per year while routinely encountering returns in the range of minus-12 to plus-20 with the occasional quarterly loss of 17% and annual loss of 40% thrown in) and there’s no reason to expect it to decline.   The traditional hedge has been to hold a large bond position, which worked well during the 30-year bond bull market just ended.  Going forward, asset allocation specialists expect the bond market to post negative real returns for years.  Cash, which is also posting negative real returns, is hardly an attractive option.

The alternative is a portfolio which offsets exposure to the market’s most attractive stocks with bets against its least attractive ones.  Research provided by Long Short Advisors makes two important points:

  • since 1998, an index of long/short equity hedge funds has outperformed a simple 60/40 allocation with no material change in risk and
  • when the market moves out of its panic mode, which are periods in which all stocks move in abnormal unison, both the upside and downside advantages of a hedged strategy rises in comparison to a long-only portfolio.

In short, a skilled long-short manager can offer more upside and less downside than either a pure stock portfolio or a stock/bond hybrid one.

The argument for LS Opportunity is simpler.  Most long/short managers have limited experience either with shorting stocks or with mutual funds as an investment vehicle.  More and more long/short funds are entering the market with managers whose ability is undocumented and whose prospects are speculative.  Given the complexity and cost of the strategy, I’d avoid managers-with-training-wheels.

Mr. Hillary, in contrast, has a record worth noticing.  He’s managed separate accounts and hedge funds, but also has a fine record as a mutual fund manager.  He’s been working with long/short portfolios since his days at W.H. Reaves in the early 1990s.  The hedge fund on which LS Opportunity is based has survived two jarring periods, including the most traumatic market since the Great Depression.  The mutual fund itself has outperformed its peers since launch and has functioned with about half of the market’s volatility.

Bottom Line

This is not a risk-free strategy.  The fund has posted losses in 15 of its first 34 months of operation.  Eight of those losses have come in months when the S&P500 rose.  The fund’s annualized return from inception through the end of June 2013 is 6.32% while the S&P moved relentlessly and, many fear, irrationally higher.  In the longer term, the strategy has worked to both boost returns and mute volatility.  And, with his personal fortune and professional reputation invested in the strategy, you’d be working with an experienced team which has committed “our lives, our fortunes, and our sacred honor” to making it work.  It’s worth further investigation.

Fund website

LS Opportunity Fund

3Q 2013 Fact Sheet

© Mutual Fund Observer, 2013. All rights reserved. The information here reflects publicly available information current at the time of publication. For reprint/e-rights contact us.

Forward Income Builder Fund (AIAIX)

By David Snowball

This fund has been liquidated.

Objective and Strategy:

The fund seeks high current income and some stability of principal by investing in an array of other Forward Funds and cash.  The portfolio has a target volatility designation (a standard deviation of 6.5%) and it is rebalanced monthly to generate as much income as possible consistent with that risk goal. 

Adviser:

Forward Management, LLC.  Forward specializes in alternative investment classes.  As of March 2013, Forward had $6.1 billion in assets under management in their “alternative and niche” mutual funds and in separately managed accounts.

Managers:

All investment decisions are made jointly by the team of Nathan Rowader, Director of Investments and Senior Market Strategist; Paul Herber, Portfolio Manager; Paul Broughton, Assistant Portfolio Manager; and Jim O’Donnell, CIO. Between them, the team has over 70 years of investment experience.

Management’s Stake in the Fund:

As of May 1st, Messrs. Rowader and Broughton had not invested in the fund. Messrs. Herber and O’Donnell each had a small stake, of less than $10,000, invested.

Opening date:

December 27, 2000.  Prior to May 1, 2012, it was known as the Forward Income Allocation Fund.

Minimum investment:

There’s a $4,000 minimum initial investment, lowered to $2,000 for Coverdell and eDelivery accounts, further lowered to $500 for automatic investment plans.

Expense ratio:

1.96% on assets of $21.2 million.

Comments:

Forward Income Builder is different.  It’s different than what it used to be.  It’s different than other funds, income-oriented or not.  So far, those differences have been quite positive for investors.

Income Builder has always been a fund-of-funds.  From launch in 2000 to May 2012, it had an exceedingly conservative mandate: it “uses an asset allocation strategy designed to provide income to investors with a low risk tolerance and a 1-3 year investment time horizon.”  In May 2012, it shifted gears.  The corresponding passage now read: it “uses an asset allocation strategy designed to provide income to investors with a lower risk tolerance by allocating the Fund’s investments to income producing assets that are exhibiting a statistically higher yield relative to other income producing assets while also managing the volatility of the Fund.” The first change is easy to decode: it targets investors with a “lower” rather than “low risk tolerance” and no longer advertises a 1- 3 year investment time horizon.

The second half is a bit trickier.  Many funds are managed with an eye to returns; Income Builder is managed with an eye to risk (measured by standard deviation) and yield.  It’s goal is to combine asset classes in such a way that it generates the maximum possible return from a portfolio whose standard deviation is 6.5%.  They calculate forward-looking standard deviations for 11 asset classes for the next 30 days.  They then calculate which combination of asset classes will generate high yield with no more than 6.5% standard deviation.  The rebalance the portfolio monthly to maintain that profile.

Why might this interest you?  Forward is responding to the end of the 30 year bull market in bonds.  They believe that income-oriented investors will need to broaden their opportunity set to include other assets (dividend-paying stocks, REITs, preferred shares, emerging markets corporate debt and so on).  At the same time, they can’t afford wild swings in the value of their portfolios.  So Forward builds backward from an acceptable level of volatility to the mix of assets which have the greatest excess return possibilities.

The evidence so far available is positive.  A $10,000 investment in the fund on May 1, 2012, when its mandate changed, was worth $10,800 by the end of June, 2012.  The same investment in its average peer was worth $10,500.  The portfolio’s stocks are yielding a 6.1% dividend, their income is higher than their peers and their standard deviation has been lowered (4.1%) than their target.  The portfolio yield is 4.69%.  By comparison, T. Rowe Price Spectrum Income (RPSIX), another highly regarded fund-of-funds with about 15% equity exposure, has a yield of 3.65%.

There are three issues that prospective investors need to consider:

  1. The fund is expensive. It charges 1.96%, including the expenses of its underlying funds.
  2. During the late May – June market turbulence, it dropped substantially more than its multi-sector bond peers.  The absolute drop was small – 2.2% – but still greater than the 1.2% suffered by its peers.  Nonetheless, its YTD and TTM returns, through the end of June 2013, place it in the top tier of its peer group.
  3. The managers have, by and large, opted not to make meaningful investments in the fund.  On both symbolic and practical grounds, that’s a regrettable decision.

Bottom Line:

Forward Income Builder will for years drag the tepid record occasioned by its former strategy.  That will likely deter many new investors.  For income-oriented investors who accept the need to move beyond traditional bonds and are willing to look at the new strategy with fresh eyes, it has a lot to offer.

Fund website:

www.forwardinvesting.com

© Mutual Fund Observer, 2013. All rights reserved. The information here reflects publicly available information current at the time of publication. For reprint/e-rights contact us.


Scout Low Duration Bond Fund (SCLDX), June 2013

By David Snowball

This fund is now the Carillon Reams Low Duration Bond Fund.

Objective and Strategy

The fund seeks a high level of total return consistent with the preservation of capital.  The managers may invest in a wide variety of income-producing securities, including bonds, debt securities, derivatives and mortgage- and asset-based securities.  They may invest in U.S. and non-U.S. securities and in securities issued by both public and private entities.  Up to 25% of the portfolio may be invested in high yield debt.  The investment process combines top-down interest rate management (determining the likely course of interest rates and identifying the types of securities most likely to thrive in various environments) and bottom-up fixed income security selection, focusing on undervalued issues in the fixed income market. 

Adviser

Scout Investments, Inc. Scout is a wholly-owned subsidiary of UMB Financial, both are located in Kansas City, Missouri. Scout advises the nine Scout funds. As of January 2013, they managed about $25 billion.  Scout’s four fixed-income funds are managed by its Reams Asset Management division, including Low-Duration Bond (SCLDX), Unconstrained Bond (SUBYX), Core Bond (SCCYX, four stars) and Core Plus Bond (SCPZX, retail shares were rated four star and institutional shares five star/Silver by Morningstar, as of May, 2013).

Manager

Mark M. Egan is the lead portfolio manager for all their fixed income funds. His co-managers are Thomas Fink, Todd Thompson and Stephen Vincent.  From 1990 to 2010, Mr. Egan was a portfolio manager for Reams Asset Management.  In 2010, Reams became the fixed-income arm of Scout.  His team worked together at Reams.  In 2012, they were finalists for Morningstar’s Fixed-Income Manager of the Year honors.   

Management’s Stake in the Fund

None yet reported.  Messrs. Egan, Fink and Thompson have each invested over $1,000,000 in their Unconstrained Bond fund while Mr. Vincent has between $10,000 – 50,000 in it.  

Opening date

August 29, 2012.

Minimum investment

$1,000 for regular accounts, reduced to $100 for IRAs or accounts with AIPs.

Expense ratio

0.40%, after waivers, on assets of $32 million (as of May 2013).  The fund’s assets are growing briskly.  The Low Duration Strategy on which this fund operates was launched July 1, 2002 and has $2.9 billion in it.

Comments

The simple act of saving money is not supposed to be a risky activity.  Recent Federal Reserve policy has made it so.  By driving interest rates relentlessly down in support of a feeble economy, the Fed has turned all forms of saving into a money losing proposition.  Inflation in the past couple years has average 1.5%.  That’s low but it’s also 35-times higher than the rate of return on the Vanguard Prime Money Market fund, which paid 0.04% in each of the past two years.  The average bank interest rate sits at 0.21%.  In effect, every dollar you place in a “safe” place loses value year after year.

Savers are understandable irate and have pushed their advisers to find alternate investments (called “funky bonds” by The Wall Street Journal) which will offer returns in excess of the rate of inflation.  Technically, those are called “positive real returns.”  Combining a willingness to consider unconventional fixed-income securities with a low duration portfolio offers the prospect of maintaining such returns in both low and rising interest rate environments.

That impulse makes sense and investors have poured hundreds of billions into such funds over the past three years.  The problem is that the demand for flexible fixed-income management exceeds the supply of managers who have demonstrated an ability to execute the strategy well, across a variety of markets.

In short, a lot of people are handing money over to managers whose credentials in this field are paper thin.   That is unwise.

We believe, contrarily, that investing with Mr. Egan and his team from Reams is exceptionally wise.  There are four arguments to consider:

  1. This strategy is quite flexible.

    The fund can invest globally, in both public and private debt, in investment grade and non-investment grade, and in various derivatives.  All of the Scout/Reams funds, according to Mr. Egan, use “the same proven philosophy and process.”  While he concedes that “due to the duration restrictions the opportunity set is slightly smaller for a low duration fund …  the ability to react to value when it is created in the capital markets is absolutely available in the low duration fund.  This includes sector decisions, individual security selection, and duration/yield curve management.”

  2. The managers are first-rate.

    Reams was nominated as one of Morningstar’s fixed-income managers of the year in 2012.  They were, at base, recognized as one of the five best teams in existence In explaining their nomination of Reams as fixed-asset manager of the year, Morningstar explained:

    Mark Egan and crew [have delivered] excellent long-term returns here. Reams isn’t a penny-ante player, either: The firm has managed close to $10 billion in fixed-income assets, mainly for institutions, for much of the past decade.

    Like some of its fellow nominees, the team followed up a stellar showing in 2011 with a strong 2012, owing much of the fund’s success this year to decisions made amid late 2011’s stormy climate, including adding exposure to battered U.S. bank bonds and high-yield. Unlike the other nominees, however, the managers have pulled in the fund’s horns substantially as credit has rallied this year. That’s emblematic of what they’ve done for more than a decade. When volatility rises, they pounce. When it falls, they protect. That approach has taken a few hits along the way, but the end result has been outstanding.

  3. They’ve succeeded over time.

    While the Low Duration fund is new, the Low Duration strategy has been used in separately managed accounts for 11 years.  They currently manage nearly $3 billion in low duration investments for high net-worth individuals and institutions.  For every trailing time period, Mr. Egan has beaten both his peer group.  His ten year returns have been 51% higher than his peers:


    1 Yr.

    3 Yrs.

    5 Yrs.

    10 Yrs.

    Low Duration Composite (net of fees)

    3.76%

    3.72%

    5.22%

    4.73%

    Vanguard Short-Term Bond Index fund (VBISX)

    1.70

    2.62

    3.12

    3.51

    Average short-term bond fund

    2.67

    2.81

    3.22

    3.13

    Reams performance advantage over peers

    41%

    32%

    62%

    51%

    Annualized Performance as of March 31, 2013.  The Low Duration Fixed Income Composite was created July 1, 2003.

    The pattern repeats if you look year by year: he has outperformed his peers in six of the past six years and is doing so again in 2013, through May.  While he trails the Vanguard fund above half the time, the magnitude of his “wins” over the index fund is far greater than the size of his losses.


    2007

    2008

    2009

    2010

    2011

    2012

    Low Duration Composite (net of fees)

    7.02

    1.48

    13.93

    5.02

    2.62

    5.06

    Vanguard Short-Term Bond Index fund (VBISX)

    7.22

    5.43

    4.28

    3.92

    2.96

    1.95

    Average short-term bond fund

    4.29

    (4.23)

    9.30

    4.11

    1.66

    3.67

    Annualized Performance as of March 31, 2013.  The Low Duration Fixed Income Composite was created July 1, 2003.

  4. They’ve succeeded when you most needed them.

    The fund made money during the market meltdown that devastated so many investors.  Supposedly ultra-safe ultra-short bond funds imploded and the mild-mannered short-term bond group lost about 4.2% in 2008.  When we asked Mr. Egan about why he managed to make money when so many others were losing it, his answer came down to a deep-seated aversion to suffering a loss of principle.

    One primary reason we outperformed relative to many peers in 2008 was due to our investment philosophy that focuses on downside risk protection.  Many short-term bond funds experienced negative returns in 2008 because they were willing to take on what we view as unacceptable risks in the quest for incremental yield or income.  This manifested itself in many forms: a junior position in the capital structure, leveraged derivative credit instruments, or securities backed by loans of questionable underwriting and payer quality.   Specifically, many were willing to purchase and hold subprime securities because the higher current yield was more important to them then downside protection.  When the credit crisis occurred, the higher risks they were willing to accept produced significant losses, including permanent impairment.  We were able to side-step this damage due to our focus on downside risk protection.  We believe that true risk in fixed income should be defined as a permanent loss of principle.  Focusing on securities that are designed to avoid this type of risk has served us well through the years.

Bottom Line

Mr. Egan’s team has been at this for a long time.  Their discipline is clear, has worked under a wide variety of conditions, and has worked with great consistency.  For investors who need to take one step out on the risk spectrum in order to escape the trap of virtually guaranteed real losses in money markets and savings accounts, there are few more compelling options.

Fund website

Scout Low Duration Bond

Commentary

Fact Sheet

© Mutual Fund Observer, 2013. All rights reserved. The information here reflects publicly available information current at the time of publication. For reprint/e-rights contact us.

Oakseed Opportunity Fund (SEEDX), May 2013

By David Snowball

This fund has been liquidated.

Objective and Strategy

The fund will seek long term capital appreciation.  While the prospectus notes that “the Fund will invest primarily in U.S. equity securities,” the managers view it as more of a go-anywhere operation, akin to the Oakmark Global and Acorn funds.  They can invest in common and preferred stocks, warrants, ETFs and ADRs.  The managers are looking for investments with three characteristics:

  • High quality businesses in healthy industries
  • Compelling valuations
  • Evidence that management’s interests are aligned with shareholders

They are hopeful of holding their investments for three to five years on average, and are intent on exploiting short-term market turbulence.  The managers do have the option to using derivatives, primarily put options, to reduce volatility and strengthen returns.

Adviser

Jackson Park Capital, LLC was founded in late 2012 by Greg Jackson and John Park. The firm is based in Park City, Utah.  The founders claim over 40 years of combined investment experience in managing mutual funds, hedge funds, and private equity funds.

Managers

Gregory L. Jackson and John H. Park.  Mr. Jackson was a Partner at Harris Associates and co-manager of Oakmark Global (OAKGX) from 1999 – 2003.  Prior to that, he works at Yacktman Asset Management and afterward he and Mr. Park were co-heads of the investment committee at the private equity firm Blum Capital.  Mr. Park was Director of Research at Columbia Wanger Asset Management, portfolio manager of the Columbia Acorn Select Fund (LTFAX) from inception until 2004 and co-manager of the Columbia Acorn Fund (LACAX) from 2003 to 2004.  Like Mr. Jackson, he subsequently joined Blum Capital.  The Oakmark/Acorn nexus gave rise to the Oakseed moniker.

Management’s Stake in the Fund

Mr. Park estimates that the managers have $8-9 million in the fund, with plans to add more when they’re able to redeem their stake in Blum Capital.  Much of the rest of the money comes from their friends, family, and long-time investors.  In addition, Messrs. Jackson and Park own 100% of Jackson Park. 

Opening date

December 31, 2012.

Minimum investment

$2500 for regular accounts, $1000 for various tax-deferred accounts and $100 for accounts set up with an AIP.

Expense ratio

1.41% after waivers on assets of $40 million (as of March, 2013).  Morningstar inexplicably assigns the fund an expense ratio of 0.00%, which they correctly describe as “low.”

Comments

If you’re fairly sure that creeping corporatism – that is, the increasing power of marketers and folks more concerned with asset-gathering than with excellence – is a really bad thing, then you’re going to discover that Oakseed is a really good one.

Oakseed is designed to be an opportunistic equity fund.  Its managers are expected to be able to look broadly and go boldly, wherever the greatest opportunities present themselves.  It’s limited by neither geography, market cap nor stylebox.   John Park laid out its mission succinctly: “we pursue the maximum returns in the safest way possible.”

It’s entirely plausible that Messrs. Park and Jackson will be able to accomplish that goal. 

Why does that seem likely?  Two reasons.  First, they’ve done it before.  Mr. Park managed Columbia Acorn Select from its inception through 2004. Morningstar analyst Emily Hall’s 2003 profile of the fund was effusive about the fund’s ability to thrive in hard times:

This fund proved its mettle in the bear market. On a relative basis (and often on an absolute basis), it was a stellar performer. Over the trailing three years through July 22 [2003], its 7.6% annualized gain ranks at the top of the mid-growth category.

Like all managers and analysts at Liberty Acorn, this fund’s skipper, John Park, is a stickler for reasonably priced stocks. As a result, Park eschews expensive, speculative fare in favor of steadier growth names. That practical strategy was a huge boon in the rough, turn-of-the-century environment, when investors abandoned racier technology and health-care stocks. 

They were openly mournful of the fund’s prospects after his departure.  Their 2004 analysis began, “Camel, meet straw.”  Greg Jackson’s work with Oakmark Global was equally distinguished, but there Morningstar saw enough depth in the management ranks for the fund to continue to prosper.  (In both cases they were right.)  The strength of their performance led to an extended recruiting campaign, which took them from the mutual fund work and into the world of private equity funds, where they (and their investors) also prospered.

Second, they’re not all that concerned about attracting more money.  They started this fund because they didn’t want to do marketing, which was an integral and time consuming element of working with a private equity fund.  Private equity funds are cyclical: you raise money from investors, you put it to work for a set period, you liquidate the fund and return all the money, then begin again.  The “then begin again” part held no attraction to them.  “We love investing and we could be perfectly happy just managing the resources we have now for ourselves, our families and our friends – including folks like THOR Investment who have been investing with us for a really long time.”  And so, they’ve structured their lives and their firm to allow them to do what they love and excel at.  Mr. Park described it as “a virtual firm” where they’ve outsourced everything except the actual work of investing.  And while they like the idea of engaging with prospective investors (perhaps through a summer conference call with the Observer’s readers), they won’t be making road trips to the East Coast to rub elbows and make pitches.  They’ll allow for organic growth of the portfolio – a combination of capital appreciation and word-of-mouth marketing – until the fund reaches capacity, then they’ll close it to new investors and continue serving the old.

A quirk of timing makes the fund’s 2013 returns look tepid: my Morningstar’s calculation (as of April 30), they trail 95% of their peers.  Look closer, friends.  The entire performance deficit occurred on the first day of the year and the fund’s first day of existence.  The market melted up that day but because the fund’s very first NAV was determined after the close of business, they didn’t benefit from the run-up.  If you look at returns from Day Two – present, they’re very solid and exceptional if you account for the fund’s high cash stake and the managers’ slow, deliberate pace in deploying that cash.

Bottom Line

This is going to be good.  Quite possibly really good.  And, in all cases, focused on the needs of its investors and strengths of its managers.  That’s a rare combination and one which surely warrants your attention.

Fund website

Oakseed Funds.  Mr. Park mentioned that neither of them much liked marketing.  Uhhh … it shows.  I know the guys are just starting out and pinching pennies, but really these folks need to talk with Anya and Nina about a site that supports their operations and informs their (prospective) investors.   

Update: In our original article, we noted that the Oakseed website was distressingly Spartan. After a round of good-natured sparring, the guys launched a highly functional, visually striking new site. Nicely done

Fact Sheet

© Mutual Fund Observer, 2013. All rights reserved. The information here reflects publicly available information current at the time of publication. For reprint/e-rights contact us.

Whitebox Market Neutral Equity Fund, Investor Class (WBLSX), April 2013

By David Snowball

Update: This fund has been liquidated.

Objective and Strategy

The fund seeks to provide investors with a positive return regardless of the direction and fluctuations of the U.S. equity markets by creating a market neutral portfolio designed to exploit inefficiencies in the markets. While they can invest in stocks of any size, they anticipate a small- to mid-cap bias. The managers advertising three reasons to consider the fund:

Downside Management: they seek to limit exposure to downside risk by running a beta neutral portfolio (one with a target beta of 0.2 to minus 0.2 which implies a net equity exposure of 20% to minus 20%) designed to capitalize on arbitrage opportunities in the equity markets.

Portfolio Diversification: they seek to generate total return that is not correlated to traditional asset classes and offers portfolio diversification benefits.

Experienced, Talented Investment Team: The team possess[es] decades of experience investing in long short equity strategies for institutional investors.

Morningstar analysis of their portfolio bears no resemblance to the team’s description of it (one short position or 198? 65% cash or 5%?), so you’ll need to proceed with care and vigilance.  Unlike many of its competitors, this is not a quant fund.

Adviser

Whitebox Advisors LLC, a multi-billion dollar alternative asset manager founded in 2000.  Whitebox manages private investment funds (including Credit Arbitrage, Small Cap L/S Equity, Liquid L/S Equity, Special Opportunities and Asymmetric Opportunities), separately managed accounts and the two (soon to be three) Whitebox funds. As of January 2012, they had $2.3 billion in assets under management (though some advisor-search sites have undated $5.5 billion figures).

Manager

Andrew Redleaf, Jason E. Cross, Paul Karos and Kurt Winters.  Mr. Redleaf founded the advisor, has deep hedge fund experience and also manages Whitebox Tactical Opportunities.  Dr. Cross has a Ph.D. in Statistics, had a Nobel Laureate as an academic adviser and published his dissertation in the Journal of Mathematical Finance. Together they also manage a piece of Collins Alternative Solutions (CLLIX).  Messrs. Karos and Winters are relative newcomers, but both have substantial portfolio management experience.

Management’s Stake in the Fund

Not yet reported but, as of 12/31/12, Whitebox and the managers owned 42% of fund shares and the Redleaf Family Foundation owned 6.5%  Mr. Redleaf also owns 85% of the advisor.

Opening date

November 01, 2012 but The Fund is the successor to Whitebox Long Short Equity Partners, L.P., a private investment company managed by the Adviser from June, 2004 through October, 2012.

Minimum investment

$5000, reduced to $1000 for IRAs.

Expense ratio

1.95% after waivers on assets of $17 million (as of March, 2013).  The “Investor” shares carry a 4.5% front-end sales load, the “Advisor” shares do not.

Comments

Here’s the story of the Whitebox Long Short Equity fund, in two pictures.

Picture One, what you see if you include the fund’s performance when it was a hedge fund:

whitebox1

Picture Two, what you see if you look only at its performance as a mutual fund:

whitebox2

The divergence between those two graphs is striking and common.  There are lots of hedge funds – the progenitors of Nakoma Absolute Return, Baron Partners, RiverPark Long Short Opportunities – which offered mountainous chart performance as hedge funds but whose performance as a mutual fund was somewhere between “okay” and “time to turn out the lights and go home.”  The same has been true of some funds – for example, Auer Growth and Utopia Core – whose credentials derive from the performance of privately-managed accounts.  Similarly, as the Whitebox managers note, there are lots of markets in which their strategy will be undistinguished.

So, what do they do?  They operate with an extremely high level of quantitative expertise, but they are not a quant fund (that’s the Whitebox versus “black box” distinction).  We know that there are predictable patterns of investor irrationality (that’s the basis of behavioral finance) and that those investor preferences can shift substantially (for example, between obsessions with greed and fear).  Whitebox believes that those irrationalities continually generate exploitable mispricings (some healthy firms or sound sectors priced as if bankruptcy is imminent, others priced as if consumers are locked into an insane spending binge).  Whitebox’s models attempt to identify which factors are currently driving prices and they assign a factor score to stocks and sectors.

Whitebox does not, however, immediately act on those scores.  Instead, they subject the stocks to extensive, fundamental analysis.  They’re especially sensitive to the fact that quant outputs become unreliable in suddenly unstable markets, and so they’re especially vigilant in such markets are cast a skeptical eye on seemingly objective, once-reliable outputs.

They believe that the strengths of each approach (quant and fundamental, machine and human) can be complementary: they discount the models in times of instability but use it to force their attention on overlooked possibilities otherwise. 

They tend assemble a “beta neutral” portfolio, one that acts as if it has no exposure to the stock market’s volatility.  They argue that “risk management … is inseparable from position selection.”  They believe that many investors mistakenly seek out risky assets, expecting that higher risk correlates with higher returns.  They disagree, arguing that they generate alpha by limiting beta; that is, by not losing your money in the first place.  They’re looking for investments with asymmetric risks: downside that’s “relatively contained” but “a potentially fat tailed” upside.  Part of that risk management comes from limits on position size, sector exposure and leverage.  Part from daily liquidity and performance monitoring.

Whitebox will, the managers believe, excel in two sorts of markets.  Their discipline works well in “calm, stable markets” and in the recovery phase after “pronounced market turmoil,” where prices have gotten seriously out-of-whack.  The experience of their hedge fund suggests that they have the ability to add serious alpha: from inception, the fund returned about 14% per year while the stock market managed 2.5%.

Are there reasons to be cautious?  Yep.  Two come to mind:

  1. The fund is expensive.  After waivers, retail investors are still paying nearly 2% plus a front load of 4.5%.  While that was more than offset by the fund’s past returns, current investors can’t buy past returns.
  2. Some hedge funds manage the transition well, others don’t.  As I noted above, success as a hedge fund – even sustained success as a hedge fund – has not proven to be a fool-proof predictor of mutual fund success.  The fund’s slightly older sibling, Whitebox Tactical Opportunities (WBMAX) has provided perfectly ordinary returns since inception (12/2011) and weak ones over the past 12 months.  That’s not a criticism, it’s a caution.

Bottom Line

There’s no question that the managers are smart, successful and experienced hedge fund investors.  Their writing is thoughtful and their arguments are well-made.  They’ve been entrusted with billions of other people’s money and they’ve got a huge personal stake – financial and otherwise – in this strategy.  Lacking a more sophisticated understanding of what they’re about and a bit concerned about expenses, I’m at best cautiously optimistic about the fund’s prospects.

Fund website

Whitebox Market Neutral Equity Fund.  (The Whitebox homepage is just a bit grandiose, so it seems better to go straight to the fund’s page.)

Fact Sheet

© Mutual Fund Observer, 2013. All rights reserved. The information here reflects publicly available information current at the time of publication. For reprint/e-rights contact us.

Seafarer Overseas Growth & Income (SFGIX)

By David Snowball

THIS IS AN UPDATE OF THE FUND PROFILE ORIGINALLY PUBLISHED IN July 2012. YOU CAN FIND THAT PROFILE HERE

Objective and Strategy

Seafarer seeks to provide long-term capital appreciation along with some current income; it also seeks to mitigate volatility. The Fund invests a significant amount – 20-50% of its portfolio – in the securities of companies located in developed countries. The remainder is investing in developing and frontier markets.  The Fund can invest in dividend-paying common stocks, preferred stocks, convertible bonds, and fixed-income securities. 

Adviser

Seafarer Capital Partners of San Francisco.  Seafarer is a small, employee-owned firm whose only focus is the Seafarer fund.

Managers

Andrew Foster is the lead manager.  Mr. Foster is Seafarer’s founder and Chief Investment Officer.  Mr. Foster formerly was manager or co-manager of Matthews Asia Growth & Income (MACSX), Matthews’ research director and acting chief investment officer.  He began his career in emerging markets in 1996, when he worked as a management consultant with A.T. Kearney, based in Singapore, then joined Matthews in 1998.  Andrew was named Director of Research in 2003 and served as the firm’s Acting Chief Investment Officer during the height of the global financial crisis, from 2008 through 2009.  Andrew is assisted by William Maeck and Kate Jaquet.  Mr. Maeck is the associate portfolio manager and head trader for Seafarer.  He’s had a long career as an investment adviser, equity analyst and management consultant.  Ms. Jaquet spent the first part of her career with Credit Suisse First Boston as an investment banking analyst within their Latin America group. In 2000, she joined Seneca Capital Management in San Francisco as a senior research analyst in their high yield group. Her responsibilities included the metals & mining, oil & gas, and utilities industries as well as emerging market sovereigns and select emerging market corporate issuers.

Management’s Stake in the Fund

Mr. Foster has over $1 million in the fund.  Both Maeck and Jaquet have between $100,000 and $500,000 invested.

Opening date

February 15, 2012

Minimum investment

$2,500 for regular accounts and $1000 for retirement accounts. The minimum subsequent investment is $500.

Expense ratio

1.40% after waivers on assets of $35 million (as of February 2013).  The fund has two fee waivers in place, a contractual waiver which is reflected in standard reports (such as those at Morningstar) but also a voluntary one which is not reflected elsewhere. The fund does not charge a 12(b)1 marketing fee but does have a 2% redemption fee on shares held fewer than 90 days.

Comments

Investors have latched on, perhaps too tightly, to the need for emerging markets exposure.  As of March 2013, e.m. funds had seen 21 consecutive weeks of asset inflows after years of languishing.  Any time there is that much enthusiasm for an asset class, prudent investors should pause.  But we also believe that prudent investors who want emerging markets exposure should start at Seafarer.  The case for Seafarer is straightforward: it’s going to be one of your best options for sustaining exposure to an important but challenging asset class.

There are four reasons to believe this is true.

First, Andrew Foster has been getting it right for a long time.  This is the quintessential case of “a seasoned manager at a nimble new fund.”  In addition to managing or co-managing Matthews Asian Growth & Income for eight years (2003-2011), he was a portfolio manager on Asia Dividend for six years and India Fund for five.  His hallmark piece, prior to Seafarer, indisputably was MACSX.  The fund’s careful risk management helped investors control the impulse to panic.  Volatility is the bane of most emerging markets funds (the group’s standard deviation is about 25, while developed markets average 15). The average emerging markets stock investor captured a mere 25 – 35% of their funds’ nominal gains. MACSX’s captured 90% over the decade that ended with Andrew’s departure and virtually 100% over the preceding 15 years.  The great debate surrounding MACSX during his tenure was whether it was the best Asia-centered fund in existence or merely one of the two or three best funds in existence. 

Second, Seafarer is independent.  Based on his earlier research, Mr. Foster believes that perhaps two-thirds of MACSX’s out-performance was driven by having “a more sensible” approach (for example, recognizing the strategic errors embedded in the index benchmarks which drive most “active” managers) and one-third by better security selection (driven by intensive research and over 1500 field visits).  Seafarer and its benchmarks focus on about 24 markets.  In 14 of them, Seafarer has dramatically different weightings than do the indexes (MSCI or FTSE) or his peers.  It’s striking, on a country-by-country level, how closely the average e.m. fund hugs its benchmark.  Seafarer dramatically underweights the BRICs and Korea, which represent 58% of the MSCI index but only 25% of Seafarer’s portfolio.  That’s made up for by substantially greater positions in Chile, Hong Kong, Japan, Poland, Singapore, Thailand and Turkey.  While the average e.m. fund seems to hold 100-250 names and index funds hold 1000, Seafarer focuses on 40.

Third, Seafarer is cautious. Andrew targets firms which are well-managed and capable of sustained growth.  He’s willing to sacrifice dramatic upside potential for the prospect of steady, long-term growth and income.  The stocks in his portfolio receive far high financial health and slightly lower growth scores from Morningstar than either indexed or actively managed e.m. funds as a group. Concern about stretched valuations led him to halve his small cap stake in 2012 and move into larger, steadier firms including those domiciled in developed markets. 

Combined with a greater interest in income in the portfolio, that’s given Seafarer noticeable downside protection.  E.M. funds as a group have posted losses in five of the past 12 months.  In those down months, their average loss is 2.9% per month.  In those same months, Seafarer posted an average loss of 1.3% (about 45% of the market’s).  In three of those five months, Seafarer made money.  That’s consistent with his long-term record.  During the global meltdown (10/07 – 03/09), his previous charge lost 34% but the average Asia fund dropped 58% and the average emerging markets fund dropped 59%.

Fourth Seafarer is rewarding.  In its first year, Seafarer returned 18% versus the MSCI emerging market index’s 3.8%.   It outperformed the only e.m. fund to receive Morningstar’s “Gold” designation, American Funds New World (NEWFX), the offerings from Vanguard, Price, Fidelity and PIMCO, its emerging markets peer group and First Trust/Aberdeen Emerging Opportunities (FEO), the best of the EM balanced funds.

Bottom Line

Mr. Foster is remarkably bright, thoughtful, experienced and concerned about the welfare of his shareholders.  He thinks more broadly than most and has more experience than the vast majority of his peers. The fund offers him more flexibility than he’s ever had and he’s using it well.  There are few more-attractive emerging markets options available.

Fund website

Seafarer Overseas Growth and Income.  The website is remarkably rich, both with analyses of the fund’s portfolio and performance, and with commentary on broader issues.

Disclosure: the Observer has no financial ties with Seafarer Funds.  I do own shares of Seafarer and Matthews Asian Growth & Income (purchased during Andrew’s managership there) in my personal account.

© Mutual Fund Observer, 2013. All rights reserved. The information here reflects publicly available information current at the time of publication. For reprint/e-rights contact us.

Matthews Asia Strategic Income (MAINX), February 2013

By David Snowball


This is an update of the fund profile originally published in February 2012, and updated in March 2012. You can find that profile here

Objective and Strategy

MAINX seeks total return over the long term with an emphasis on income. The fund invests in income-producing securities including, but not limited to, debt and debt-related instruments issued by government, quasi-governmental and corporate bonds, dividend-paying stocks and convertible securities (a sort of stock/bond hybrid).  The fund may hedge its currency exposure, but does not intend to do so routinely.  In general, at least half of the portfolio will be in investment-grade bonds.  Equities, both common stocks and convertibles, will not exceed 20% of the portfolio.

Adviser

Matthews International Capital Management. Matthews was founded in 1991 and advises the 13 Matthews Asia funds.   As of December 31, 2012, Matthews had $20.9 billion in assets under management.  On whole, the Matthews Asia funds offer below average expenses.  They also publish an interesting and well-written newsletter on Asian investing, Asia Insight.

Manager(s)

Teresa Kong is the lead manager.  Before joining Matthews in 2010, she was Head of Emerging Market Investments at Barclays Global Investors (now BlackRock) and responsible for managing the firm’s investment strategies in Emerging Asia, Eastern Europe, Africa and Latin America. In addition to founding the Fixed Income Emerging Markets Group at BlackRock, she was also Senior Portfolio Manager and Credit Strategist on the Fixed Income credit team.  She’s also served as an analyst for Oppenheimer Funds and JP Morgan Securities, where she worked in the Structured Products Group and Latin America Capital Markets Group.  Kong has two co-managers, Gerald Hwang, who for three years managed foreign exchange and fixed income assets for some of Vanguard’s exchange-traded funds and mutual funds before joining Matthews in 2011, and Robert Horrocks, Matthews’ chief investment officer.

Management’s Stake in the Fund

As of the April 2012 Statement of Additional Information, Ms. Kong and Mr. Horrocks each had between $100,000 and 500,000 invested in the fund.  About one-third of the fund’s Investor class shares were held by Matthews.

Opening date

November 30, 2011.

Minimum investment

$2500 for regular accounts, $500 for IRAs for the retail shares.  The fund’s available, NTF, through Fidelity, Scottrade, TD Ameritrade, TIAA-CREF and Vanguard and a few others.

Expense ratio

1.40%, after waivers, on $50 million in assets (as of January, 2013).  There’s also a 2% redemption fee for shares held fewer than 90 days.  The Institutional share class (MINCX) charges 1.0% and has a $3 million minimum.

Comments

The events of 2012 only make the case for Matthews Asia Strategic Income more intriguing.  Our original case for MAINX had two premises:

  1. Traditional fixed-income investments are failing. The combination of microscopic domestic interest rates with the slow depreciation of the U.S. dollar and the corrosive effects of inflation means that more and more “risk-free” fixed-income portfolios simply won’t meet their owners’ needs.  Surmounting that risk requires looking beyond the traditional.  For many investors, Asia is a logical destination for two reasons: the fundamentals of their fixed-income market is stronger than those in Europe or the U.S. and most investors are systematically underexposed to the Asian market.
  2.  Matthews Asia is probably the best tool you have for gaining that exposure.  They have the largest array of Asia investment products in the U.S. market, the deepest analytic core and the broadest array of experience.  They also have a long history of fixed-income investing in the service of funds such as Matthews Asian Growth & Income (MACSX).   Their culture and policies are shareholder-friendly and their success has been consistent. 

Three developments in 2012 made the case for looking at MAINX more compelling.

  1. Alarm about the state of developed credit markets is rising.  As of February 2013, Bill Gross anticipates “negative real interest rates approaching minus 2%” and warns “our credit-based financial markets and the economy it supports are levered, fragile and increasingly entropic – it is running out of energy and time.”  Templeton’s Dan Hasentab, “the man who made some of the boldest contrarian bets in the bond market last year has,” The Financial Times reported on January 30, “a new message for investors: get out of supposedly safe government debt now, before it is too late.” The 79 year old maestro behind Loomis Sayles Bond and Strategic Income, Dan Fuss, declares “This is the most overbought market I have ever seen in my life . . . What I tell my clients is, ‘It’s not the end of the world, but . . .”   

    Ms. Kong points to Asia as a powerful counterbalance to these concerns.  Its beta relative to US Treasuries bonds is among the lowest around: If, for example, the 5-year Treasury declines 1% in value, U.S. investment grade debt will decline 0.7%, the global aggregate index 0.5% and Asia fixed-income around 0.25%.

  2. Strategic Income performed beautifully in its first full year.  The fund returned 13.62% in 2012, placing it in the top 10% of Morningstar’s “world bond” peer group.  A more telling comparison was provided by our collaborator, Charles Boccadoro, who notes that the fund’s absolute and risk-adjusted returns far exceeded those of its few Asia-centered competitors.

  3. Strategic Income’s equity exposure may be rising in significance.  The inclusion of an equity stake adds upside, allows the fund to range across a firm’s capital structure and allows it to pursue opportunities in markets where the fixed-income segment is closed or fundamentally unattractive.  Increasingly, the top tier of strategists are pointing to income-producing equities as an essential component of a fixed-income portfolio.

Bottom Line

MAINX offers rare and sensible access to an important, under-followed asset class.  The long track record of Matthews Asia funds suggests that this is going to be a solid, risk-conscious and rewarding vehicle for gaining access to that class.  By design, MAINX will likely offer the highest Sharpe ratio (a measure of risk-adjusted returns) of any of the Matthews Asia funds. You really want to consider the possibility before the issue becomes pressing.

Fund website

Matthews Asia Strategic Income

Commentary

2013 Q3 Report

© Mutual Fund Observer, 2013. All rights reserved. The information here reflects publicly available information current at the time of publication. For reprint/e-rights contact us.

Artisan Global Equity Fund (ARTHX) – December 2012

By David Snowball

Objective and Strategy

The fund seeks to maximize long-term capital growth.  They invest in a global, all-cap equity portfolio which may include common and preferred stocks, convertible securities and, to a limited extent, derivatives.  They’re looking for high-quality growth companies with sustainable growth characteristics.  Their preference is to invest in firms that benefit from long-term growth trends and in stocks which are selling at a reasonable price.  Typically they hold 60-100 stocks. No more than 30% of the portfolio may be invested in emerging markets.  In general they do not hedge their currency exposure but could choose to do so if they owned a security denominated in an overvalued currency.

Adviser

Artisan Partners of Milwaukee, Wisconsin with Artisan Partners UK LLP as a subadvisor.   Artisan has five autonomous investment teams that oversee twelve distinct U.S., non-U.S. and global investment strategies. Artisan has been around since 1994.  As of 9/30/2012, Artisan Partners had approximately $70 billion in assets under management.  That’s up from $10 billion in 2000. They advise the 12 Artisan funds, but only 5% of their assets come from retail investors.

Manager

Barry P. Dargan is lead portfolio manager and Mark L. Yockey is portfolio manager.  Dargan and Yockey are jointly responsible for management of the fund, they work together to develop investment strategies but Mr. Dargan generally exercises final decision-making authority.  Previously, Mr. Dargan worked for MFS, as an investment analyst from 1996 to 2001 and as a manager of MFS International Growth (MGRAX) from 2001 to 2010.  Mr. Yockey joined Artisan in 1995 and is the lead manager for Artisan International (ARTIX) and Artisan International Small Cap (ARTJX).  The fact that Mr. Dargan’s main charge handily outperformed ARTIX over nearly a decade might have helped convince Artisan to bring him on-board.

Management’s Stake in the Fund

Mr. Dargan has over $1 million invested with the fund, and Mr. Yockey has between $500,000 and $1 million invested.  As of December 31, 2011, the officers and directors of Artisan Funds owned 16.94% of Artisan Global Equity Fund.

Opening date

March 29, 2010

Minimum investment

$1,000, which Artisan will waive if you establish an account with an automatic investment plan.

Expense ratio

1.50%, after waivers, on assets of $16.7 million. There is a 2% redemption fee for shares held less than 90 days.

Comments

Q:   What do you get when you combine the talents of two supremely successful international stock managers, a healthy corporate culture and a small, flexible fund?

A:   Artisan Global Equity.

The argument for considering ARTHX is really straightforward.  First, both managers have records that are both sustained and excellent.  Mr. Dargan managed, or co-managed, six funds, including two global funds, while at MFS.  Those included funds targeting both U.S. and non-U.S. investors.  While I don’t have a precise calculation, it’s clear he was managing more than $3 billion.  Mr. Yockey has famously managed two Artisan international funds since their inception, was once recognized as Morningstar’s International Fund Manager of the Year (1998).  For most trailing time periods, his funds have top 10% returns.  International Small Cap received Morningstar’s highest accolade when it was designated as the only “Gold” fund in its peer group while International was recognized as a “Silver” fund.  Based on head-to-head comparisons from 2001-2010, Mr. Yockey is really first rate and Mr. Dargan might be better.  (Being British, it’s almost certain that he has a cooler accent.)

Second, Artisan is a good steward.  The firm’s managers are divided into five teams, each with a distinctive philosophy and portfolio strategy.  The Global Equity team has four members (including Associate Portfolio Managers Charles Hamker and Andrew Euretig who also co-manage International Small Cap) and their discipline grows from the strategies first employed in ARTIX then extended to ARTJX.  Artisan has a very good record for lowering expenses, being risk conscious, opening funds only when they believe they have the capacity to be category-leaders (and almost all are) and closing funds before they’re bloated.

Third, ARTHX is nimble.  Its mandate is flexible: all sizes, all countries, any industry.  The fund’s direct investment in emerging markets is limited to 30% of the portfolio, but their pursuit of the world’s best companies leads them to firms whose income streams are more diverse than would be suggested by the names of the countries where they’re headquartered.  The managers note:

Though we have outsized exposure to Europe and undersized exposure to the U.S., we believe our relative country weights are of less significance since the companies we own in these developed economies continually expand their revenue bases across the globe.

Our portfolio remains centered around global industry leading companies with attractive valuations. This has led to a significant overweight position in the consumer sectors where many of our holdings benefit from significant exposure to the faster growth in emerging economies.

Since much of the world’s secular (enduring, long-term) growth is in the emerging markets, the portfolio is positioned to give them substantial exposure to it through their Europe and US-domiciled firms.  While the managers are experienced in handling billions, here they’re dealing with only $17 million.

The results are not surprising.  Morningstar believes that their analysts can identify those funds likely to serve their shareholders best; they do this by looking at a series of qualitative factors on top of pure performance.  When they find a fund that they believe has the potential to be consistently strong in the future, they can name it as a “Gold” fund.   Here are ARTHX’s returns since inception (the blue line) against all of Morningstar’s global Gold funds:

Artisan Global Equity versus gold funds

Not to say that the gap between Artisan and the other top funds is large and growing, but it is.

Bottom Line

Artisan Global Equity is an outstanding small fund for investors looking for exposure to many of the best firms from around the global.  The expenses are reasonable, the investment minimum is low and the manager is first-rate.  Which should be no surprise since two of the few funds keeping pace with Artisan Global Equity have names beginning with the same two words: Artisan Global Opportunities (ARTRX) and Artisan Global Value (ARTGX).

Fund website

Artisan Global Equity

© Mutual Fund Observer, 2012. All rights reserved. The information here reflects publicly available information current at the time of publication. For reprint/e-rights contact us.