


“Two roads diverged in a wood, and I—
I took the one less traveled by,
And that has made all the difference.”
Robert Frost
Like many metrics in the MFO screener, and indeed the screener itself, the latest come in response to requests from David to help uncover funds, usually younger, that don’t follow the crowd.
This time the need called for the correlation of a particular fund with its peers. A correlation coefficient, often denoted “R”, attempts to measure the tendency of two funds (their monthly total returns) to move together. Values of R can range from -1.00 to 1.00. The closer to 1.00, the more two funds have behaved similarly. The closer to -1.00, the more two funds have behaved opposite to each other.
While the screener already features a correlation matrix tool (see The Diversified Portfolio of Less Correlated Asset Classes), it’s limited to 12 funds. Peer count for categories like Large Cap Growth or Emerging Markets can be in the hundreds.
We decided to establish new reference funds, which represent the Average of Monthly Returns, for each of the 155 Categories. The respective reference fund(s) will now be included automatically in any Category searches. They will also serve as basis for the Correlation R versus Peer metric, which will be specific to the Display or evaluation Period selected.
In addition to R versus Peer, you will find three other correlations against key indices: S&P 500 Monthly Reinvested Index (denoted SP500), Barclays US Aggregate Total Return Index (USBond), and MSCI All Country World minus US Gross Dividends Reinvested Index (ACIxUS).
Finally, a related metric, beta, or beta coefficient, which, adopting from the Financial Times, is defined as follows: “A measure of a fund’s risk of volatility compared to the overall market. The market’s beta coefficient is 1.00. Any fund with a beta higher than 1.00 is considered more volatile than the market, and therefore riskier to hold, whereas a fund with a beta lower than 1.00 is expected to rise or fall more slowly than the market.” The market in this case is the S&P500.
All these newly added metrics help investors better understand their portfolio concentration and diversification (or lack of) and exposure to overall market risk. And, for David, to help seek-out unique funds, with thoughtful managers that don’t hug an index, worthy of your attention.
Here are a couple sample outputs illustrating funds with low Correlation R versus Peer, first for International Small/Mid-Cap Value funds this past year, which includes AlphaArchitect’s International Quantitative Value ETF QVAL (click image to enlarge):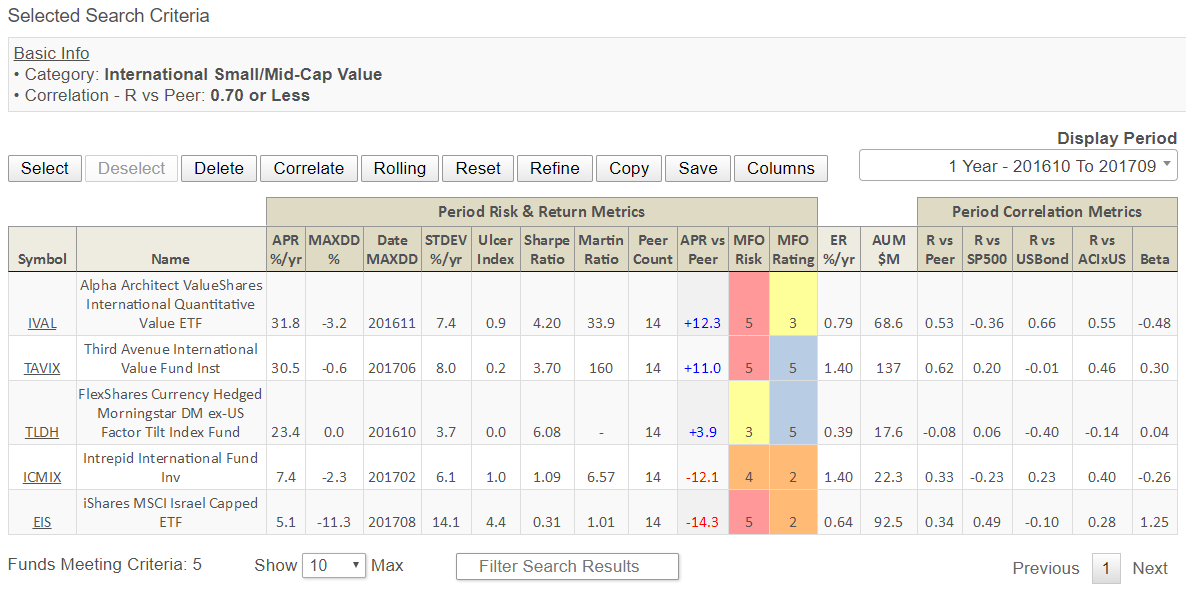
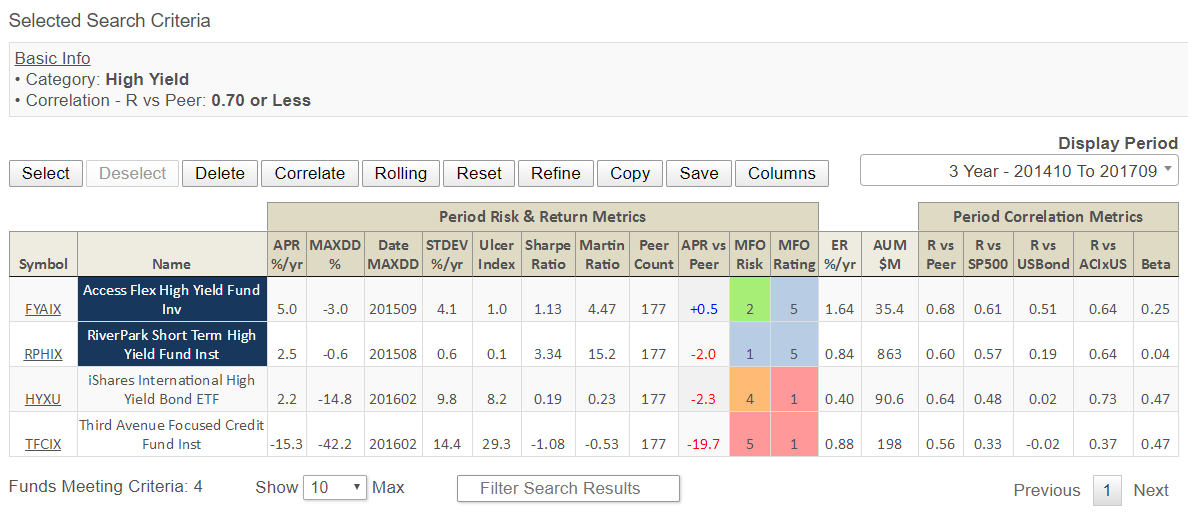
And for High Yield Bond funds this past 3 years, which includes RiverPark’s Short Term High Yield Fund RPHIX, an MFO Great Owl (click image to enlarge):