


Oddly enough, the most time-consuming part of investing for me is limiting my choices. To simplify and streamline the process, I looked at fund families with top performing mutual funds that are available as no-load funds with low minimum investments through Charles Schwab, Fidelity or Vanguard.
Investment Model
Hedge fund billionaire Ray Dalio, in our call of the day, says the global economy is in a “great sag” and the world has parallels to the 1930s… Speaking at a panel at the IMF and World Bank meeting in Washington, the founder of the world’s largest hedge fund, Bridgewater Associates, said he didn’t see a market or economic crash on the horizon but a “great sag.”
“Why the Bull Market Won’t End with a Typical Crash, Says Hedge Fund Billionaire Ray Dalio”(Marketwatch, 10/26/2019)
I built the Investment Model, shown in Chart #1, over the past 7 years to estimate an allocation to stocks and bonds that maximizes the return on $100 invested in January 1995 by adjusting to the business cycle. It takes into account dividends, total bond returns, monetary policy, financial risk, valuations, market trends and volatility, orders, production, sales, banking, corporate health, and money market flows, among many others. It now sits at the minimum allocation of 20% to stocks. Charles Boccadoro wrote a fascinating article in June 2017 called “How Bad Can It Get?”. He shows the maximum drawdown of various stock to bond allocations since 1932. Charles also shows the Martin Ratio (risk adjusted return) is highest for a 30/70 stock to bond portfolio.
The shaded area in Chart #1 provides guidance to whether I should be more aggressive or defensive, and for only the third time in 25 years, it is saying to be defensive, which does not imply being bearish. The indicator went negative in October 2000 and December 2008. During the next six months, the S&P 500 fell 14 and 9 percent respectively before entering a bear market. The next six months are important to watch for signs of a global recession. The negative factors impacting the Investment Model now are monetary policy (rising interests over the past two years and unwinding of the balance sheet), yield curve, global growth slowdown, increasing flows to money markets (risk aversion), construction, valuations, low potential GDP growth (labor, capacity, potential GDP), corporate (sales, income, profits), shipping, orders, manufacturing, and leading indicators, along with a few that just recently went negative. Twenty percent of the data is quarterly, so there may be revisions as more data becomes available in November.
CHART #1: INVESTMENT MODEL
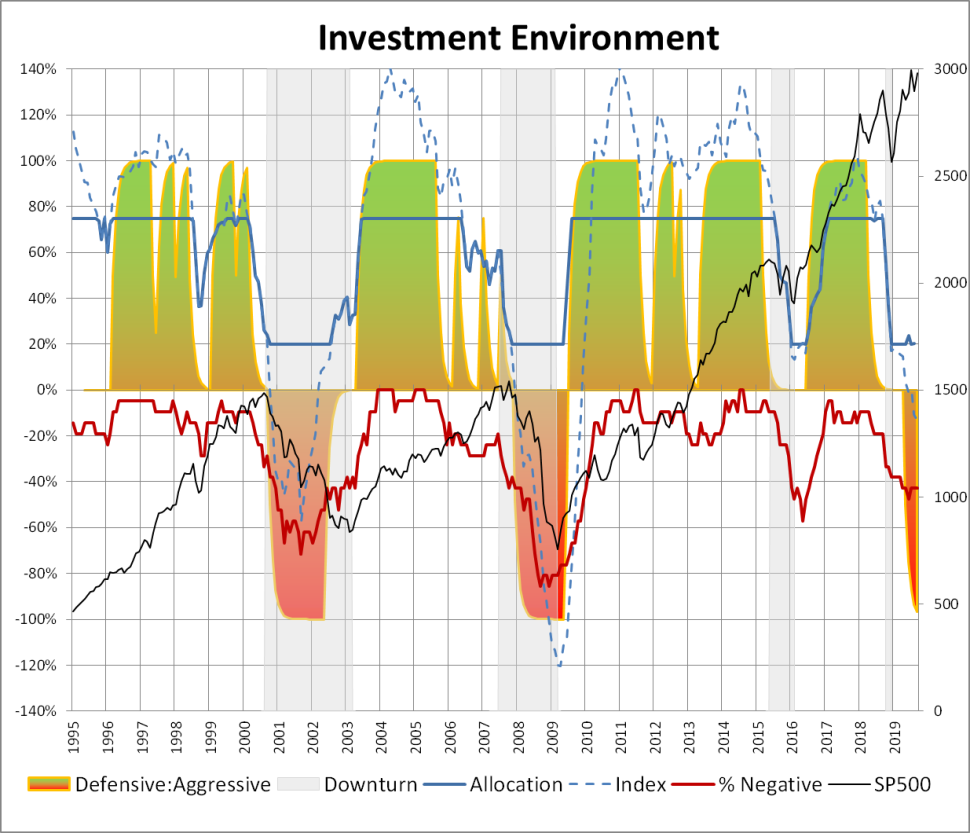
Source: Created by the Author
I use the MFO Premium screener to evaluate and implement the Investment Model by developing a ranking system based on Momentum (3 and 10 month trends and moving averages), Quality (bond rating, low leverage, Fund Family Rating, Ferguson Metrics, composite ratings), Valuation (price to earnings ratio, price to cash flow, price to book), Risk (Ulcer Index, MFO Risk, capture metrics, debt to equity, performance during recessions), Risk Adjusted Returns (Martin Ratio, MFO Rank, Great Owl and Honor Roll Classification), and Income (Yield).
The timeframe for all of the following data is 18 months.
We consciously selected an 18 month window because that corresponds with a period of rising volatility and intermittent market falls. The Investment Committee at Tweedy, Browne Company shares our judgment about the market shift we’re trying to capture:
Since early 2018, there have been periodic bouts of market volatility, which has translated into weakening correlations and improved idea flow for value investors like us. Past experience would suggest that prevailing investor anxiety is, in part, related to above-average risk asset valuations coupled with increasing macroeconomic uncertainty … we suspect that market volatility is likely to remain with us, and that should bode well for bargain hunting. (Investment Committee, Tweedy, Browne Company LLC, Third Quarter Commentary, October 2019)
From the perspective of a risk-aware investor, this shorter time-frame is more diagnostic than performance during years of unrelenting rises.
Limiting the Fund Families
Table 1 contains the final funds by family selected to be ranked. The rejected funds are mutual funds not available through Charles Schwab or Fidelity or that have high minimum investment requirements. The closed end funds were rejected based on high premiums or expenses using CEF Analyzer. “Barron’s Fund Family Ranking” is worth reading for those interested in more information about their views. I chose AMG because I like the Yacktman Focused Fund (YAFFX), Janus for the Janus Henderson Balanced (JABAX) fund, and Cohen & Steers for real estate funds.
| Fund Family | Mutual Fund | ETF | CEF | Total | # Funds with an MFO Rating >=4 | Great Owls |
| Blackrock | 42 | 110 | 29 | 181 | 113 | 20 |
| Fidelity | 114 | 13 | 0 | 127 | 83 | 16 |
| Invesco | 42 | 66 | 8 | 116 | 73 | 20 |
| Vanguard | 58 | 22 | 0 | 80 | 60 | 12 |
| MFS | 34 | 0 | 7 | 41 | 27 | 8 |
| PIMCO | 34 | 12 | 0 | 46 | 23 | 4 |
| T Rowe Price | 62 | 0 | 0 | 62 | 21 | 8 |
| Janus | 17 | 1 | 0 | 18 | 15 | 3 |
| Charles Schwab | 21 | 9 | 0 | 30 | 15 | 4 |
| State Street | 0 | 19 | 0 | 19 | 14 | 4 |
| Virtus | 19 | 0 | 1 | 20 | 13 | 2 |
| Nuveen | 11 | 4 | 17 | 32 | 12 | 0 |
| Cohen & Steers | 10 | 0 | 7 | 17 | 12 | 1 |
| AMG | 14 | 0 | 0 | 14 | 12 | 3 |
| American Funds | 34 | 0 | 0 | 34 | 11 | 6 |
| Other | 5 | 56 | 11 | 72 | 59 | 10 |
| Rejected | 50 | 0 | 32 | 82 | 51 | 31 |
| Total | 567 | 312 | 112 | 991 | 614 | 152 |
Source: Created by the author based on Mutual Fund Observer
Table #2 contains the four fund families with the most funds with a MFO Rating of 4 or higher per Lipper sub-type, along with the number of funds in those four families. The funds in Table #2 were only included if they were managed or enhanced, 5 years old or older, and non-institutional. Only AMG, MFS, and Invesco had top ranked alternative funds.
| U.S. Equity | Mixed Asset | Bond | Internat’l Equity | Global Equity | Sector Equity | Municipal Bond |
| Fidelity | Fidelity | Fidelity | Fidelity | MFS | Fidelity | Invesco |
| MFS | MFS | Vanguard | T Rowe Price | Virtus | Cohen & Steers | Vanguard |
| T Rowe Price | T Rowe Price | T Rowe Price | MFS | Janus | Invesco | Nuveen |
| AMG | Blackrock | Invesco | Virtus | Misc | Virtus | Fidelity |
| 44 | 58 | 37 | 45 | 13 | 34 | 16 |
Source: Created by the author based on LGDF data and MFO Premium screening
Ranking System
I built the ranking system for someone who invests according to the business cycle, is less tolerant of risk, or is interested in low to moderate risk with high risk adjusted returns. The Bear column refers to the average performance during the 2000 and 2007 bear markets. Each month, I compare the top ranked Lipper Categories to what I own to see if there is some small change that I should make. I personally think that many utility and real estate funds are over-bought as investors seek safety. In addition, many low volatility and conservative funds own large percentages of these categories. The key take away from this data is that investors have been flocking to safety, driving up the prices and returns. I believe that interest rates will fall further due to easing of monetary policy globally.
| Objective | Ulcer | Martin | Yield | RTN 3Month | RTN 1Year | Bear |
| Ultra-Short Obligations | 0.0 | 10.9 | 2.7 | 0.7 | 2.9 | 3.4 |
| Short Invest Grade Debt | 0.0 | + | 2.6 | 0.8 | 4.6 | 3.9 |
| Short U.S. Government Bond | 0.1 | 24.5 | 2.3 | 0.5 | 4.0 | 5.0 |
| Short-Intmdt Invest Grade Debt | 0.1 | 31.3 | 2.6 | 1.0 | 6.4 | 4.7 |
| Short U.S. Treasury | 0.1 | 17.2 | 2.2 | 0.6 | 3.9 | 7.2 |
| Short-Intmdt Muni Debt | 0.2 | 21.1 | 2.0 | 0.7 | 5.0 | + |
| GNMA | 0.3 | 9.0 | 2.7 | 1.2 | 7.2 | 8.6 |
| Intermediate Muni Debt | 0.3 | 14.4 | 2.3 | 1.4 | 8.2 | 5.7 |
| International Income | 0.4 | 48.6 | 2.8 | 3.0 | 11.6 | + |
| Gen & Ins Muni Debt | 0.4 | 16.3 | 2.8 | 1.8 | 9.1 | 2.5 |
| Core Bond | 0.4 | 11.9 | 2.9 | 2.1 | 10.1 | 4.5 |
| Global Income | 0.4 | 7.7 | 3.1 | 1.9 | 8.0 | 4.8 |
| High Yield Municipal Debt | 0.5 | 15.1 | 4.1 | 2.3 | 9.5 | (6.6) |
| Corp Debt BBB-Rated | 0.6 | 12.0 | 3.4 | 2.3 | 11.4 | + |
| General U.S. Government | 0.7 | 10.9 | 2.2 | 3.2 | 12.5 | 9.1 |
| General Bond | 0.9 | 9.9 | 5.0 | 3.3 | 13.4 | (0.3) |
| Utility | 1.1 | 16.9 | 2.7 | 7.8 | 22.7 | (31.3) |
| General U.S. Treasury | 1.1 | 10.7 | 2.2 | 4.9 | 17.5 | 12.3 |
| Income | 1.5 | 2.5 | 2.8 | 1.5 | 6.6 | (9.8) |
| EM Hard Currency Debt | 1.7 | 2.9 | 4.6 | 1.3 | 10.9 | (0.0) |
| Global Infrastructure | 2.0 | 5.9 | 2.1 | 2.5 | 16.8 | (35.8) |
| Real Estate | 2.5 | 7.8 | 3.4 | 7.3 | 18.9 | (21.8) |
Source: Created by the author based on LGDF data and MFO Premium screening
I have a preference for Fidelity and Vanguard mutual funds, but want to see how funds from other fund families are performing. Table #4 contains the top ranked fund for each top ranked Lipper Category.
| Objective | Vanguard | Fidelity | CEF | ETF | Other |
| International Income | VTABX | FCDSX | IAGG | TNIBX | |
| GNMA | VFIIX | FGMNX | GNMA | ||
| Utility | FSUTX | UTF | VPU | MMUFX | |
| Ultra-Short Obligations | VUSFX | FCNVX | MINT | TRBUX | |
| Short U.S. Government | VSGBX | FTSD | OPGVX | ||
| General & Insured Municipal Debt | VWAHX | FTABX | FMB | OPAMX | |
| General U.S. Government | FGOVX | AGZ | AMUSX | ||
| Short-Intmdt Investment Grade Debt | FTHRX | VCSH | BRASX | ||
| Intermediate Municipal Debt | VWITX | FLTMX | ITM | SWNTX | |
| General U.S. Treasury | VFITX | FUAMX | SCHR | PRULX | |
| Short Investment Grade Debt | VFSTX | FYBTX | SPSB | PRWBX | |
| High Yield Municipal Debt | NMZ | HYMB | ORNAX | ||
| Core Bond | VFICX | FTBFX | FBND | DODIX | |
| Short U.S. Treasury | VFISX | FUMBX | SCHO | ||
| Global Income | FGBFX | HOLD | PRSNX | ||
| Corporate Debt BBB-Rated | FCBFX | BHK | VCIT | BRACX | |
| Emerging Markets Hard Currency Debt | VWOB | TRECX | |||
| Income | VWINX | FFFAX | AOK | DIFAX | |
| General Bond | FPCIX | BBN | BAB | PTCIX | |
| Global Infrastructure | NFRA | CSUIX | |||
| Short-Intermediate Municipal Debt | VMLTX | FSTFX | SUB | OPITX | |
| Real Estate | VGSLX | FRIFX | RNP | REZ | CSEIX |
Source: Created by the author based on LGDF data and MFO Premium screening
Table #5 contains one of the highest rated funds for top ranked Lipper Categories. Each month, I create a list of funds and compare them to what I own to see if there is some small change that I want to make. Depending upon one’s investment needs, the funds in Tables 4 and 5 are an excellent starting point for building a low risk, high risk adjusted return portfolio.
| Recession Resistant Funds – 18 Months | ||||||||
| Symbol | Name | CAGR | MFO Risk | Ulcer | MFO Rating | Martin | GO? | Yield |
| TRBUX | T Rowe Price Ultra ST Bond | 3.1 | 1.0 | 0.0 | 5 | – | Yes | 2.8 |
| VCSH | Vanguard ST Corp Bond ETF | 5.1 | 1.0 | 0.0 | 5 | 62.5 | Yes | 2.8 |
| VTABX | Vanguard Total International Bond | 8.6 | 1.0 | 0.1 | 5 | 85.1 | Yes | 2.8 |
| VFIIX | Vanguard GNMA | 5.4 | 1.0 | 0.3 | 5 | 9.6 | No | 2.9 |
| VGIT | Vanguard Intermediate-Term Treasury ETF | 7.2 | 2.0 | 0.3 | 5 | 14.9 | No | 2.2 |
| DODIX | Dodge & Cox Income | 6.2 | 1.0 | 0.3 | 5 | 12.7 | Yes | 3.1 |
| VWAHX | Vanguard High Yield Tax-Exempt | 8.1 | 1.0 | 0.4 | 4 | 14.1 | No | 3.4 |
| PRSNX | T Rowe Price Global MltiSect Bond | 6.9 | 1.0 | 0.7 | 3 | 7.0 | No | 3.5 |
| JMUIX | Janus Henderson Multi-Sect Income | 6.5 | 1.0 | 0.3 | 5 | 12.8 | Yes | 4.6 |
| TRECX | T Rowe Price EM Market Corp Bond | 6.2 | 2.0 | 1.2 | 5 | 3.5 | Yes | 4.7 |
| FRIFX | Fidelity Real Estate Income | 12.1 | 2.0 | 1.0 | 5 | 10.0 | Yes | 4.3 |
| VWINX | Vanguard Wellesley Income | 8.2 | 2.0 | 1.0 | 5 | 6.3 | Yes | 2.9 |
| JGDIX | Janus Henderson Global Inc Mngd Vol | 7.8 | 2.0 | 1.3 | 5 | 4.4 | Yes | 3.2 |
| TAIAX | American Funds Tx-Adv Grwth&Inc Port | 5.5 | 2.0 | 1.5 | 5 | 2.3 | Yes | 2.5 |
| SPLV | Invesco S&P 500 Low Volatility ETF | 16.5 | 3.0 | 1.8 | 5 | 7.8 | Yes | 2.0 |
| JERIX | Janus Henderson Global Real Estate | 15.0 | 3.0 | 2.5 | 4 | 5.2 | No | 2.9 |
| LVHD | Legg Mason Low Vol High Dividend ETF | 9.6 | 3.0 | 2.1 | 5 | 3.5 | Yes | 3.7 |
| XMLV | Invesco S&P MidCap Low Volatility ETF | 14.0 | 4.0 | 2.5 | 5 | 4.8 | Yes | 1.9 |
| VMNVX | Vanguard Global Min Vol | 10.8 | 3.0 | 2.5 | 5 | 3.5 | Yes | 2.1 |
| VIG | Vanguard Dividend Appreciation ETF | 12.0 | 4.0 | 3.6 | 5 | 2.8 | Yes | 1.7 |
Source: Created by the author based on LGDF data and MFO Premium screening
Here’s how to read that table. T. Rowe Price Ultra Short Term Bond (TRBUX), the first fund listed, has returned an annually 3.1% over the past 18 months. It falls in MFO’s lowest risk group (1) and has an Ulcer Index of zero. The Ulcer Index factors together the depth and duration of a fund’s drawdowns; funds that go down a long way and stay there a long while are the source of … well, ulcers. The lower the Ulcer Index, the better. In this case, TRBUX had no monthly drawdown at all, so the Ulcer Index is zero. The MFO Rating assesses a fund’s risk-adjusted returns based on the Martin Index; the Martin Index itself measures a fund’s performance during drawdowns, based on the logic that volatility on the upswing is annoying but volatility on the downside is disastrous. So a high MFO rating and high Martin Ratio are both good; in TRBUX’s case, the Martin is actually incalculably high so the space is blank. The Great Owl status tells you that the fund consistently ranks in the top tier of its peer group by risk-adjusted performance. On whole, you’d describe it as a flawless performance with about 3% annual returns.
Closing
What I gained from this is exercise is a list of fund families that can be purchased at the investment companies that I use and a list of funds which are not considered due to load fees, availability, or having high minimum investment requirements. It reduces the research required looking at individual funds. I continue to automate the process so that each month it requires less time. The Multisearch and new Portfolio tools at MFO Premium are powerful and easy to use. For most investors, the available tools are all that is required.
Disclaimer
I am not an economist nor an investment professional. I became interested in economic forecasting and modeling in 2007 when a mortgage loan officer told me that there was a huge financial crisis coming. There were signs of financial stress if you knew where to look. I have read dozens of books on business cycles since then. Discovering the rich database at the St. Louis Federal Reserve (FRED) provides most of the data to create an Investment Model. The tools at Mutual Fund Observer provide the means for implementing and validating the Investment Model.
Resources
Excellent books on investment models and business cycles are Nowcasting the Business Cycle by James Picerno, Conquering the Divide by Cornehlsen and Carr, Investing with the Trend by Gregory L. Morris, Ahead of the Curve by Joseph H. Ellis, Probable Outcomes by Ed Easterling, The Era of Uncertainty by Francois Trahan and Katerine Krantz, The Research Driven Investor by Timothy Hayes, and Beating the Market 3 Months at a Time by Gerald Appel and Marvin Appel.