


One of the questions that I am sometimes asked is why do I own so many funds? The answer is that I have a dual-income family with different employer sponsors, different types of tax-advantaged accounts, brokerage accounts, and that I like to set aside a portion of my assets to invest according to the business cycle and trends. With Mutual Fund Observer, computers, and the internet, it is no more difficult or costly to manage 20 or more funds than it is 5.
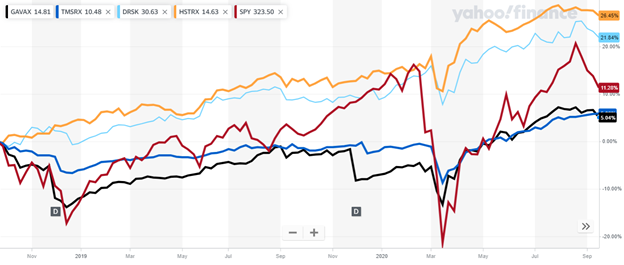
I identified in Flexible Portfolio Funds With High Risk-Adjusted Returns that KL Allocation (GAVAX), a Flexible Portfolio Fund, is one that I may be interested in purchasing. In this article, I look at the fund performance of 17 funds over the past 25 years to enhance a strategy of how I want to invest over the coming decade with stock valuations so high, and interest rates so low. The focus is on Flexible Portfolio Funds but includes Alternative Multi-Strategy Funds and Absolute Return Funds among others. I have narrowed the list of funds to consider to 15. The four finalist funds are T. Rowe Price Multi-Strategy Total Return (TMSRX), an Alternative Multi-Strategy fund, and KL Allocation Fund (GAVAX/GAVIX), which are described by David Snowball, Aptus Defined Risk ETF (DRSK) described by Alpha Gen Capital in Fund Spotlight: Aptus Defined Risk Strategy ETF, and Hussman Strategic Total Return (HSTRX). These are shown in Table #1 and Figure #1. The difference for GAVAX between the return in the table and price in the figure is that it paid an annual dividend of 7.5% TTM. All four funds had low drawdowns during the COVID bear market.
Table #1: September Finalist Funds (Two Years)
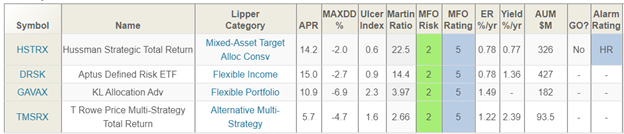
Source: MFO Premium fund screener and Lipper Global Datafeed
Figure #1: September Finalist Funds (Two and a Half Years)
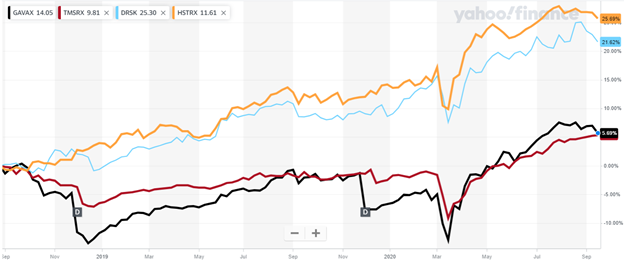
Source: Yahoo Finance
Table #2 contains funds that I own or am interested in purchasing plus benchmark funds such as Vanguard Wellesley Income (VWINX), Wellington (VWELX), and Short-Term Treasury (VFISX). The metrics are for the past two years, sorted by the lowest Risk, highest Risk-Adjusted Return to more tactical funds with higher risk and lower risk-adjusted returns. My preference in this environment is to have a majority of assets in Conservative (MFO Risk =2) and Moderate (MFO Risk =3) funds.
Table #2: Funds Evaluated – Two Year Metrics
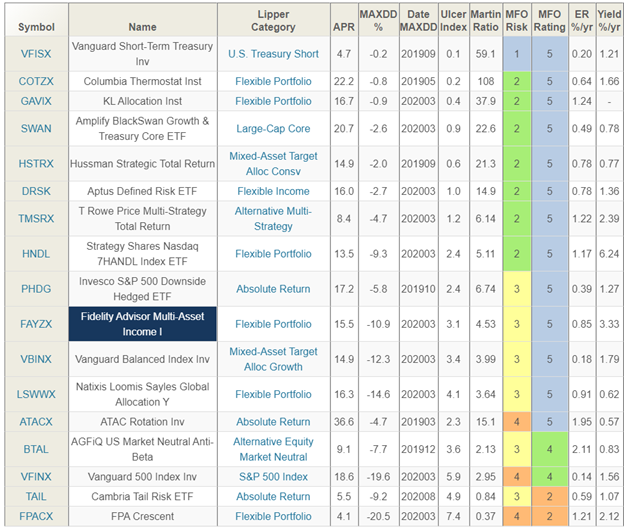
Source: MFO Premium fund screener and Lipper Global Datafeed
The 25 Year Funds and View
For this article, I used the MFO Premium fund screener to select the funds by age group, and Portfolio Visualizer (PV) to create three portfolios: 1) Equal Weight, 2) Maximum Return with volatility equal to the Vanguard Balanced Index Fund, and 3) Maximum Sharpe Ratio. I limited allocations per fund to 20%. Table #3 contains the MFO metrics for 20 Years, and Table #4 contains the PV results. The three portfolios performed as well as the Vanguard Balanced Fund, but the advantage is that they follow a bucket approach with short term funds in safer buckets for withdrawals. FPA Crescent (FPACX) is the standout fund. Notice that Loomis Sayles Global Allocation Fund remains a fund selected by Portfolio Visualizer to maximize return at the same volatility as the Vanguard Balanced Fund throughout the following time periods. Notice that the portfolios outperformed the Vanguard Balanced Fund until the past 8 years which may be a distortion of quantitative easing. The link to Portfolio Visualizer is here.
Table #3: Funds Metrics (20 Years)
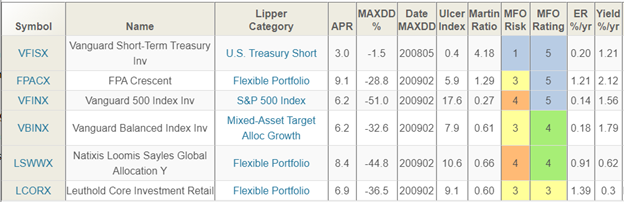
Source: MFO Premium fund screener and Lipper Global Datafeed
Table #4: Portfolios for the Past 25 Years
| Ticker | Name | Allocation | Max Rtn @ 9.5% Vol | Max Sharpe | VBINX |
| VFISX | Vanguard Short-Term Treasury | 17.0% | 9.5% | 20.0% | |
| VBINX | Vanguard Balanced Index | 17.0% | 20.0% | 20.0% | |
| VFINX | Vanguard 500 Index Investor | 17.0% | 10.5% | ||
| LCORX | Leuthold Core Investment | 17.0% | 20.0% | 20.0% | |
| LSWWX | Loomis Sayles Global Alloc | 16.0% | 20.0% | 20.0% | |
| FPACX | FPA Crescent | 16.0% | 20.0% | 20.0% | |
| Return | 8.1% | 8.4% | 7.9% | 7.9% | |
| Maximum Drawdown | -31.4% | -32.9% | -27.9% | -32.6% |
Figure #2: Portfolios for the Past 25 Years
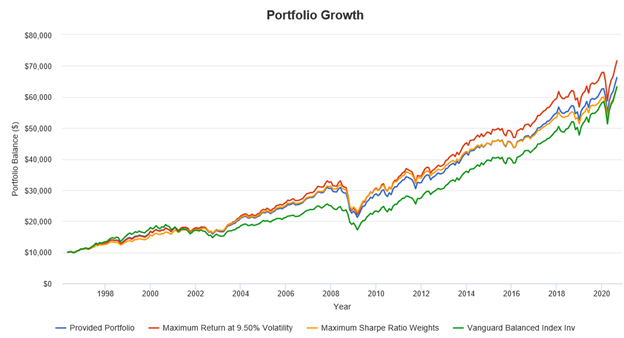
Source: Portfolio Visualizer
The 18 Year Funds and View
Columbia Thermostat (COTZX) and Hussman Strategic Total Return (HSTRX) are added to the option of funds to evaluate funds for the past 18 years. These funds replace LCORX as optimized funds in Portfolio Visualizer. The standout fund is HSTRX, and FPA Crescent continues to be a top performer. Again, the only advantage is the bucket approach. The link to Portfolio Visualizer is here.
Table #5: Funds Metrics (15 Years)
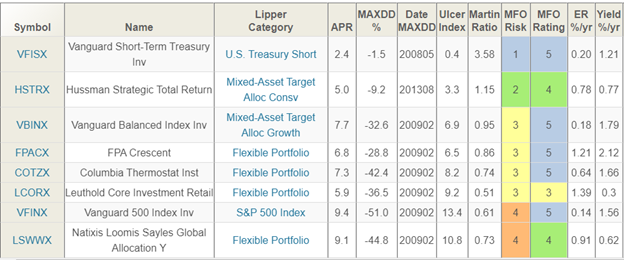
Source: MFO Premium fund screener and Lipper Global Datafeed
Table #6: Portfolios for the Past 18 Years
| Ticker | Name | Provided | Max Rtn @ 9% Vol | Max Sharpe | VBINX |
| VFISX | Vanguard Short-Term Treasury Inv | 13.0% | 20.0% | ||
| VBINX | Vanguard Balanced Index Inv | 13.0% | 20.0% | 20.0% | |
| VFINX | Vanguard 500 Index Investor | 13.0% | 17.1% | ||
| COTZX | Columbia Thermostat Inst | 13.0% | 12.7% | 15.0% | |
| HSTRX | Hussman Strategic Total Return | 12.0% | 20.0% | 20.0% | |
| LCORX | Leuthold Core Investment Retail | 12.0% | |||
| LSWWX | Loomis Sayles Global Allocation Y | 12.0% | 20.0% | 10.2% | |
| FPACX | FPA Crescent | 12.0% | 10.1% | 14.8% | |
| Return | 8.0% | 8.8% | 6.9% | 8.5% | |
| Maximum Drawdown | -29.5% | -33.1% | -21.9 | -32.6% |
Source: Portfolio Visualizer
Figure #3: Portfolios for the Past 18 Years
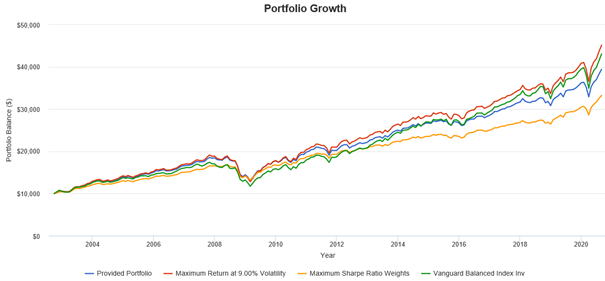
Source: Portfolio Visualizer
The 10 Year Funds and View
The KL Allocation Fund (GAVIX/GAVAX) is added to the funds to be considered for the 10-year analysis. This time period covers the QE driven bull market with no major dips. Columbia Thermostat (COTZX) is the outstanding fund. GAVIX and HSTRX are lower risk, but with lower performance. Portfolio Visualizer favors COTZX, GAVIX/GAVAX, and to a lesser extent HSTRX. The link to Portfolio Visualizer is here.
Table #7: Funds Metrics (9 Years)
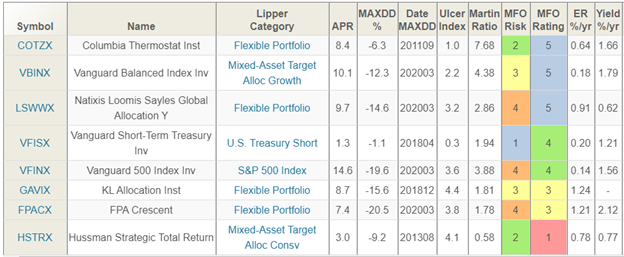
Source: MFO Premium fund screener and Lipper Global Datafeed
Table #8: Portfolios for past 10 Years
| Ticker | Name | Provided | Max Rtn @ 8.2% Vol | Max Sharpe | VBINX |
| VFISX | Vanguard Short-Term Treasury Inv | 13.0% | 20.0% | ||
| VBINX | Vanguard Balanced Index Inv | 13.0% | 20.0% | 20.0% | |
| VFINX | Vanguard 500 Index Investor | 13.0% | 20.0% | 2.2% | |
| COTZX | Columbia Thermostat Inst | 13.0% | 20.0% | 20.0% | |
| HSTRX | Hussman Strategic Total Return | 12.0% | 2.4% | 17.8% | |
| GAVAX | KL Allocation Advisor | 12.0% | 20.0% | 20.0% | |
| LSWWX | Loomis Sayles Global Allocation Y | 12.0% | 17.6% | ||
| FPACX | FPA Crescent | 12.0% | |||
| Return | 7.9% | 10.0% | 6.5% | 9.9% | |
| Maximum Drawdown | -8.3 | -10.1 | -4.0 | -12.3 |
Source: Portfolio Visualizer
Figure #4: Portfolios for past 10 Years
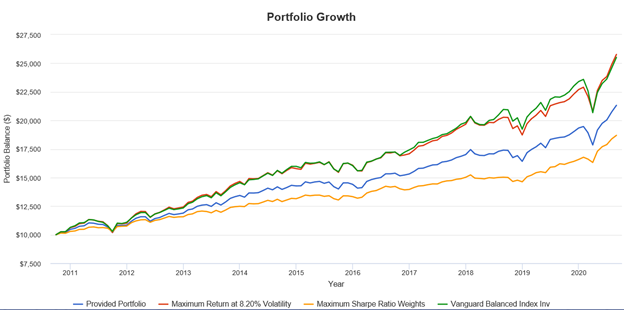
Source: Portfolio Visualizer
The 2 Year View
For the 2 Year View, I gave Portfolio Visualizer the ability to select all funds, but limited allocations to most alternative funds to 20% of the portfolio. The portfolio with the Maximum Sharpe ratio (highest return for the volatility) continues to select COTZX, HSTRX, and GAVAX. It adds T. Rowe Price Multi-Strategy Total Return (TMSRX), and several of the alternative ETFs. The Maximum Sharpe Ratio separates itself from the equal weight and Max Return Portfolios, and VBINX by having a very low maximum drawdown. Cambria Tail Risk (TAIL) is a defensive fund that moves in has moved up when the S&P500 goes down but holds its value fairly well when the S&P 500 goes up. and AGFiQ US Market Neutral Anti-Beta (BTAL) does well when low beta funds outperform high beta such as during market downturns. The link to Portfolio Visualizer is here.
Table #7: Funds Metrics (2 Years)
| Ticker | Name | Allocation | Max Rtn @ 13% Vol | Max Sharpe | VBINX |
| VFISX | Vanguard Short-Term Treasury | 8.0% | 20.0% | ||
| VBINX | Vanguard Balanced Index Inv | 8.0% | |||
| VFINX | Vanguard 500 Index Investor | 8.0% | 20.0% | ||
| COTZX | Columbia Thermostat Inst | 8.0% | 20.0% | 20.0% | |
| HSTRX | Hussman Strategic Total Return | 8.0% | 11.0% | ||
| GAVAX | KL Allocation Advisor | 8.0% | 10.1% | 11.8% | |
| LSWWX | Loomis Sayles Global Allocation | 8.0% | 20.0% | ||
| FPACX | FPA Crescent | 8.0% | |||
| TAIL | Cambria Tail Risk ETF | 3.0% | 5.0% | ||
| DRSK | Aptus Defined Risk ETF | 3.0% | |||
| HNDL | Strategy Shares Nasdaq 7 Handl ETF | 3.0% | |||
| FMSDX | Fidelity Multi-Asset Income | 8.0% | 20.0% | ||
| SWAN | Amplify BlackSwan Gr&Trsry Cor | 3.0% | 5.0% | 5.0% | |
| ATACX | ATAC Rotation Investor | 3.0% | 5.0% | ||
| BTAL | AGFiQ US Market Neutral Anti-Beta | 3.0% | 5.0% | ||
| PHDG | Invesco S&P 500 Downside Hedged | 2.0% | 5.0% | ||
| TMSRX | T. Rowe Price Multi-Strategy Ttl Ret | 8.0% | 17.2% | ||
| Return | 14.3 | 18.7 | 12.5 | 14.2 | |
| Maximum Drawdown | -5.6% | -8.8% | -0.7% | -12.3% |
Source: Portfolio Visualizer
Figure #5: Portfolios for past 2 Years
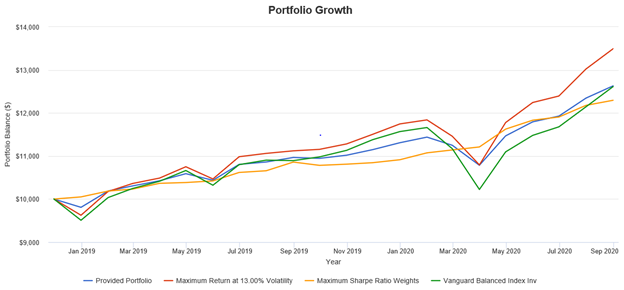
Source: Portfolio Visualizer
Closing
The best funds for an investor depends upon many factors including philosophy, risk tolerance, funds available at their broker, and what they already own. I own six of the funds covered in this article including TMSRX and HSTRX, and others. I like to own more funds to limit the risk of the poor performance of any asset. I believe markets during the next decade will be more volatile and a more active approach is warranted by investors willing and able to do the research. My preference is to invest in funds that manage the risk. For these reasons, I plan to add GAVAX as a long term holding to my portfolio. I will add DRSK as more of a tactical fund.
Figure #6: Finalist Funds
Source: Yahoo Finance
Disclaimer
I am not an economist nor an investment professional. I became interested in economic forecasting and modeling in 2007 when a mortgage loan officer told me that there was a huge financial crisis coming. There were signs of financial stress if you knew where to look. I have read dozens of books on business cycles since then. Discovering the rich database at the St. Louis Federal Reserve (FRED) provides most of the data to create an Investment Model. The tools at Mutual Fund Observer provide the means for implementing and validating the Investment Model.