Monthly Archives: October 2023

October 1, 2023

By David Snowball

Welcome to October, a fierce month!

It’s a month of apple harvests and Atlantic hurricanes (214 of them). Of a temperature roller coaster and of market crashes (1907, 1929, and 1987 – days with the word “Black” attached to their names, stand out). Of bonfires and of Great Fires (Mrs. O’Leary and her cow were framed, I tell ya). Of wars (from the Battle of Hastings in 1066 through the Second World War, October was always seen as your last chance for a quick land grab before wintry weather closed you down for the season) and rumors of wars (the Cuban Missile Crisis which, happily, didn’t trigger a global war in part because of President Kennedy’s familiarity with the political intransigence and misunderstanding that triggered the First World War). Of a thinning wall between the Here and the There and of troublesome spirits leaking through.

I sympathize with Joy Fielding’s description of the month in her murder mystery, Tell Me No Secrets (2016): “October was always the least dependable of months… full of ghosts and shadows.”

In the Observer this month

Devesh Shah, who has a formidable amount of experience as an investment professional, takes a long and deeply unsettled look at where high interest rates are taking us in “Another such victory and I am undone.” 

Lynn Bolin reminisces on his first year in retirement, offering reflections on both the portfolio implications and the need to set goals far beyond money.

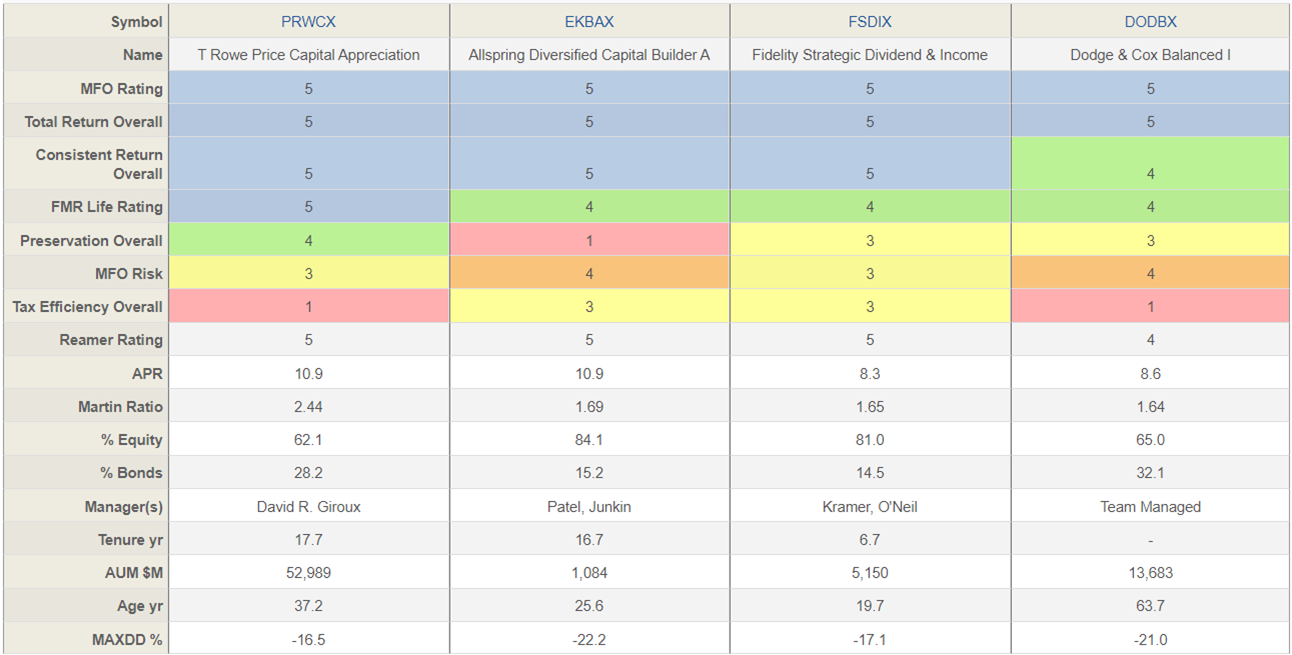
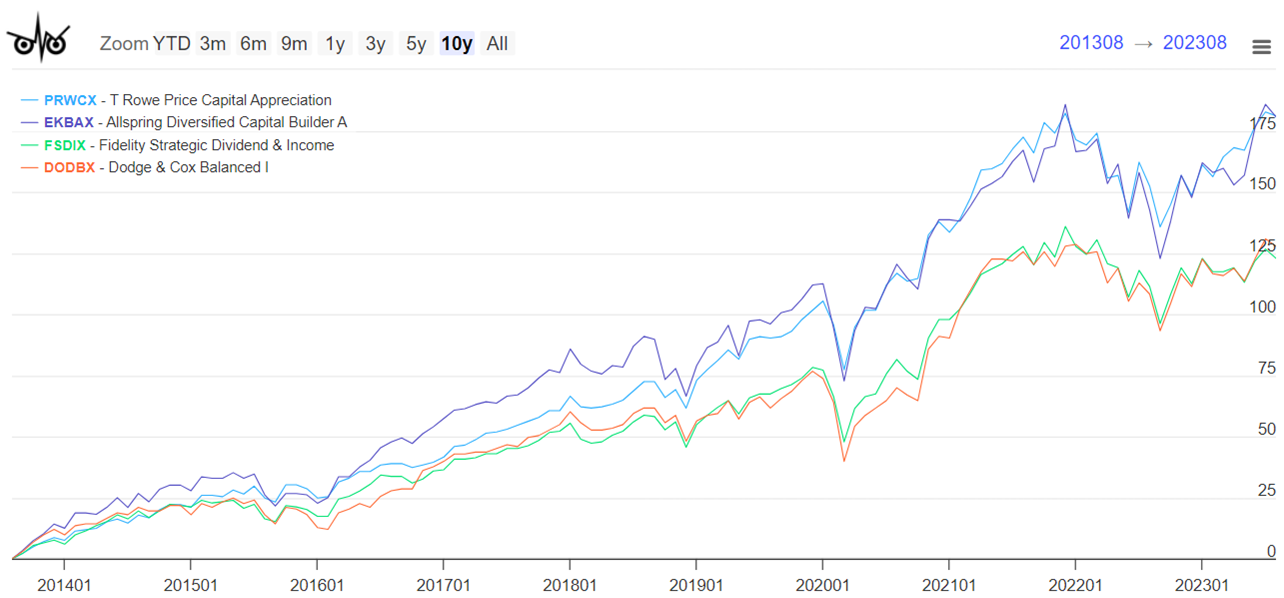
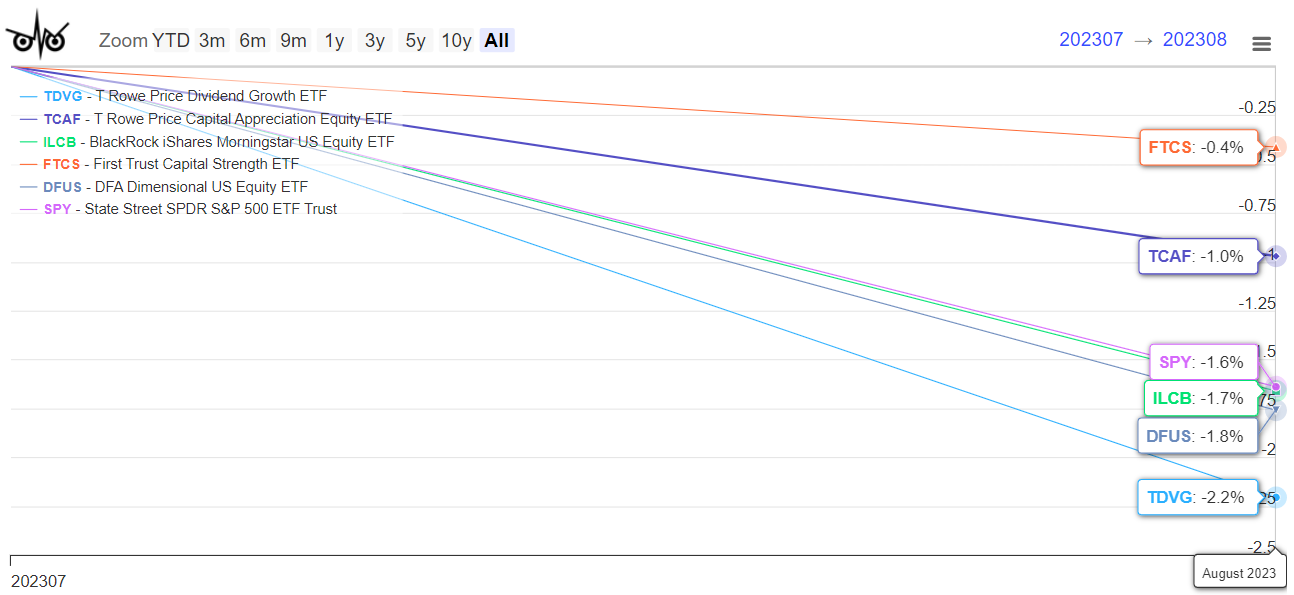
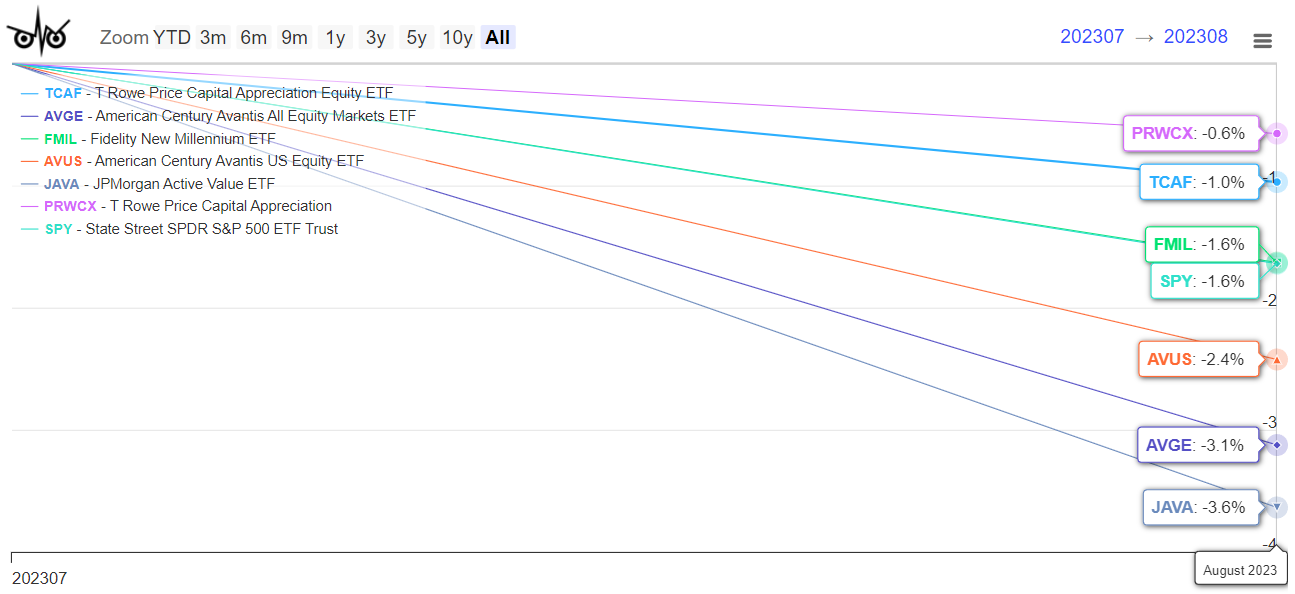
Lynn Bolin also weighs in on the newly launched T. Rowe Price Capital Appreciation Equity ETF and compares it – not entirely favorably – to its famous forebear, T. Rowe Price Capital Appreciation Fund.

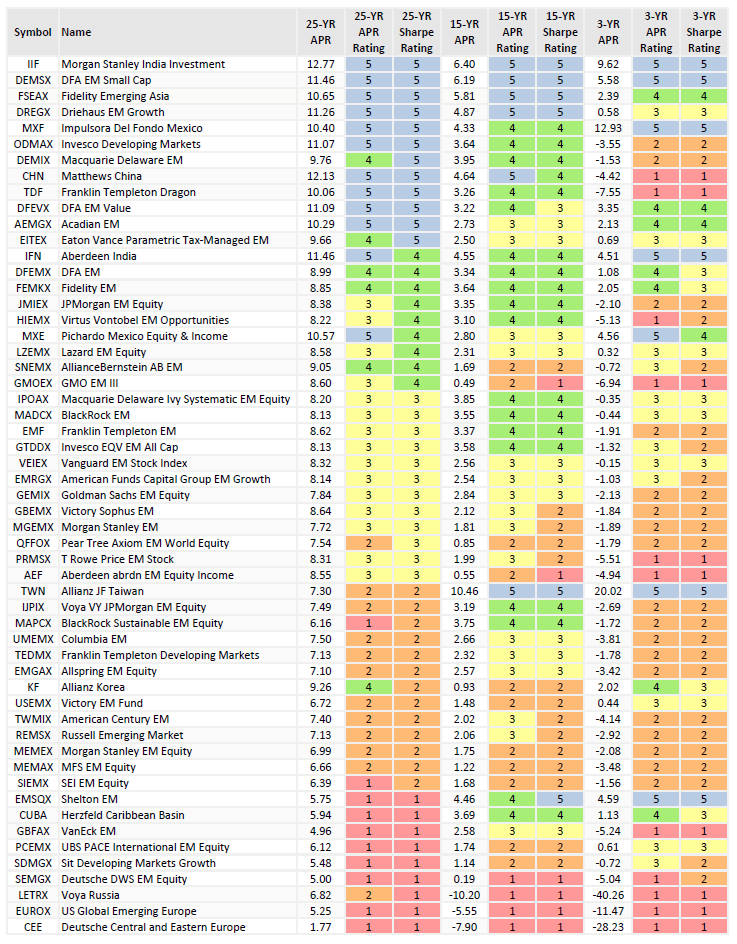
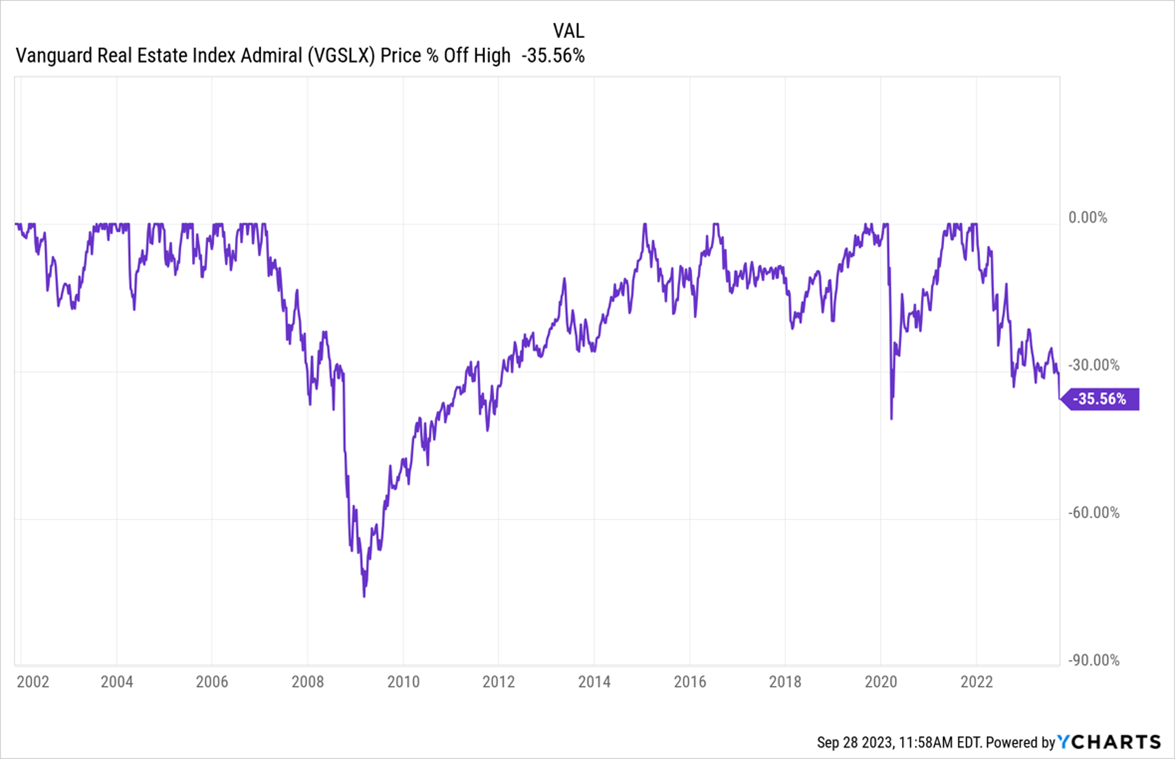
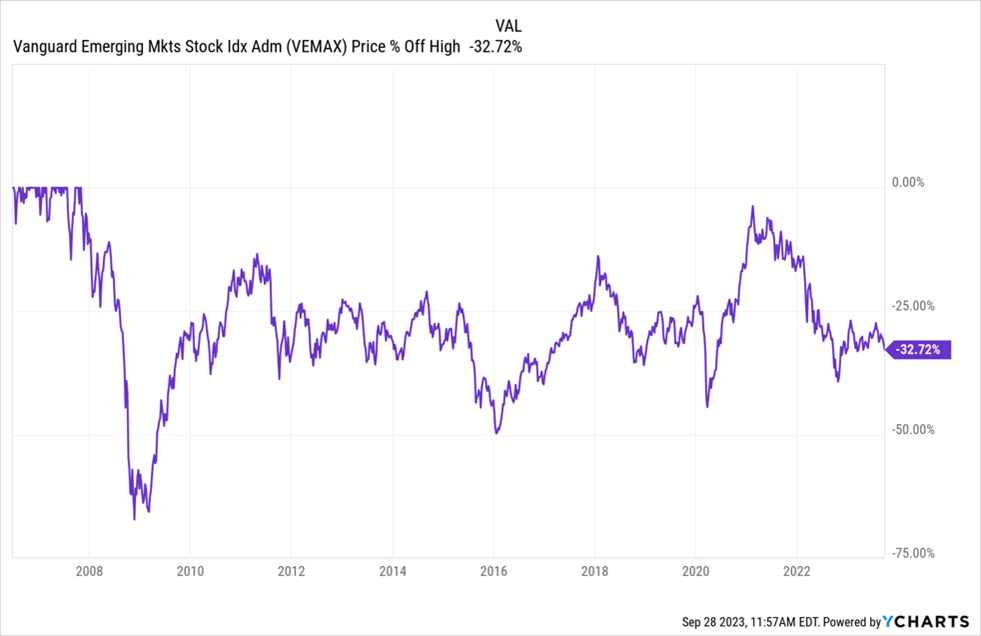
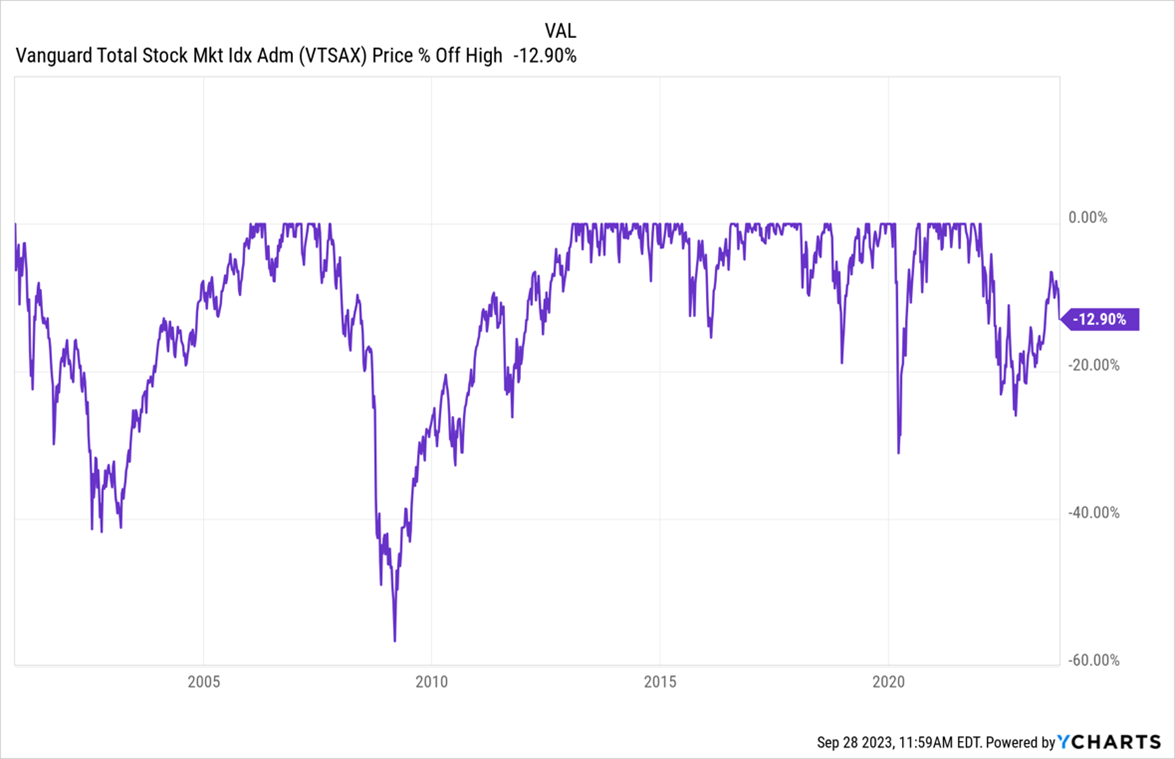
On the 25th anniversary of the Long-Term Capital Management collapse, roughly the 15th anniversary of the Global Financial Crisis, and the third anniversary of the Covid bear, all of which hit emerging markets harder than any other, we look at the EM funds that have been through it all and identity the few who have served their investors honorably despite “the slings and arrows of outrageous fortune” (with a nod to Prince Hamlet) … and also those that manage to crash at every opportunity, and that still hold billions in assets.

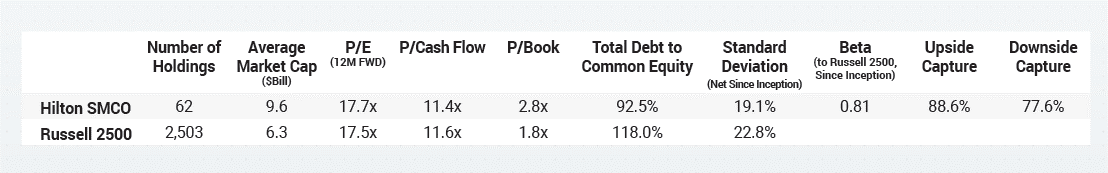
I highlight two funds in the SEC pipeline that might bear watching, most notably the Hilton Small-MidCap Opportunity ETF.

And The Shadow, as always, tracks the industry’s news, including a series of lawsuits (hello, TIAA!) and SEC enforcement actions (against DWS, William Blair, Wellesley Asset Management, and others), new names, new Vanguard ETFs and the closure of one entire family of funds.

The Hunt for Red October

(With due credit to Leuthold’s Doug Ramsey for appropriating the phrase to capture the current moment in the markets. More below from Doug.)

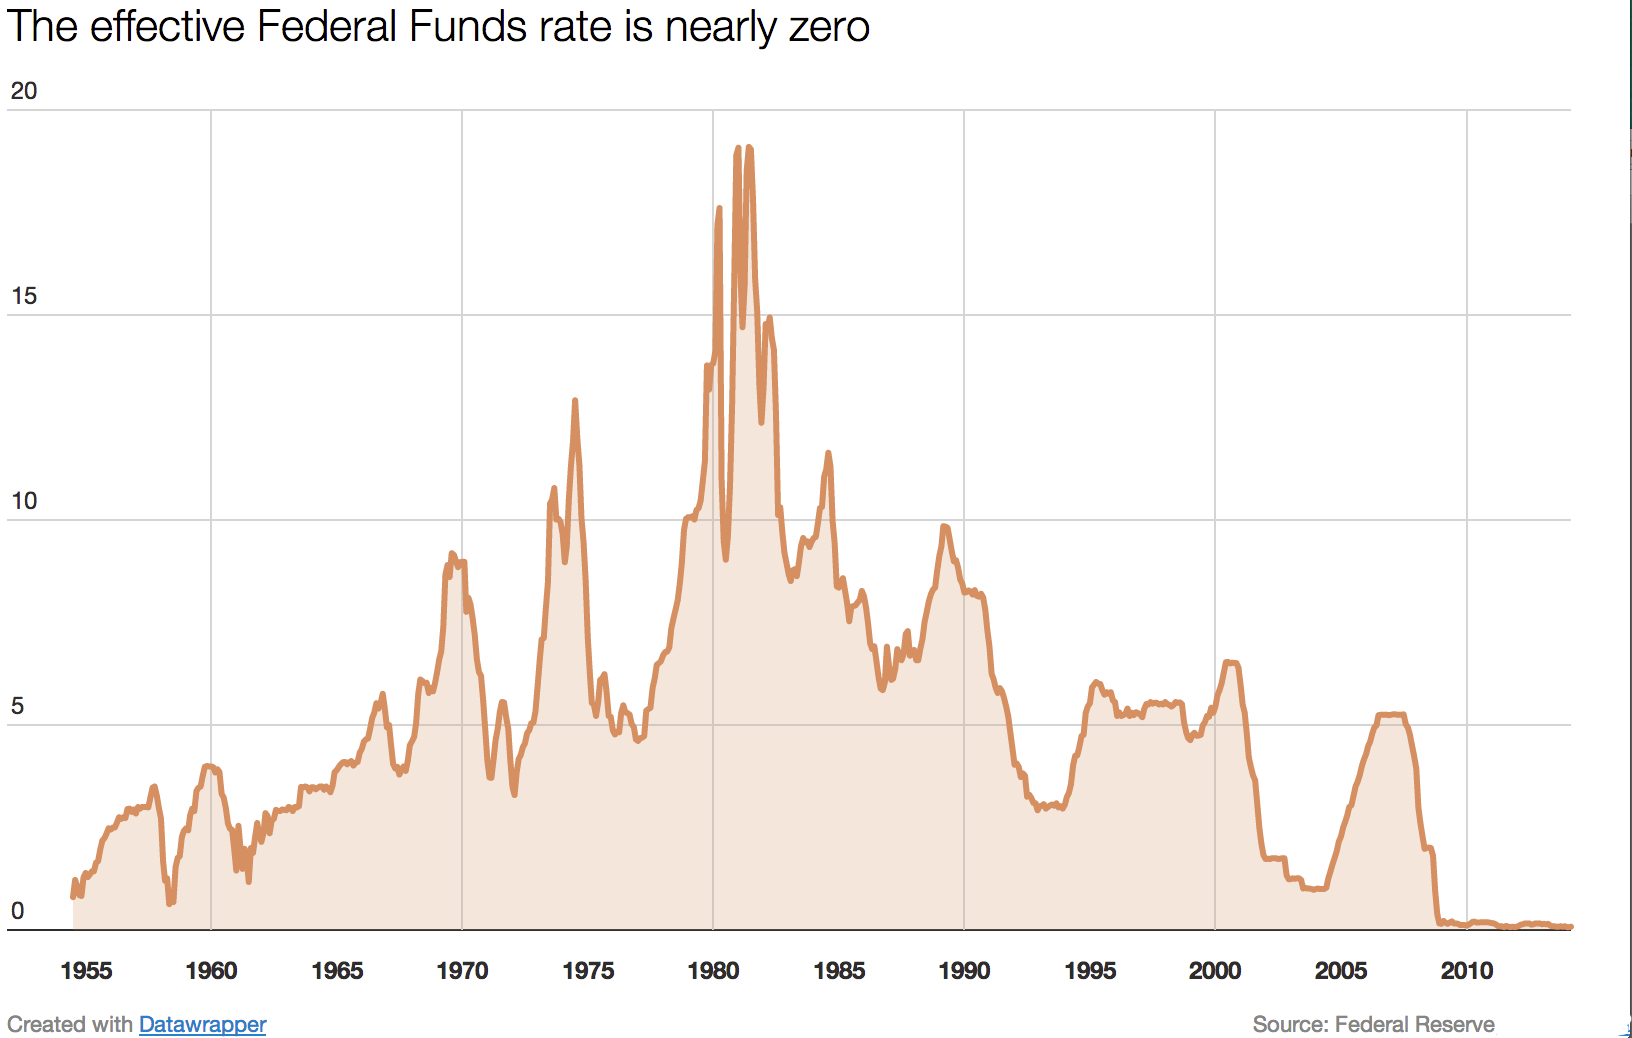
MFO, among a thousand others, has loudly bemoaned the pernicious effects of a zero-interest-rate environment. Briefly, it punishes savers and so discourages savings, it rewards market gambles, and so encourages speculators. Savings rates plummet while earnings-free companies soar.

We are just now realizing the price of getting what we wanted. Devesh Shah lays out the consequences in depth in this month’s essay, “Another such victory and I am undone.”  A snapshot of some of the fallout:

The highest mortgage rates in 20 years, 7.35% on a 30-year, is freezing the housing market, with potential owners reluctant to surrender their existing 3% mortgages and potential buyers reluctant to assume expensive new ones.

About $1.2 trillion in commercial real estate loans mature before the end of 2024, and they will all have to be refinanced at sometimes dramatically higher rates even as lease income dwindles and offices remain empty. It is unclear how many would-be borrowers will be able to get refinancing and even more unclear how many could afford their combination of higher payments and lower income.

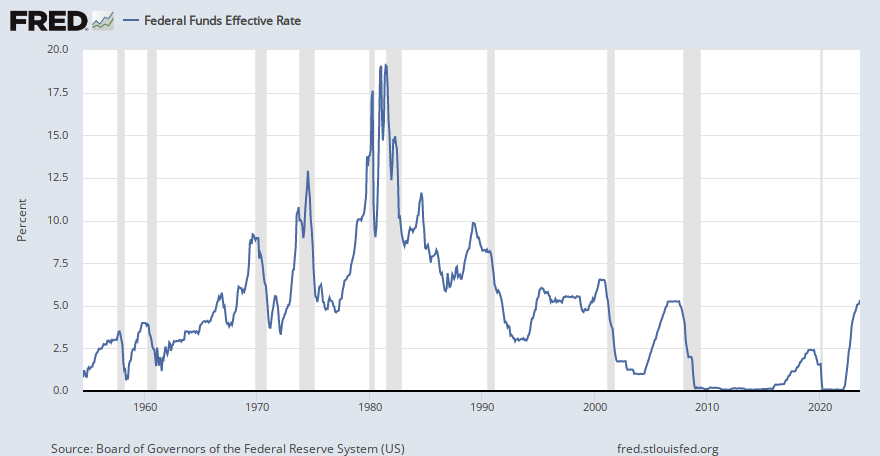
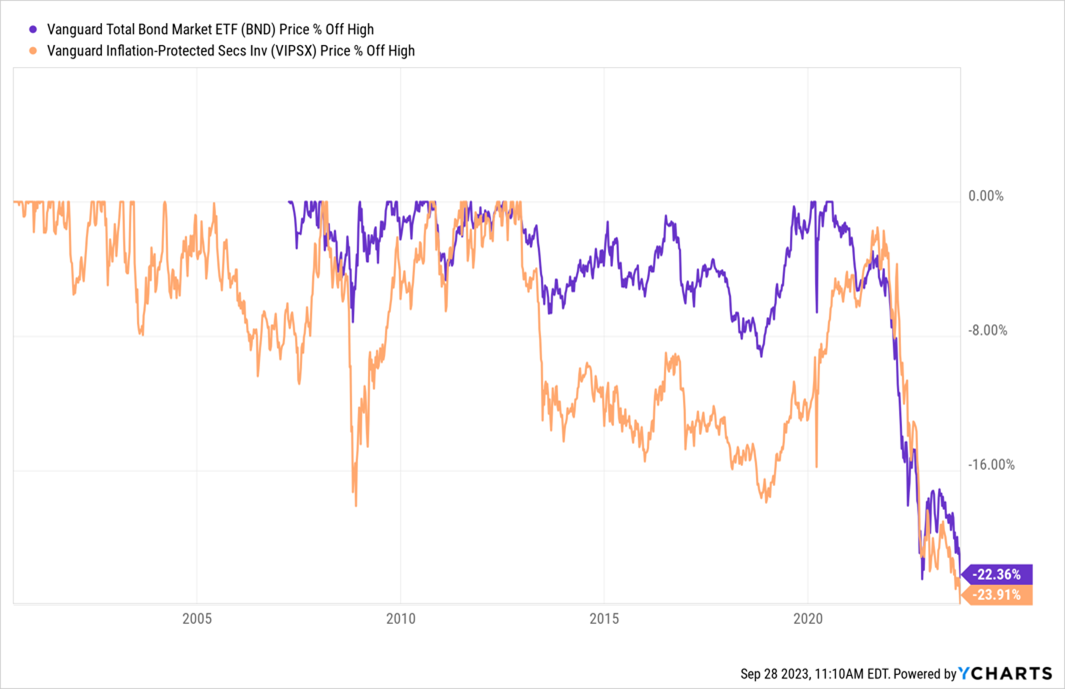
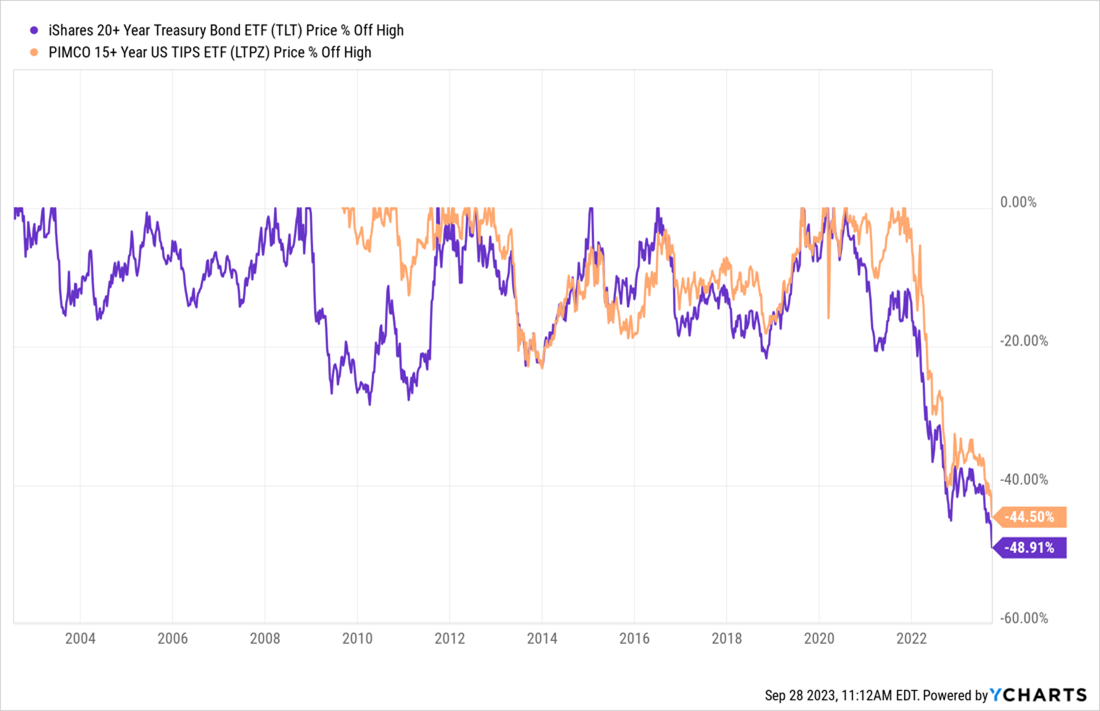
The 10-year Treasury yields 4.69%, its highest level since early 2007. The 2-year Treasury has a yield of 5.1%, its highest level since 2006 (both as of October 1. 2023). And since yield is inverse to price, it’s no surprise that the Total Bond Market ETF (BND) is underwater and the Long-Bond ETF (BLV) is way underwater. Long bonds are not “underwater for 2023.” No, no. “Underwater for the past 1-, 3- and 5-year periods.”  JPMorgan chief strategist Marko Kolanovic frets that “History doesn’t repeat, but it rhymes with 2008.”

Infrastructure projects designed to help us blunt or adapt to a rapidly destabilizing climate have huge upfront capital costs. Those can become prohibitive to finance when interest rates rise and lenders grow anxious.

Consumers have kept the economy afloat in the face of persistent worries, but calculations by the Fed suggest that the savings accumulated during Covid and later deployed in “revenge spending,” will be exhausted by the end of this month. Consumer credit card debt now tops $1 trillion and carries an average interest charge of 21-28%, depending on which estimate you accept.

Along with that, repayments on $1.7 trillion in student loans resume in October after a three-year suspension. That affects about 40 million people who tend to be relatively young and relatively poor; most (70%) plan on slashing discretionary spending and shifting basic purchases to discount stores.

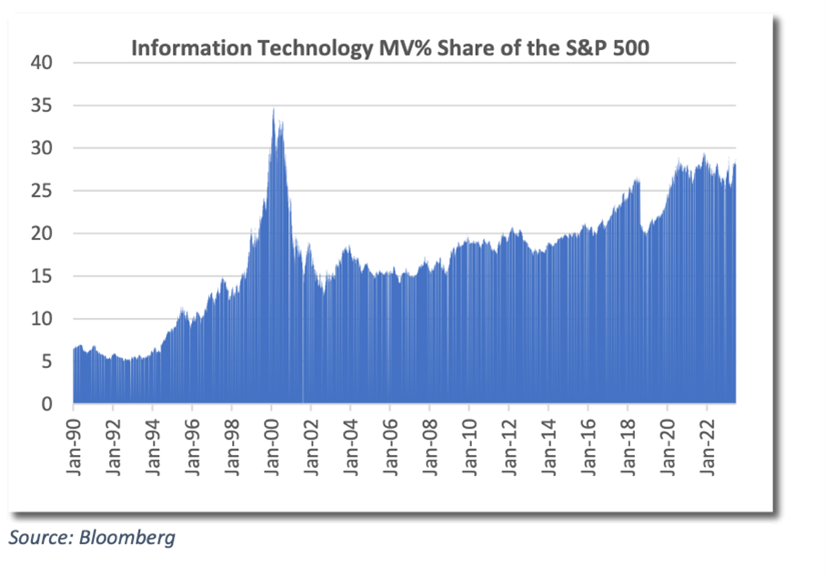
All of which makes people – consumers and managers – very anxious. Part of that anxiety is manifest in the gap between the cap-weighted S&P 500 (up 10% YTD) and both its equal-weighted version (up 1.6%) and the Russell 2000 small cap index (up 2.5%). The apparent health of the stock market seems mostly a reflection of the mania around tech and telecom (again). Jaime Dimon recommends that you “batten down the hatches.” Predictions of recession, imminent or over the next 16 months, are rife.

What’s an investor to do in the face of worry?

If you’ve got a long-term plan and a willingness to ignore noise, “nothing” is generally your best answer.

Doug Ramsey, Chief Investment Officer of The Leuthold Group, and Co-Portfolio Manager of the Leuthold Core Investment Fund and the Leuthold Global Fund, hosted a web call on September 26 with investors. The call was subsequently titled “The Hunt for Red October,” which I liked enough to swipe.

Highlights of Doug’s presentation:

Leuthold does a minute-by-minute tracking of hundreds of statistical indicators, aggregated in their Major Trend Index (MTI). Monetary and liquidity metrics are poor and getting worse. All monetary indicators are now negative. Money supply growth is the lowest since the 1930s. They are getting worse. Longest yield curve inverse in history, one of the deepest, one of the most extreme.

 “The weight of the evidence puts the MTI on the cusp of portending a significant new down-leg in stocks.”

Equity exposure in their tactical portfolios, such as Leuthold Core, has drifted down by 3-4%. Core’s net exposure in late September was under 50%.

We’ve seen the worst performance of small caps – ever – coming off a bear market low. Depending on how you value them, this is among the cheapest that small caps have ever been relative to the rest of the market. There’s the prospect of a “generational buying opportunity coming out of a moderate recession because they’re so cheap and lag so much.

Contrarily, they keep getting EM sell signals.

Leuthold Group will generally share a copy of the replay if you reach out to them.

Morningstar decided to skip the whole “will there be a recession” thing and go straight to “what’s the best place to be when there is a recession?” While she doesn’t exactly compile a “buy” list, analyst Amy Arnott does recount the record derived from the past four or five recessions:

  • stocks are usually one of the worst places to be during a recession
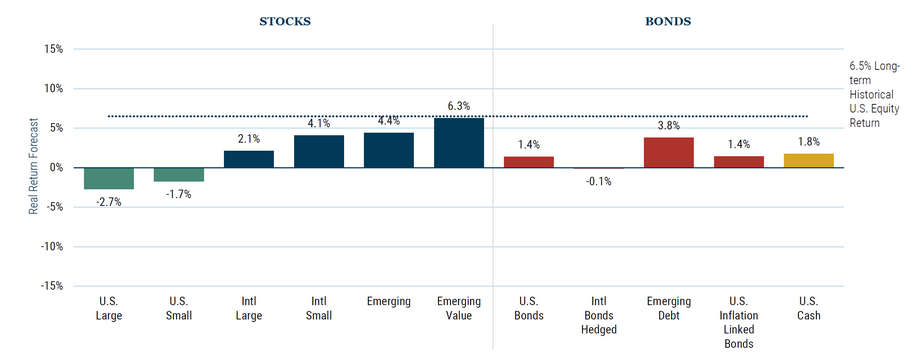
  • Bonds and gold, contrarily, have benefited from a flight to safety
  • Within the stock universe, “large has generally been better than small during periods of economic weakness.
  • In terms of stock characteristics, “the quality factor has historically fared best …The minimum volatility factor … has fared second-best, and dividend stocks have also held up relatively well.”
  • From a sector perspective, healthcare and consumer staples stocks have been the most resilient performers …” Energy and infrastructure investments, contrarily, have been hit hard, consistently.

Her bottom line, like ours, “making wholesale shifts in portfolio holdings is usually a bad idea. But just like being mentally prepared for winter in Chicago … studying how the market has historically performed can help you set expectations for how your holdings might react if and when the economy weakens” (“Best Investments to Own During a Recession,” 9/25/2023).

Modest midterm changes to Snowball’s portfolio: as long-time readers know, my own non-retirement portfolio targets a 50/50 split between growth and income; roughly, between stocks and some combination of bonds, alts, and cash. My stock portfolio targets 50% US/50% international, with some tilt toward smaller, cheaper, and higher quality. I do not trade, with an average holding period of more than a decade.

I sold my entire position in Matthews Asia Growth & Income. The fund is one of the most conservative ways to access Asian equities, but … it was a holdover from Ancient Times when Andrew Foster (now of Seafarer) managed the fund. The fund has earned 0.20% annually for the past five years and 1.20% for the past decade, and my exposure to stocks (60%) and international stocks (40%) were both far above their targets.

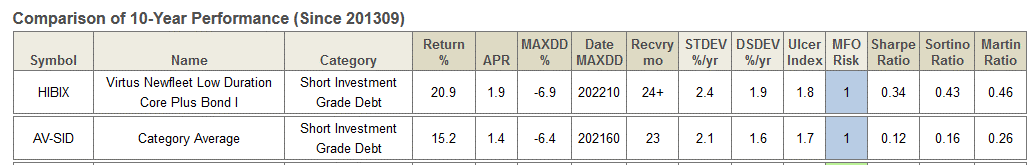
I added RiverPark Strategic Income after a months-long comparison of that and Osterweis Strategic Income. They are up 6.05% and 6.81% YTD, respectively. Both are managed by top-tier guys who loathe losing money. Of the two, RiverPark has had noticeably lower volatility. The RiverPark addition allowed me to deploy cash sitting in my Schwab account without materially increasing my risk exposure.

I am likely to add Leuthold Core Fund and add to Palm Valley Capital, an exceptional small- to micro-cap value fund that’s sitting on 80% cash and short-term bonds just now. Both managers share my dislike for losing my money. Both have outstanding long-term records, though Palm Valley’s is obscured by the fact that the managers have been responsible for four different funds – serially, each with the same strategy – this century.

And eventually, I’ll figure out how to transfer part of my investment in Seafarer Overseas Growth & Income, which I add to regularly, to Seafarer Overseas Value. Paul Espinosa’s fund is probably the most compelling “star in the shadows” of its generation.

“Green hushing” and your future

The Financial Times, doubtless inspired by our excellent word on green hushing, reports that even European managers have resorted to the practice:

Asset managers have been dropping the word “sustainable” from the names of funds in response to increasing regulatory and reputational concerns. Forty-four sustainable funds removed the label from their brand name during the first half of 2023, in contrast to 2022, when 99 funds added “sustainable” to their name, according to data from consultancy Broadridge. (“Asset managers turn to ‘green hushing’ on sustainable funds,” FT.com, 9/25/2023)

They note, at the same moment, the upsurge of anti-ESG investments. Columnist Robert Armstrong writes,

It is the strongly held view of this newsletter that ESG investing is well-intentioned, confused, utterly ineffective and probably harmful. It does not change corporate behaviour for the better, cannot offer investors consistently better returns, is not a good risk-management strategy, extracts fees from investors and hands them to financiers, lawyers and consultants, is anti-democratic and creates a pernicious distraction from the things that do change corporate behaviour, such as consumer boycotts and regulatory action.

But if ESG investing is dumb, does that make anti-ESG investing smart? A few people seem to think so … Morningstar identified 27 investment funds as anti-ESG, together managing $2.1bn as of the first quarter of this year. This is just a speck relative to the money management industry, but it is not quite nothing.

Ultimately, Armstrong can’t find any reason that such funds are a good idea any more than ESG funds are, except for the distant prospect that the visionaries behind them will avoid some of the design mistakes made by their counterparts. That said:

The proof of the pudding may have to be in the eating. Given that most anti-ESG funds are quite small, have not been around for long and pursue quite varied strategies, there is very little pudding to eat and it is still undercooked. (“Anti-ESG Investing,” FT.com, 9/26/2023)

Assume for a moment that the critics of ESG investing are right. The unresolved question remains:

The planet’s systems are dangerously out of balance. What are you going to do about it?

If the answer is “nothing,” then we’re toast. Almost literally.

There is much you can do. (Don’t vote for idiots comes to mind, though I know the term is amorphous.) To the extent possible, stop the personal consumption of fossil fuels. Open flames in your home – in water heaters, furnaces, and stoves – might be replaced by heat pumps, induction cooktops, or clotheslines. You might reconsider the need for an SUV or pickup, which tend to be surprisingly unsafe because of their poor visibility and slow handling, expensive, and unnecessary. (In general, SUVs are marketed through appeals to personal freedom as drivers ford rivers, scale mountains, and drag commercial aircraft down the stream while a deep-voiced narrator drones on about your ability to go anywhere and do anything.) You might ask local officials about changes to the city building code, which would encourage heat-reducing “green” rooftops and urban trees. You might plant a tree. You might support those who are taking action; Charity Navigator rates a bunch of conservation organizations as having scores of 97 or above. Run for local elected office (on the likely doomed slogan, “I’ll listen openly and try to make things better for us all”) … or help out with some good soul who is. Stay informed. Stay positive. Keep moving forward.

Thanks, as ever,

Thanks, as ever, to our stalwart regulars: Brian, Doug, David, Gregory, Stephen, William, the other William, Wilson, and S&F Investment Advisors. And, this month, thanks as well to David from Elko, Philip from Michigan, and Sherwin. Your contributions mean a lot.

As ever,

david's signature

T. Rowe Price Capital Appreciation PRWCX vs TCAF

By Charles Lynn Bolin

I was asked recently what I thought of T. Rowe Price Capital Appreciation (PRWCX) compared to T. Rowe Price Capital Appreciation Equity ETF (TCAF), which has gained $235 million in assets under management since its June 2023 launch. TCAF is one of two new T Rowe Price offerings that play off the unparalleled success of the PRWCX, which is closed to new investors. The other new entrant, the T. Rowe Price Capital Appreciation and Income Fund, has not yet debuted.

The most striking similarities are the name and the fact that they are both managed by David R. Giroux, who has an outstanding record. From here, the similarity fades. PRWCX is a moderate to growth-oriented mixed-asset fund, while TCAF is a predominantly domestic equity fund. There are differences in how the equity sleeve of PRWCX compares to TCAF, which are explored in this article.

Let’s start with a review of PRWCX before diving into the infant TCAF.

BEST MIXED-ASSET TARGET ALLOCATION GROWTH FUNDS

T Rowe Price Capital Appreciation (PRWCX) is classified by Lipper in the Mixed-Asset “Growth” Category and Morningstar as a “Moderate” category. Its current allocation is about 62% equities, but the fund has a lot of flexibility to adjust to market conditions.

The list of best-performing mixed-asset target allocation growth funds over the past ten years is small. To select the five funds in Table #1, I used the Top Quintile of the MFO Rating for 3, 5, and 10 years for funds available at Fidelity. Dodge & Cox Balanced (DODBX) has a transaction fee, and PRWCX has been closed to new investors since 2014.

T Rowe Price Capital Appreciation (PRWCX) is the standout performer. It is the category’s only Great Owl, which means it is the only growth allocation fund to generate consistently top-tier risk-adjusted returns over all trailing periods. To be clear, it is The One out of 250 such funds. It has been in existence for 37 years and has been managed by David R. Giroux for the past eighteen years. As a result of its performance, it has grown to $53 billion in assets under management. For the past ten years, Allspring Diversified Capital Builder (EKBAX) has had similar high overall performance but with more risk. I like that PRWCX has a stock allocation of 62%, which is moderate compared to EKBAX, with 84%.

Table #1: Best Performing Mixed-Asset Growth Funds – Ten Years

Source: Created by the Author Using the MFO Premium Multi-search Tool

Figure #1: Best Performing Mixed-Asset Growth Funds

Source: Created by the Author Using the MFO Premium Multi-search Tool

My colleague David Snowball offered a complementary analysis of the fund in his August 2023 article on the impending launch of T. Rowe Price Capital Appreciation and Income. His take: “You care [about the new fund] because T. Rowe Price Capital Appreciation is (a) utterly unmatched and (b) closed tight.”

T. ROWE PRICE CAPITAL APPRECIATION (PRWCX)

The strategy of the T. Rowe Price Capital Appreciation Fund (PRWCX) is

The fund normally invests at least 50% of its total assets in stocks and the remaining assets are generally invested in corporate and government debt (including mortgage- and asset-backed securities), convertible securities, and bank loans (which represent an interest in amounts owed by a borrower to a syndicate of lenders) in keeping with the fund’s objective. The fund may also invest up to 25% of its total assets in foreign securities.

The fund’s investments in stocks generally fall into one of two categories: the larger category comprises long-term core holdings whose prices when purchased are considered low in terms of company assets, earnings, or other factors; the smaller category comprises opportunistic investments whose prices we expect to rise in the short term but not necessarily over the long term. There are no limits on the market capitalization of the issuers of the stocks in which the fund invests. Since we attempt to prevent losses as well as achieve gains, we typically use a value approach in selecting investments. Our in-house research team seeks to identify companies that seem undervalued by various measures, such as price/book value, and may be temporarily out of favor but have good prospects for capital appreciation. We may establish relatively large positions in companies we find particularly attractive.

We work as hard to reduce risk as to maximize gains and may seek to realize gains rather than lose them in market declines. In addition, we search for attractive risk/reward values among all types of securities. The portion of the fund’s investment in a particular type of security, such as common stocks, results largely from case-by-case investment decisions, and the size of the fund’s cash reserves may reflect the portfolio manager’s ability to find companies that meet valuation criteria rather than his market outlook.

The fund may purchase bonds, convertible securities, and bank loans for their income or other features or to gain additional exposure to a company. Maturity and quality are not necessarily major considerations and there are no limits on the maturities or credit ratings of the debt instruments in which the fund invests. The fund may invest up to 30% of its total assets in below investment-grade corporate bonds (also known as “junk bonds”) and other debt instruments that are rated below investment grade…

PRWCX equity is currently 95% domestic. It is overweight Technology and Healthcare. Thirty percent of its fixed income is in Bank Loans.

Morningstar gives PRWCX a Five Star Rating with a Gold Analyst Rating. The Portfolio Manager is David R. Giroux (CFA), and Ira Carnahan (CFA) is a Portfolio Specialist working on the Capital Appreciation Fund.

According to Morningstar:

David Giroux rose to the management ranks on this strategy in mid-2006 after joining T. Rowe Price in 1998 as an analyst covering the industrials sector. Initially a comanager, he quickly took a lead role on the portfolio by early 2007 and became the sole manager in June of that year…

Giroux delivers a high-conviction basket of roughly 40-50 stocks that range between 56% and 72% of the fund’s assets. He’ll shift the exposures meaningfully when he identifies mispricing, like scaling equity exposure when drawdowns bring valuations to a more attractive level.

From T. Rowe Price:

David Giroux is a portfolio manager for the Capital Appreciation Strategy, including the Capital Appreciation Fund and Capital Appreciation Equity ETF, at T. Rowe Price Investment Management. He also is head of Investment Strategy and chief investment officer for T. Rowe Price Investment Management. David is the president, chairman, and a member of the Capital Appreciation Investment Advisory Committee and a member of the Capital Appreciation Equity ETF Investment Advisory Committee. He is a member of the T. Rowe Price Investment Management ESG Committee and the T. Rowe Price Investment Management Investment Steering Committee.

The Fact Sheet for PRWCX is available here, and the Prospectus is here.

T. ROWE PRICE CAPITAL APPRECIATION EQUITY ETF (TCAF)

T. Rowe Price Capital Appreciation Equity ETF (TCAF) has an inception date of June 2023; Morningstar does not give it a Star Rating but gives it an Analyst Rating of Gold. It has attracted $235 million in assets to date. Like PRWCX, TCAF is overweight in Technology and Healthcare.

The Fact Sheet for TCAF is available here, and the Prospectus is here. The Principal Investment Strategies of TFAC differ somewhat from PRWXC:

The fund normally invests at least 80% of its net assets (including any borrowings for investment purposes) in equity securities. The fund takes a core approach to stock selection, which means both growth and value styles of investing are utilized. The fund may purchase the stocks of companies of any size, but typically focuses on large U.S. companies. The portfolio is typically constructed in a “bottom up” manner, an approach that focuses more on evaluations of individual stocks than on analysis of overall economic trends and market cycles.

In selecting stocks, the adviser typically seeks out companies with one or more of the following characteristics:

  • experienced and capable management;
  • strong risk-adjusted return potential;
  • leading or improving market position or proprietary advantages; and/or
  • attractive valuation relative to a company’s peers or its own historical norm.

The fund seeks to maintain approximately 100 securities in the portfolio.

Sector allocations are largely the result of the fund’s focus on stock selection. The fund may at times, invest significantly in certain sectors, including the information technology and healthcare sectors.

The fund is “nondiversified,” meaning it may invest a greater portion of its assets in a single issuer and own more of the issuer’s voting securities than is permissible for a “diversified” fund.

This Morningstar video, 3 New ETFs That Stand Out From the Pack, describes how TFAC differs from the equity portion of PRWCX, including longer holding periods and lower dividend yields to enhance tax efficiency. In addition, TFAC will hold own approximately one hundred stocks that the Team believes will deliver higher risk-adjusted returns.

Figure #2: Comparison Selected Actively Managed Large Cap Core ETFs – Two Months

Source: Created by the Author Using the MFO Premium Multi-search Tool

The histogram in Figure #3 shows the performance of all actively managed equity ETFs with at least $100 million in assets under management. TCAF resides in the largest bin with two month returns of 1.65% to 2.0%.

Figure #3: Histogram of Actively Managed Large Cap Core ETFs

Source: Created by the Author Using the MFO Premium Multi-search Tool

Closing Thoughts

With the combination of economic slowdown, high fixed income yields, strikes by the United Auto Workers, government shutdown, and seasonal fluctuations, I continue to be conservative. I have dry powder for opportunities that may arise. I like actively managed ETFs. Below are the five that I track plus S&P 500 (SPY) and PRWCX over the past two months, which are too short to get meaningful performance comparisons but may reflect relative volatility.

Figure #4: Author’s Short List of Actively Managed Equity ETFs (Plus SPY & PRWCX)

Source: Created by the Author Using the MFO Premium Multi-search Tool

I wrote One of a Kind: American Century Avantis All Equity Markets ETF (AVGE) and Fidelity Actively Managed New Millennium ETF (FMIL) describing why I like these funds. I own a small starter position in AVGE. As a result of writing this article, I am also interested in buying TCAF during dips.

Beyond The Rainbow – A Map to the Good Life in Retirement

By Charles Lynn Bolin

This is the last article in a series that describes what I learned in the year following retirement. After fifty years of working, military service, and getting two university degrees, I took the first year as “Me Time”. I once worked with an Australian who was fond of saying that he had his $100 in the bank, meaning that he was financially secure. I have reached the end of the rainbow after decades of investing and financial planning. I just signed up for Social Security, which, combined with pensions, will cover normal spending needs, plus I have my $100 in the bank.

Rainbow over the ocean waves photo

This past year, I put my investing on autopilot with Fidelity Wealth Management and Vanguard Personal Advisory Services managing my long-term investment buckets. I am surprised at how much relief I feel putting these plans into action and how much time it has freed up. I am ready to look beyond the rainbow and create a map of the good life in retirement.

This article is divided into the following sections:

REACHING THE RAINBOW

I had a rocky start to my career but was able to finish strong with peak earnings in my later years. I began evaluating scenarios mid-career of retiring at 57, 59 ½, 62, and 65, not because I wanted to retire early, but in case I had to. The benefits of working a few years longer were shocking. Brian J. O’Connor does an excellent job in Bad News: Early Retirement Can Create a Financial Crisis, which summarizes the risks of retiring early based partly on a study by Allspring Global Investments. He describes that someone retiring at 62 is three times more likely to run out of money than someone waiting until age 65 to retire.

The five decades regarding personal finance since I graduated from high school have been characterized by the following:

  • First Decade: Military service, attending university, stagflation, working temporary jobs.
  • Second Decade: Globalization, layoffs, mergers & acquisitions, starting a professional career, marriage, MBA (between layoffs).
  • Third Decade: Professional development, Dotcom Bubble, buying a home, setting goals using Vanguard’s retirement tool.
  • Fourth Decade: Working internationally, entering management positions, financial crisis, building a home, using the Fidelity retirement tool, beginning DIY financial planning, hiring fee-only financial planner, using Schwab robo-advisor, developing an investment model.
  • Fifth Decade: Peak earning years, COVID, merger, retirement planning, retirement, cancer, relocation, hired a financial planner, writing articles for Seeking Alpha and Mutual Fund Observer.

Needless to say, things often don’t go according to plan. You may not be able to work as long as you would like to complete your financial plans. There are financial speed bumps along the way. Ultimately, I worked until age 67, which is beyond the normal retirement age for both my employer pension plan and social security. Working longer means that you are still adding to savings instead of drawing from them. The impact on Social Security benefits is described later.

Setting Goals

Setting a goal to have a certain amount saved by retirement always seemed a little esoteric to me because there are so many variables. However, I have always kept an eye on the size of the prize. Fidelity’s guideline is that people should try to save at least their salary by age 30, three times their salary by age 40, six times by 50, and eight times by age 60. The median salary in the 55 to 64 age group is about $76 thousand. That would imply that the savings of a typical person nearing retirement should be between $450 thousand and $600 thousand.

The Wealth Calculators provided by DQYDJ estimate that to be in the top 50% for households in the 65 to 69 age group, one would need a net worth of $272 thousand, including home equity. The Fidelity Guideline is an attainable stretch goal. Having $1 million in net worth is in the top 20%, and to be in the top 10% requires at least $1.9 million. This does not include pensions, annuities, and social security. A Pension Present Value Calculator from Financial Algebra shows the present value of a $4,000 monthly pension at 6% interest for 25 years has a present value of $624 thousand. It does not take into account adjusting pensions for cost-of-living adjustments like Social Security and some pensions do. Another important factor is whether the savings are in Traditional IRAs, where taxes are owed on distributions.

Figure #1 shows estimated net worth, including home equity by age group from DQYDJ.

Figure #1: Net Worth Percentiles by Age in the United States (2020)

Source: DQYDJ based on the Federal Reserve Survey of Consumer Finances (2019)

My main goal has been to save the maximum allowable contribution to employer-sponsored savings plans, along with some discretionary savings targets. Savings and income goals have impacted my behaviors. I would rather drink a $0.35 cup of my favorite cup of coffee at home rather than a $5 latte, even though I savor the lattes. Pamela Vachon conservatively estimates in Here’s How Much You’ll Save Making Coffee at Home that a typical coffee drinker can save $736 by drinking their coffee at home. This same logic applies to many purchases. We cut our discretionary expenses when I retired, and recently reassessed our spending to cut out another $500 per month, mostly in financial subscriptions. Our living expenses have not gone down, but our priorities have changed.

Lifetime Budgets

How much is required for retirement should be derived from a lifetime budget taking into account sources of income, expenses, and including the expected return from investments, and estimated inflation. Fidelity has a retirement planning tool that is available to account owners. Vanguard has one that is available if you use their Personal Advisory Services. Of course, there is the DIY spreadsheet approach that I also use. The cost of living can vary dramatically by state, as shown by Robin Rothstein in Examining The Cost Of Living By State In 2023. John Csiszar estimates that typical 401k savings will last less than seven years in some states: The Average 401(k) Is Worth $300K at Retirement Age — How Long It Would Last in These 10 States.

Financial Planners

I am a strong advocate of using a financial planner, although I reached this conclusion late in my career. Social Security, Medicare, and tax rules can be complicated. Financial literacy is important to help us understand the tradeoffs between risk and return. Financial planners can help with these topics. What I have found is that it may take a financial planner and tax accountant to advise on these topics. Rodney Brooks describes why you might need a tax accountant and a financial planner in Should You Consult a CFP or CPA to Plan for Retirement? Sam Lipscomb describes why you might want an advisor who specializes in Social Security in Financial Advisors for Social Security. I took the Do-It-Yourself route, which has been time-consuming. Robert Powell describes certain advisors who specialize in Medicare in How Financial Advisers Can Help Clients With Medicare. I use Alight, which is a retiree benefit from my former employer, to identify the best Medicare plans.

Edelman Financial Engines has financial services with fees based on a percentage of assets. There are also a variety of resources available to find independent financial planners, such as FPA PlannerSearch and The National Association of Personal Financial Advisors. I wrote Battle of the Titans for Portfolio Management, comparing Fidelity to Vanguard. I am using both and will evaluate in several years if I have a strong preference for one over the other.

Understanding Social Security

I have tracked my estimated Social Security (SS) pension as part of financial planning. The base case in Figure #2 is the SS pension that I would have drawn at full retirement (66 years and two months), shown as 100%. Your SS pension is based on “the average of the highest 35 years of indexed earnings divided by 12 (to change the benefit from an annual to a monthly measure)”. As we enter into our peak earning years, our social security benefits are likely to increase. This was particularly important in my case.

Figure #2: Changes in Author’s Estimated Social Security Benefits

Source: Author Using Social Security Estimates

Working until age 67 displaced a year with low income with a peak earning year. Someone retiring early at age 62 will have approximately 32% lower benefits than retiring at full retirement age, excluding the impact of earnings and inflation.

I evaluated different dates for starting SS Benefits and applied for the benefit to start early next year instead of waiting until age 70. One should take into account Spousal and Survivor Benefits when making these decisions. Reaching the end of the rainbow includes leaving my wife in the best possible financial condition in case I pass away before her.

CLOUDY DAYS

Our parents and grandparents were farmers and ranchers. They experienced crop failures, droughts, dust bowls, depressions, inflation, and world wars. I had a rocky start in my career due to not developing a clear career path early and to downturns in the business cycle. These experiences developed a strong desire to always have a margin of safety.

People are often surprised that pensions cover less than they anticipated or that savings don’t last as long as they expected. Some have had to choose to continue working or go back to work. Then, there are unknowns, such as health issues that arise. The boogeymen that concern me are high Federal debt and budget deficits, geopolitical risks, climate change, underfunded pensions and Social Security, stagflation/inflation, sequence of return risk, political polarization, and high crime rates.

As I was about to submit this article, I ran across one more pertinent source by Chris Kissel at Money Talks News, 12 Hard Truths About Retirement. These points are well worth understanding before retiring.

  1. Medicare won’t be free
  2. Social Security won’t go very far
  3. You will wish you had saved more
  4. Housing will remain your biggest expense
  5. Your dreams may not match reality
  6. You may spend more than you expect
  7. Divorce will be a serious threat
  8. You might not work — even if you planned to
  9. If you’ve never volunteered before, you won’t start in retirement
  10. Retirement can be especially lonely for single men
  11. Health issues will likely catch up with you
  12. You may be disappointed — at first

We have tried to address these risks by using the bucket approach, diversifying investments, building up pensions, working a little longer, delaying Social Security benefits, and living beneath our means. We elected pension options with 100% survivor benefits. Delaying social security until full retirement age increased Spousal and Survivor Benefits. Increasing financial literacy and using financial planners reduces risk. Eating healthy and staying active improves well-being.

In the short term, government shutdowns and strikes will dampen an already slowing economy. September and October are following seasonal trends for stocks to dip. I have set a date in October to do a Roth Conversion while stocks are hopefully lower. I am overweight cash equivalents and short-term bond funds and ladders and underweight equities.

ASSESSING MY FIRST YEAR IN RETIREMENT

Before I retired, I created an ambitious Bucket List of things to do in the year following retirement. I fell far short of completing the list. I accomplished everything on the list, just not to the extent that I wanted. We did complete our financial planning and estate goals, a major xeriscape project around the house, installing a solar system, and arranged for a kitchen remodeling project to begin soon. I have been dedicated to the gym as planned. I also completed things not on the list, such as building raised bed gardens and volunteering to remove snow for senior citizens. My biggest regret was wasting too much time following political drama, and not enough time reading quality books.

My day starts with reading the news broken down, focusing on ten categories that concern voters the most according to a recent poll. I take a deeper dive into these subjects. It surprised me that approximately twenty-five percent of homeless people are actually employed, but can’t afford housing. I read about what states and cities are doing to reduce homelessness. My wife and I attended a fundraiser for a local organization that helps provide “sustainable housing, supportive services, and education to families and individuals”. I visited their office to ask about opportunities to volunteer. I applied to be a volunteer and expect to start in November.

My goals have changed somewhat. Turning over long-term investment buckets to financial advisors shifted my interests to other goals. I have reassessed what remains on my list and reprioritized it. The list is still valid, and I will continue to work on it.

THE GOOD LIFE IN RETIREMENT

I have lived overseas for thirteen years, and traveling abroad is not a priority. What appeals to me is to visit places nearby. This month, I went to a national park to see the aspen leaves changing color. I am currently reading a history book of Colorado, which enriches travel to nearby places.

My map of the good life in retirement is not so different from what I envisioned a year ago. I had thought it out well. I have reprioritized my goals loosely as follows based on the time that I expect to spend, some of which overlap. I am updating the details for each of the categories.

  1. Family
  2. Health/Gym
  3. Volunteering
  4. Reading quality books
  5. Following current events and news
  6. Home improvements, maintenance
  7. Exploring Colorado and nearby states,
  8. Nature trails and scenic drives
  9. Parks, museums, and culture
  10. Social
  11. Retirement planning/investing/financial literacy
  12. Visiting interesting restaurants/breweries/wineries

This bucket list forms my map of the good life in retirement.

The 25 Year Tempest: Emerging market investing through three cataclysms

By David Snowball

Who now remembers Long-Term Capital Management, the failure of genius, the price of hubris, and the lesson that the innocents bear the cost of their elders’ folly?

Too few, judging from investor behavior.

The collapse of LTCM was the first of three global financial crises over the past 25 years that erupted primarily in the developed world, but whose consequences were primarily borne by emerging markets economies and investors.

Source: James Watson, English printmaker, 1767, original in the Rijksmuseum

The world’s smaller and less liquid stock markets eternally seem forever to present tomorrow’s best investment opportunities. As Little Orphan Annie sings, “I love you, tomorrow, You’re always a day away.” As they have matured, financial transparency has improved, shareholder rights are increasingly respected, and corporate decisions are drifting in the direction of rational capital allocation rather than relational (“who you know”) allocation.

It’s much the same passion (or delusion) that drives investors in microcap stocks everywhere.

We will share a quick recap of the Three Great Storms, then highlight the fate of the EM funds that survived all three. There’s actually some good news about picking a fund that might survive the storms ahead.

The Three Great Storms

For most of the 20th century, the world’s smallest and least liquid stock markets were plagued by repeated crises. Some of those crises were of their own doing, as unreliable government structures and self-serving corporate ones conspired to undermine trust. Many, however, were not their doing. Markets with very low liquidity -relatively few buyers or sellers, relatively low trading volume, relatively low market capitalization – are hostage to the behaviors of a few, large investors. If one large investor in one small market attempts to withdraw suddenly, a market panic follows. If several large investors depart, an entire region is at risk.

So “market runs” were routine. Three events, however, stand in stark contrast to “normal” panics.

1998: Long Term Capital Management collapse 25 years ago

Long-Term Capital Management was a massive hedge fund with a stellar record and “A” tier investors, including Nobel Prize-winning economists Myron Scholes and Robert Merton, major banks, and sovereign wealth funds.

LTCM had placed leveraged bets on the Russian currency, but also thought they had adequately hedged those bets. They were wrong. In the spring and summer of 1998, the government of Boris Yeltsin was in turmoil. President Yeltsin fired his entire cabinet in March and appointed “take charge” guys to key posts. Short-term government interest rates popped to 150%. On August 17, Russia declared it was devaluing its currency. For good measure, it also defaulted on its bonds.

The Dow dropped 13% in two weeks as investors fled stocks, interest rates fell in response, and LTCM’s highly leveraged investments crumbled. The fund lost 50% in two weeks, threatening to bankrupt the banks, wealth, and pension funds that had invested so heavily in it. Bear Stearns demanded $500 million from the fund.

Bad things followed:

  1. Emerging markets got crushed. “[T]he MSCI Emerging Markets index shed 56%, as investors pulled billions of dollars out of developing economies. As of early December, investors removed all but $500 million of the $40.8 billion they committed in 2007 to the emerging markets funds tracked weekly by EPFR Global.” (Polya Lesova, “Emerging markets: the best and the worst of 2008,” MarketWatch, 12/18/2008)
  2. The government stepped in to save LTCM’s investors. Buffett offered LTCM pennies on the dollar for their assets. The Fed stepped in to broker a better deal in part to save the institutions put at risk by their own stupidity. The institutions involved remembered.

2008: The Global Financial Crisis 15 years ago

The 2008 crisis was years in the making. The shortest version is that the Fed responded to the collapse of the stock market bubble in 2000 and the attacks of 9/11/2001 by pushing interest rates down from 6.5% (in 2000) to 1% (in 2003). “Free money” routinely leads to bad decisions. People snapped up homes, prices soared, and financial institutions decided that mortgages – even mortgages held by people with no credit history and no reliable income – were great investments. They just needed to “securitize” baskets of iffy loans in a way that … somehow, canceled out all of their risks.

Until they didn’t. In 2007, companies making subprime loans started filing for bankruptcy. By mid-year, hedge funds that had invested in the loans collapsed. That summer, the global lending system froze up, and, in September, Lehman Brothers became the largest bankruptcy in American history. Investors suddenly discovered they were holding trillions in near-worthless subprime mortgages.

The worst crisis in 80 years quickly erupted. Bad things followed:

  1. Emerging markets got crushed. During the crisis (Nov 2007 – Feb 2009), the average EM fund lost 52% per year with a max drawdown of 62%. Emerging Europe and Russia were booking losses of 65% per year. In the following 15 years, the group returned 2.3% with a standard deviation of 22.3%.
  2. The government stepped in to save the global financial system. And also the morons behind the mess. The Feds cut interest rates to zero, opened emergency lending facilities, and bought securities on the open market to provide liquidity and foster calm. By the Feds’ own calculation, “Federal Reserve purchased $300 billion of Treasury securities, about $175 billion of agency debt obligations, and $1.25 trillion of agency mortgage-backed securities.” The institutions involved remembered.

2020: The Global Pandemic, three years ago

You know this story.

And its takeaway:

  1. Emerging markets got crushed. Since the start of COVID, the average EM has lost 1.3% annually. The median fund is down by -0.7% and has gifted investors with a 39% drawdown. Which is “less crushed” than usual, but annualized losses even after a ferocious rebound – frontier EM funds are up 13.6% YTD, EM funds up 6.2% YTD through September 2023 – is not good news.
  2. The government stepped in to save the financial system. Putting aside all of the heroic work to actually control the pandemic, the Feds yet again slashed rates to zero, and the other branches added trillions in stimulus (some of which was even a good idea). Both actions are complicit in the subsequent spike in inflation and the subsequent-subsequent interest rate spike.

Charting the survivors: EM Fund performance through three crises

In assessing the ability of funds to weather repeated storms, we started by isolating all EM funds with a record of 25 years or more. We then looked at three metrics:

  1. Absolute returns since the inception of each storm. That translates to their 25-year (LTCM and beyond), 15-year (GFC and beyond), and 3-year (Covid and beyond, we hope) records
  2. Relative total returns. Funds with returns in the top 20% of their peer groups are shown with a blue box, green is the next 20%, and yellow is the middle 20%. Orange and red are, well, bad.
  3. Relative risk-adjusted returns. The same system applies: blue/green/yellow for the top three boxes.

The complete dataset is below. We’ll offer two takeaways:

    1. Strong past performance predicts reasonable future performance. None of the 1998 standouts sagged in 2008. Few of the 1998 standouts sagged in the Covid era. Two of the top 20 funds in 1998 are noticeably sub-par now, while two more are below average.

      The caveat: we can’t control for survivorship bias. If a 1998 champion subsequently burst into flames, we wouldn’t have a record of it.

    2. Wretched past performance predicts ongoing misery. Bad seems to beget bad. Of the bottom 20 funds in 1998, only one has made a leap to the top tier. Almost all of the others remain mired in the land of orange (below average) and red (much below average) total and risk-adjusted returns.

      The one outlier is Shelton Emerging Markets (fka Icon Emerging Markets). Shelton acquired the flailing Icon fund in June 2020. Two generations of Shelton managers have transformed it into a four-star (Investor shares) or five-star (Institutional shares) fund. Over the past three years, it has returned 7.8% annually while its average peer has lost money.

About 60 emerging markets funds have survived the past quarter of a century. A handful of funds have performed solidly through one crisis after the next. They are:

  • Morgan Stanley India
  • DFA EM Small Cap
  • Fidelity Emerging Asia
  • Driehaus EM Growth
  • Impulsora Del Fondo Mexico
  • DFA EM Value
  • Acadian EM
  • Eaton Vance Parametric Tax-Managed EM
  • Aberdeen India
  • DFA EM
  • Fidelity EM
  • JPMorgan EM Equity
  • Virtus Vontobel EM Opportunities
  • Pichardo Mexico Equity & Income
  • Lazard EM Equity

Of the 15 funds that have remained consistently above average, ten are geographically diversified, and five are narrowly focused, which introduces a whole separate set of risks.

The complete roster of EM equity funds with a record of 25+ years

Funds are ranked by relative Sharpe ratio over 25-, 15-, and 3-year periods

Funds worth watching for

By David Snowball

The Securities and Exchange Commission, by law, gets between 60 and 75 days to review proposed new funds before they can be offered for sale to the public. Each month, we survey actively managed funds and ETFs in the pipeline. Summer’s trickle of new funds becomes autumn’s torrent as advisers rush to have new products on the market by December 31. That’s because a fund launched after that date won’t get to report annual or year-to-date results for 2024, which is a serious marketing problem.

Many new funds, like many existing funds, are bad ideas. (Really, you want the latest “anti-woke” ETF or a new way to invest with Bill Miller’s son?) Most will flounder in rightful obscurity. That said, each month brings some promising options that investors might choose to track.

Two, or perhaps two point five, to add to your radar:

Fund One: Hilton Small-MidCap Opportunity ETF

Hilton Small-MidCap Opportunity ETF will pursue long-term growth by investing in small- and mid-cap US stocks. Those are companies with market caps ranging from $500 million to $10 billion at purchase. The manager uses a company-by-company analysis to identify stocks of companies with solid valuations that, it hopes, will benefit from the current economic cycle. They’ll typically hold between 50-75 such stocks and, typically, remain fully invested.

The approach is style-box agnostic and risk-sensitive. Typically, new positions will represent between 1.0% and 2.0% of the Fund’s value. No position will exceed 5% of the Fund’s value at the time of purchase.

The fund will be managed by a four-person team led by Tom Maher. The expense ratio has not been disclosed, and, because it’s an ETF, there is no minimum purchase requirement.

The logic of small-to-midcap funds is that you can harness much of the return potential of small cap stocks, which are numerous and often poorly understood while buffering some of their volatility. That buffer can either be structural (a stable allocation to slightly larger, more seasoned companies) or tactical (an allocation that shifts with market conditions). By MFO’s count, there are 65 funds and ETFs whose names include either “SMID” or “Small-Mid.”

So why should you care about a 66th fund?

You should care because Mr. Maher and the strategy have compiled a record of success across the course of decades. Few of his competitors can make that claim. Mr. Maher co-managed the then-$3 billion Lord Abbett Value Opportunities Fund. Mr. Maher joined Lord Abbett in 2003 as a research analyst for the mid cap growth equity strategy, was promoted to Partner in 2010, and co-managed Value Opportunities from 2005-2018. Morningstar praised its strategy (“The approach has served the managers well over the long run”), and, most particularly, its sensitivity to value and quality (which have “given the fund an edge in down markets”). Upon Mr. Maher’s departure, Morningstar downgraded the fund from Bronze to Neutral and then ended analyst coverage.

Mr. Maher joined Hilton Capital Management in 2019. In February 2019, Hilton launched the Small & Mid Cap Opportunities (SMCO) strategy. SMCO is the strategy that Mr. Maher has piloted since 2005 and which will be manifested in the new ETF. From inception through 6/30/2023, SMCO returned 10.3% annually after fees, while its Russell 2500 benchmark returned 8.7%. That’s a 160 bps lead for SMCO.

The strategy has achieved that goal with what seems a risk-sensitive approach. Here are the strategy’s key metrics since inception.

Source: Small and Mid Cap Opportunities: June 2023. © 2023 Hilton Capital Management

The snapshot summary might be: higher returns from a somewhat higher quality and lower volatility portfolio. Investors who have noticed the historic break between large and small cap stocks this year might add Hilton to their due diligence list in anticipation of a market shift in time.

Fund Two: Virtus Newfleet Short Duration Core Plus Bond ETF

Virtus Newfleet Short Duration Core Plus Bond ETF wants to provide a high level of total return, including a competitive level of current income, while limiting fluctuations in net asset value. current income with an emphasis on maintaining low volatility and overall short duration (within a range of 1-3 years) by investing primarily in higher quality, more liquid fixed income securities. The managers rely on “active sector rotation, extensive credit research, and disciplined risk management designed to capitalize on opportunities across undervalued areas of the fixed income markets.”

The fund will be managed by David L. Albrycht, CFA, and Benjamin Caron, CFA. Mr. Albrycht is Newfleet’s President and Chief Investment Officer. Mr. Caron is a Senior Managing Director and Portfolio Manager. Along with Lisa Baribault, they manage Virtus Newfleet Low Duration Core Plus Bond Fund. Mr. Caron is also a portfolio manager of a closed-end Newfleet fund. Both Albrycht and Caron joined Newfleet in 2011 from Goodwin Capital Advisers.

This is the ETF version of Virtus Newfleet Low Duration Core Plus Bond Fund. And that’s a very good thing. Morningstar rates it as a four-star fund for the past three-, five-, and ten-year periods. Over the past decade, roughly the term of service for Albrycht and Caron, the fund has a beta of 77 against its ICE BofA 1-5 Year Corporate & Government Bond benchmark index. Relative to its Lipper peer group, the fund has modestly better returns, modestly higher volatility, and higher risk-adjusted returns.

Source: MFO Premium fund screener and Lipper global data feed

Two yellow flags: First, the expense ratio has not yet been disclosed. They would need to be noticeably below the 0.75% attached to the fund’s “A” shares in order to warrant much attention. Second, after a decade, Mr. Albrycht has no personal investment in the fund, and Mr. Caron has a nominal one (per Morningstar).

’Another such victory and I am undone’: The high cost of Pyrrhic victory

By Devesh Shah

Investors and commentators have long bemoaned the catastrophic effects of a zero-interest-rate environment: a disincentive to save, distorted capital allocations, excessive risk-taking, and inflated equity prices. In winning the fight against inflation, the Federal Reserve has given investors the victory they sought: interest rates high enough to encourage saving and penalize speculation. Our question, suggested by King Pyrruhs’ catastrophic victories in 279 BCE, is: can investors survive their victory?

Theory vs. Practice: Following the path to today’s portfolio.

While a student at Yale in 1882, Benjamin Brewster unwittingly entered a debate with an early advocate of efficient markets. His interlocutor claimed, “theory and practice cannot be at variance,” and that Brewster’s disagreement counted as “a vulgar error.” Brewster then propounds a famous aphorism:

. . . a kind of haunting doubt came over me. What does his lucid explanation amount to but this, that in theory there is no difference between practice and theory, while in practice there is? (“Portfolio,” Yale Literary Magazine, October 1881 – June 1882, 202)

The thoughtful Benjamin went on to a distinguished career as a cleric and bishop of the Episcopalian Church.

This quirky phrase applies to investing very well. By now, most informed investors know what academic theory says, and in practice, we have become very good at ignoring much of it. It doesn’t matter what’s right; it only matters what we experience to be right.

In theory, non-professional, long-only investors, are supposed to diversify across all asset classes and within each asset class. In practice, most investors have decided that US Stocks are good enough for their equity investments. Global diversification, etc., is not working. However, within the US, investors have become pretty good at diversification by investing in fund portfolios (passive or active) over picking individual stocks.

In theory, we know that money is made by buying low and selling high. Therefore, when assets that form the bedrock of our portfolios go down (think EM, bonds, International, REITS), we know we are supposed to buy into that weakness and rebalance our portfolio. Firms like GMO and Vanguard publish 7-year forecasts projecting and comparing assets that are likely to return the most and the least.

Source: “GMO 7-Year Asset Class Forecast: August 2023,” 9/17/2023

In practice, we spend exactly 7-seconds looking at these charts and analysis to confirm our biases and ignore what we don’t like. We have decided that, in practice, these long-term analysts know nothing more than we do.

We might acknowledge in the passing that some emerging markets might do well, some international stocks are very cheap, that value should beat growth over time, and that small cap should beat large cap over time, but a large number of investors have said bye-bye to all that. Enough money has been lost in actual dollars and in opportunity cost pursuing all these theoretical learnings and analysis. Most investors have voted with their wallet and don’t wish to add to the wallet of the service providers selling those products. This is not a judgment call on either the investors or the service providers, just that people have, in practice, moved on.

In theory, all investors crave the safety of principal. We would love for our principal to grow rapidly, but most of us don’t do well with volatility. Given a choice between an 8% return with lower volatility and a 12% return with 1.5x that volatility, investors may say they want the latter, but they really want the former. We divine from a combination of past volatility and current portfolio construction to make conclusions about the future and hope we are approximately right about our assessment. There are no good models that predict with any accuracy the future volatility of the market. Investors have learnt that asset allocation of the right percentage holding between stocks and safe Treasury bills might help mute that volatility and have moved in that direction.

Short-term risk-free assets is the one place where theory and practice have come together today after almost 15-16 years. We always knew it would be nice to be rewarded as savers with income, but it took the market a while to get there.

U.S. Treasury bill (aka “cash”) yields, 9/29/2023

  Annualized yield
One-month T bill 5.395%
Two-month T bill 5.459
Three-month T bill 5.471
Four-month T bill 5.527
Six-month T bill 5.552

5.5% short-term US Government Treasury bills with no volatility is right in academia and right in practice for those who know how to save. Overnight interest rates in the United States of America, mind you, this isn’t in pesos or liras; we are talking US Dollars here, baby, are providing that return, and it’s both a heaven and hell.

After going through “How do I ditch my bank who’s screwing me with low interest rates on my deposit,” “How do I buy the non-callable CDs,” “What’s the right way to buy T-Bills,” and “How do I know which Money Market fund to buy,” investors have figured out how to get to the 5.5% heaven. Here’s a chart from Goldman Sachs that shows the fund flows this year and makes the point. Year-to-date Money Market ETFs and mutual funds have received over $ 1 trillion in inflows.

These short-term interest rates, while a haven for savers have become (or are becoming) a very big problem for all other assets. It’s an unsurmountable battle to prove that one needs to take risks in anything else.

The State of the Long Bond Market

With “cash” offering high rates and zero volatility, investors are fleeing longer-dated bonds. Longer-dated Treasury Notes and Bonds are in free fall. Look at the two charts below. The first chart is the price drawdown from the peak of the Total Bond Market ETF (BND) and Vanguard Inflation-Protected Securities (VIPSX). These track broad bond indexes. Then, the second chart is the price drawdown specifically of the longer-dated bond fund, iShares 20+ Year Treasury Bond ETF (TLT), and the long-dated inflation fund, PIMCO 15+ Year US TIPS ETF (LTPZ).

The broad-based Total Bond Market ETF is down 22% in price terms since 2021. It’s one of the worst drawdowns since the 1970s (although this chart or the fund doesn’t go out that far).

The real horror story is below: in the longest-dated bonds with the highest duration. These are down between 45% and 49% in price since 2020. This year alone, the TLT is down more than 10%, and so instead of providing “fixed income,” these long-term bonds have become “fixed problems” in portfolios for all kinds of investment players.

Why has the bond market, and long bonds in particular, done so poorly?

The astronomer Carl Sagan, staring at the night sky, famously observed that there were “billions and billions” of stars. If he’d looked at the US bond market, he might well have discerned “billions and billions” of moving parts. The bond market is gigantic, with a total value of $53 trillion, larger by $7 trillion than the huge US stock market. When the asset class is so big and so deep, no one knows all of the moving parts. There is the story of the six blindfolded men who were asked to touch an elephant and guess what they were touching. A tree, a pillar, a French horn, and a broom, came the answers.

Similarly, the answers flow in for the bond market meltdown:

  • the economy is no longer going to see a recession this year,
  • the Japanese Central Bank has walked away from the Yield Curve Control,
  • Fitch USA credit rating downgrade,
  • Government shutdown,
  • dysfunctional politics in the US,
  • high debt to GDP ratios,
  • weaponization of the US Dollar serving as a wake-up call to China’s Treasury holdings,
  • reshoring and union strikes, making US inflation stickier,

and on and on. There are endless answers to the Whys of the bond market meltdown. The answers are not important because they do not help us answer the question, what would we do even if we knew exactly what was driving things? Nothing. Bonds have been used as a diversification tool, an income tool, a hedge in a recession or market crash, and they have been none of those things in the last 2-3 years.

What are the implications of a bond market meltdown?

What happens when investors with combined trillions of dollars in bonds find their value is suddenly 10 or 20% lower than before? Maybe people planned for it, maybe they didn’t.

US Government bonds act as collateral for the vast business of over-the-counter derivatives and futures and options exchange margins. What happens when the pipes get clogged because the value of collateral declines this much? Maybe the systems are much better than in the past, and no one will be surprised. Maybe they will. Do people lose faith in the collateral and ask for more?

What happens when the market wants to revisit the banking crisis from earlier in the year when the bond losses on banks’ balance sheets in the Hold to Maturity accounts become too large for the eye to ignore? A recent Barrons article, Bank of America’s Huge Bond Losses Likely Widened in Third Quarter (9/28/2023) estimates the losses on the balance sheet might be in the range of $115-$120 billion. Does it matter in the context of a Federal Reserve program where banks can borrow money against their bonds with the Federal Reserve and never have to sell the bonds until they mature? It doesn’t until it does.

One outcome is that the Private Credit market is expanding greatly in size because banks can no longer make loans as the bonds with losses continue to sit on Balance sheets.

What happens when the higher volatility in bonds flows through to Wall Street’s Value at Risk models? Usually, the lower the price of an asset and the higher the volatility, the less risk managers want that asset on the Balance Sheet. But hey, this is THE Risk-Free Bond we are talking about. Not some Argentine or Lebanese bond.

None of these individually seem to be a small problem. When combined, these are a very big headache. Or maybe they won’t be. The implications are various, but it’s up to the market when and how big of a problem to make it. It’s up to us to decide what we want out of our portfolio experience. Investors know when they are wrong-footed and need to assess all possibilities.

What would make the bond market less of a problem?

It would help very much if the bond market went up in price or at least if it stopped selling off. My biggest concern is if people don’t want to buy long-dated US bonds, why will they want to go further along the risk curve and buy anything else? When the price of a security, whatever that security might be, keeps going lower day after day, new buyers tend to hold off. Why incur price risk? This can become a buyer’s strike and enforce a vicious cycle until the value players come in.

But didn’t we have 5% long-bond interest rates or higher in the 90s and the aughts? And didn’t the stock market do just fine?

Yes, we did. But in those decades, we were coming in from higher inflation and higher bond yields. A 5% long bond coming from a 7% long bond is a much different story than when we get there from 3.5% in the long bonds. In the former periods, inflation was subsiding, and until recently, inflation in the US was rising. At best, the level of inflation is questionable.

The Chicago Federal Reserve President and Fed Vice Chair, Austin Goolsbee, said on September 28th: Once inflation is back to the 2% target, or on a clear path to it, then it would be “perfectly appropriate” to discuss the target itself.

I wrote in the June MFO issue about how Warren Buffett is looking at debt and inflation here. I still believe in that structural view. Ultimately, it feels like the only way is to let inflation run hotter than 2%, and bond investors are voting with their feet. Ultimately, this is positive for the nominal earnings of certain companies with long-life assets. But tactically, this bond mayhem is an issue that investors can do without.

When the price of long-dated risk goes up, it affects everything. Take a look at some of the major asset classes and see for yourself how much of a drawdown from the peak the passive ETFs of these core assets have suffered:

International Equities (VTIAX): 21% down from the highs

Emerging Markets (VEMAX): 33% down from their (2008!) highs

Equity REITS (VGSLX): 35% down from the highs

The only asset class that is impervious thus far is the US stock market, down only a gentle 13% from the highs in comparison.

Isn’t this a nice outcome?

In theory, it would be nice if we could continue this American dream forever. Money markets provide investors with a 5.5%-dollar income, and US stocks behave beautifully and don’t correct like the other asset classes. This music can go on forever. The US equity market is now a standout and in a class of its own. It’s nice, for sure. Will it last?

What could go wrong? Meet Murray Stahl

Enter Murray Stahl, who is the co-founder and co-portfolio manager of various funds and accounts managed by Horizon Kinetics Asset Management. Now, I must admit that we wrote critically about Horizon Kinetics funds and their ginormous 60% positions in one stock – Texas Pacific Land. We were right, too (perhaps more lucky than right). The stock and the fund corrected sharply thereafter. But sometimes, the greatest education comes from finding out why rational people like Stahl would do seemingly irrational things. Was he irrational, or was my understanding too parochial? I couldn’t wait to learn more.

That’s taken me down a Murray Stahl rabbit hole. Recently, I paid $200 for a used copy of his book and read the whole thing in a few days. In 26 chapters, Stahl boils down how great investors survived bad times and compounded wealth in good times.

I went through all his written material and videos on the fund website, which helped me understand why the fund was this big in TPL. Stahl has concluded that passive indexing is a good idea gone too far, inflation is here to stay, that real assets will benefit, and that royalty and streaming companies will outperform most other assets in the world as commodity prices increase, but the cost for these companies does not. He notes that true wealth comes from truly long-term compounding (we are talking decades) and the benefits of what happens when a stock that has compounded beautifully for decades becomes a very large % of the portfolio (like TPL), then grows the next 10% and the 10% after. The impact of that growth is enormous for wealth creation at the portfolio level.

We see that same analogy in Buffett’s holding of GEICO (now increasingly Apple) or Ron Baron’s holding of Tesla. Just to point out, when a stock becomes this big in the portfolio, it is pretty much destiny for that investor. It’s okay for Stahl, Buffett, or Baron to do this. Shah should be more careful in their portfolio as that last name does not match with any of those three above!!

Murray’s Q2 2023 Commentary and the Technology Bubble.

Readers would enrich themselves tremendously by spending time and attention on the Horizon Kinetics Q2 2023 commentary, where Stahl lays out the case for how to identify bubbles and where he claims the US stock market is in the midst of one of those right now. There are three charts from that commentary that I’d like to highlight.

The first chart shows that the % of IT stock Market Value is around 28% in the S&P 500 as of Q2’23.

“But wait, is this calculated correctly?”, Stahl asks. For example, Google, Meta, Amazon, Tesla, and Netflix are NOT in the above chart. The ETF provider iShares reclassified those companies and other companies as Communications or Consumer from the IT sector.

He included those reclassified companies back into the IT sector, and the IT sector would really be 41% of the S&P 500, which is even higher than the dot com era bubble market share of the IT sector in the S&P 500.

His commentary and other commentaries are worth a serious read for the questioning investor. His alternative is not to spray and pray on all assets worldwide. Rather, he has a nuanced view of a basket of streaming and royalty stocks (and digital currencies, I know!!) that will benefit going forth.

The caveat: Stahl has been railing against passive indices and benchmarks since at least 2015. The indices have done just fine in the last eight years, maybe too fine, according to Stahl’s beliefs. Yet, we must read his work. Growth for investors comes not from confirmation bias, but by reading opposing views and testing your own hypothesis. Stahl gives plenty of that.

If he is correct, and if the US stock market is in a bubble led by IT stocks, and the bubble breaks, (perhaps because of the bond market’s relentless selloff), then the practical portfolio most investors have accumulated today will be in trouble.

In Conclusion

Should we use the bond market alarm bells and Murray Stahl’s works to justify selling everything and going home? I wouldn’t do that, but I would be watching like a hawk, and I’d be paying very careful attention to the portfolio I hold. Ultimately, I like going back to the Buffett perspective on markets right now, which I wrote about in June.

The Investor’s dilemma now and always is what and whom to listen to. Here’s what I do know: if the bond market keeps on cracking, that’s the ONE asset we need to listen to. When the cost of borrowing structurally increases for the US Government for the next 30 years, so does the cost for EVERYONE ELSE.

It does not matter if you are Apple or NVIDIA or the Indian stock market. Everyone everywhere will feel it. Watch the bond market carefully and pray to your personal God that the bond market settles down and soon.

Briefly Noted . . .

By TheShadow

One of the two managers at Akre Focus (AKREX), Chris Cerrone, has resigned. Effective September 27, 2023, John Neff is listed as the sole manager of the consistently excellent, $13 billion large-growth fund. The fund has seen steady performance, but also steady outflows, since the retirement of founder Chuck Akre. Morningstar has placed the fund “under review,” which is certainly sensible and appropriate. That said, Mr. Neff has been co-managing the strategy since 2014. The portfolio holds fewer than 20 stocks, and the historic turnover ratio is 1%. The fund has trailed its large-growth peers on two occasions (2020 and 2023). In both cases, the market was narrow and frothy, and the fund produced entirely respectable absolute returns (20% and 10% YTD) for its investors. We do not believe that’s any immediate cause for concern.

Keith Long, co-founder and principal of Otter Creek Advisors, LLC, passed away on August 21.  The firm managed the Otter Creek Long/Short Opportunity Fund, rated five stars by Morningstar. Our condolences to his family, friends and co-workers.

The Securities and Exchange Commission has smacked a number of fund advisers for offenses of varying degrees of security. The most serious appears to concern the $70 billion DWS Funds family. The SEC found that DWS promised that the investment professionals would take into account “relevant ESG information.” They did not, and the firm has agreed to pay a $19 million fine. The SEC simultaneously found that the firm did not have adequate policies in place to avoid the risk of money laundering schemes. Other fund advisers sanctioned included William Blair, which will pay $10,000,000 for its failure to control its employees’ texting behaviors. It appears that Blair employees used their personal cell phones to text information that needed to be transmitted in a secure, monitored and archived channel. Wellesley Asset Management, the adviser to the Miller Funds, was found to have made “material misstatements and omissions in marketing materials” from 2015-2022; violations included misrepresenting its benchmark, using inconsistent methodologies, and representing hypothetical performance as actual performance. They voluntarily discontinued the practice in 2022 and will be paying a million-dollar fine.

TIAA now faces a second lawsuit over its May 29, 2023 data breach. The first suit was filed on August 8 and the second suit on August 31, both in the U.S. District Court for the Southern District of New York. The suits claim to represent the interests of 2.4 million TIAA investors. The suit alleged that TIAA allowed personal information to be “exfiltrated by unauthorized access by cybercriminals” as a result of their “impermissibly inadequate data security.”

At base, the allegation is that TIAA hired a subcontractor whose cybersecurity protections were lax and that the subcontractor had access to the files of millions of investors.

Vanguard has filed a registration statement for the Vanguard Core Bond and the Vanguard Core-Plus Bond ETFs.  Vanguard Core Bond ETF will offer exposure primarily to U.S. investment-grade securities with modest allocations to riskier sectors, such as U.S. high-yield corporates and emerging markets. Vanguard Core-Plus Bond ETF will be similarly constructed but will have the flexibility to add greater allocations in both U.S. high-yield corporates and emerging markets.  Vanguard Core Bond ETF will have an estimated expense ratio of 0.10%, while Vanguard Core-Plus Bond ETF will have an estimated expense ratio of 0.20%. Vanguard Core Bond ETF will be managed by Brian Quigley, Daniel Shaykevich, and Arvind Narayanan; Vanguard Core Bond ETF will be managed by the same trio plus Michael Chang. These groups manage the same portfolio management for their counterpart mutual funds. Vanguard intends to launch the ETFs at the end of the year.

Small Wins for Investors

Effective November 1, 2023, the shares of the GoodHaven Fund will no longer be subject to a 2.00%. We described GoodHaven’s mid-course correction in our July issue. They now boast top 1% performance YTD, for the trailing twelve months and for the past five years. In addition, they have top 10% performance for the past 36 months (as of September 2023). That’s been a remarkable and thoughtful turnaround.

Old Wine, New Bottles

AlphaCentric Strategic Income Fund is being reorganized into the AlphaCentric Strategic Real Estate Income Fund, which is scheduled to occur in November 2023

Et two, Aristotle? The five Aristotle funds have undertaken a bold rebranding. Each is removing the number two, technically “II,” from their names. Hence:

Current Fund Name New Fund Name
Aristotle Small Cap Equity Fund II Aristotle Small Cap Equity Fund
Aristotle International Equity Fund II Aristotle International Equity Fund
Aristotle Value Equity Fund II Aristotle Value Equity Fund
Aristotle/Saul Global Equity Fund II Aristotle/Saul Global Equity Fund
Aristotle Core Equity Fund II Aristotle Core Equity Fund

Touchstone Dynamic Allocation Fund will be converted into an ETF. The reorganization is expected to be completed on or about October 20

The Dustbin of History

The $56 million FPA U.S. Core Equity Fund, formerly the FPA U.S. Value Fund, which has had fewer good years than bad, will be liquidated on or about October 31.

NXG Global Clean Equity Fund will be wiped away on or about October 6.

SilverPepper, an adviser that Morningstar judges negatively (“SilverPepper fails to meet industry-standard stewardship qualities, culminating in a Low Parent Pillar rating”), has decided to liquidate its entire fund lineup. SilverPepper Commodity Strategies Global Macro Fund, SilverPepper Long/Short Emerging Markets Currency Fund, and SilverPepper Merger Arbitrage Fund will each celebrate Halloween 2023 by undergoing termination, liquidation, and dissolution.

Strategy Shares Halt Climate Change ETF will be liquidated on or about October 16.

TCW Emerging Markets Multi-Asset Opportunities and TCW Developing Markets Equity Funds will be liquidated on or about October 27.

Westwood SmallCap Growth Fund will be liquidated on or about October 20.

Ziegler FAMCO Hedged Equity Fund, which saw a catastrophic outflow at the end of summer, will be merged into DCM/INNOVA High Equity Income Innovation Fund on October 20, 2023. The previously announced plan was to do the dirty deed on September 29, but something came up.