


Asset Manager Titans Fidelity and Vanguard have options for portfolio management that vary allocations across asset classes over time which include assessments of long-term market trends. Fidelity has the Business Cycle Approach while Vanguard has the time-varying-asset approach based on the Vanguard Capital Markets Model (VCMM). In this article, I briefly describe Tactical Asset Allocation (TAA), Business Cycles, and secular markets summarized in Figure #1. I then dive into Fidelity’s and Vanguard’s methodologies.
Figure #1: Fidelity Multi-Horizon Framework
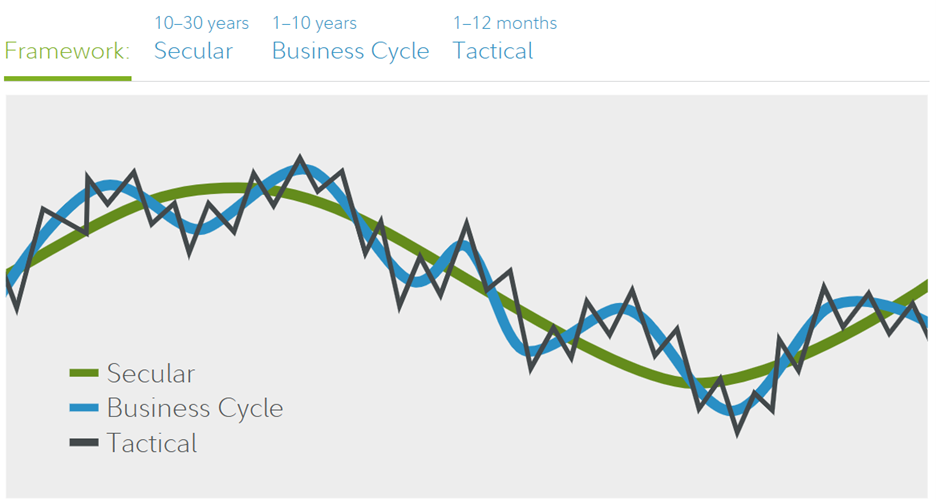
Source: Multi-Horizon Framework, Fidelity Institutional
This article is divided into the following sections:
- Section 1, Tactical Asset Allocation
- Section 2, Business Cycle Approach
- Section 3, Secular Markets
- Section 4, Battle of the Titans – Fidelity vs Vanguard
TACTICAL ASSET ALLOCATION
I set up the Fidelity ETF Screener to identify “bullish” funds that meet my criteria for investing. The basic criteria are: 1) Not Leveraged or Inverse, Net Assets over $100M, FactSet Rating (A, B, C), Morningstar (3 to 5 Star), Volume, Standard Deviation (<25), Beta (<1.5), and Price Performance. For Bullish Technical Event, I use: 1) Double Moving Average Cross Over, 2) 21-, 50-, and 200-Day Price Crosses Moving Average, and Triple Moving Average Crossover. For Oscillator Technical Events, I use: 1) Bollinger Bands, Moving Average Convergence Divergence (MACD), and Momentum.
My Bullish ETF Screen usually identifies 25 to 75 funds that I might consider if they fit into my intermediate-term investment view. I often load the “bullish” funds into MFO MultiSearch to analyze them further. As of mid-June, Table #1 contains the Lipper Categories with the most “bullish” funds. Overwhelmingly, what is bullish are smaller funds, equity income, and emerging markets.
Table #1: My Fidelity Bullish ETF Screen Results
| Lipper Category | Count |
| Small-Cap Core | 16 |
| Emerging Markets | 9 |
| Multi-Cap Value | 7 |
| Small-Cap Growth | 7 |
| Equity Income | 6 |
| Mid-Cap Core | 6 |
| Small-Cap Value | 6 |
| Financial Services | 4 |
| Real Estate | 4 |
| Large-Cap Value | 3 |
Source: Author Using Fidelity ETF Screens and MFO Premium database and screener
Lance Roberts at RIA Advice wrote “Sector Rotations Begin As Small And Mid-Cap Surge” in which he described the S&P500 as overbought and small-cap and mid-cap funds as having underperformed. Mr. Roberts makes the case that trends have shifted from the Technology, Discretionary, and Communications heavy S&P500 and may be trending toward small-size companies investing more in Energy, Financials, Materials, and Staples. His strategy is to remain underweight in stocks and overweight cash. He looks for pullbacks to make small moves to add more to cyclical stocks.
I loaded the most bullish funds from my Fidelity “Bullish ETF Screen” into MFO MultiSearch and further reduced the funds based on longer-term metrics and charts. Table #2 contains the funds that I like the most.
Table #2: Author’s Selected Bullish ETFs (One Year)
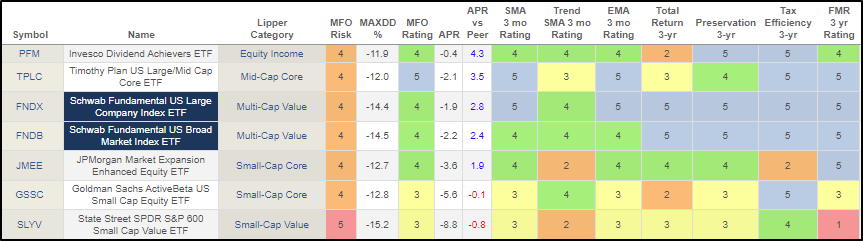
Source: Author Using MFO Premium database and screener
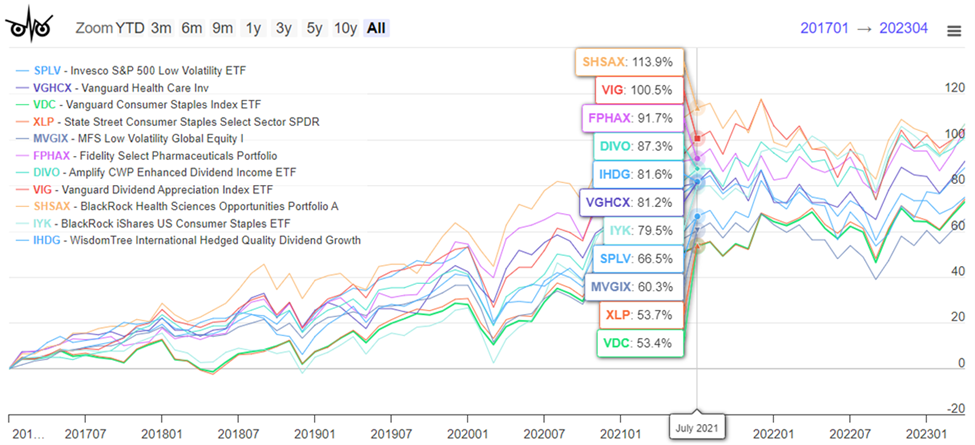
However, the MFO charts show that even the bullish funds are trending flat or down. It is best to wait for pullbacks to add to these risk assets.
Figure #2: Author’s Selected Bullish ETFs
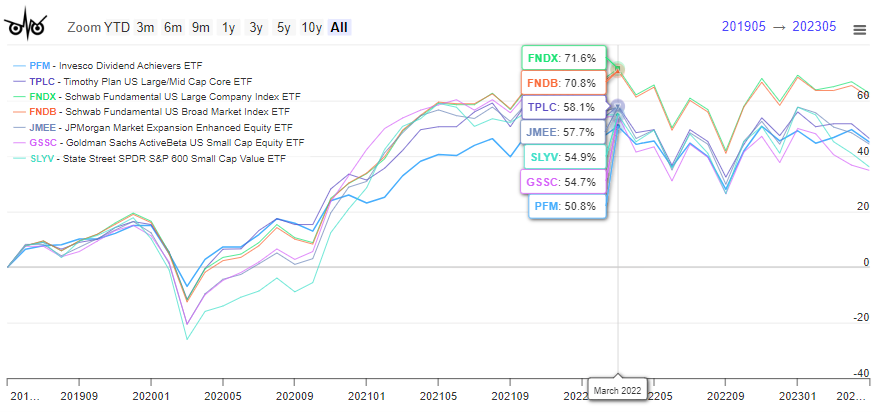
Source: Author Using MFO Premium database and screener
BUSINESS CYCLE APPROACH
Alessio de Longis, Senior Portfolio Manager at Invesco Investment Solutions, wrote “Dynamic Asset Allocation Through the Business Cycle” in which he included Figure #3 showing the performance of stocks and bonds during stages of the business cycle. Stocks perform best during early and middle expansions while longer-duration quality bonds perform best during recessions. I view the Late Stage as an opportunity to tilt my portfolio from stocks to bonds.
Figure #3: Different Risk Premia Have Outperformed in Different Macro Regimes
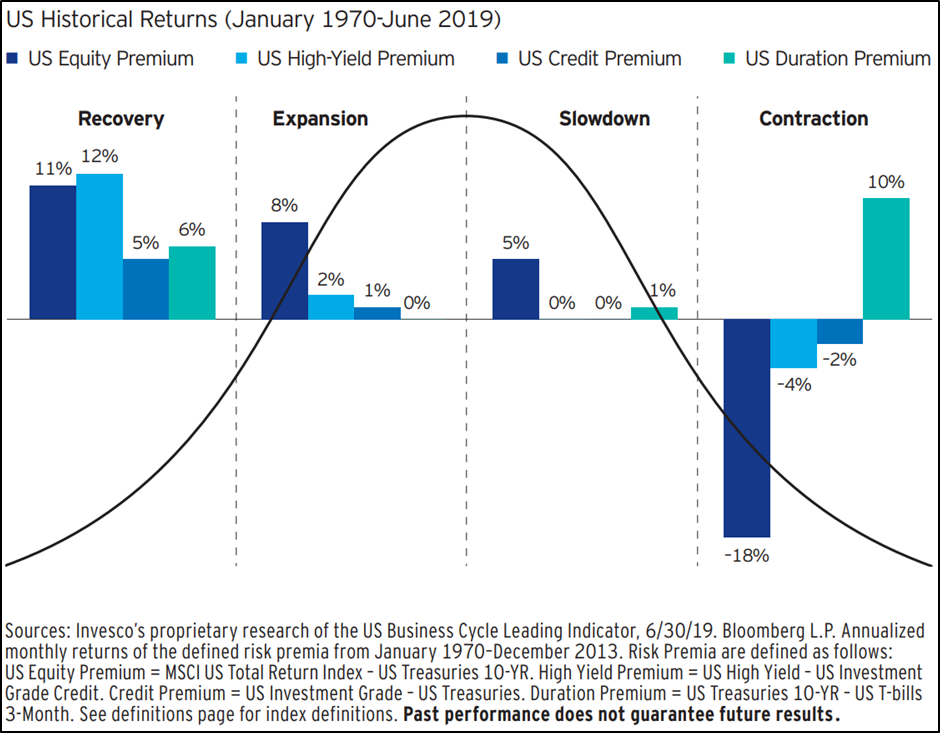
Source: “Dynamic Asset Allocation Through the Business Cycle” by Alessio de Longis, Invesco Investment Solutions
I expanded upon this concept in the December 2019 MFO article, “Business Cycle Portfolio Strategy” with Table #3 describing how Lipper Categories perform during stages of the business cycle.
Table #3: Lipper Categories by Business Cycle Stage
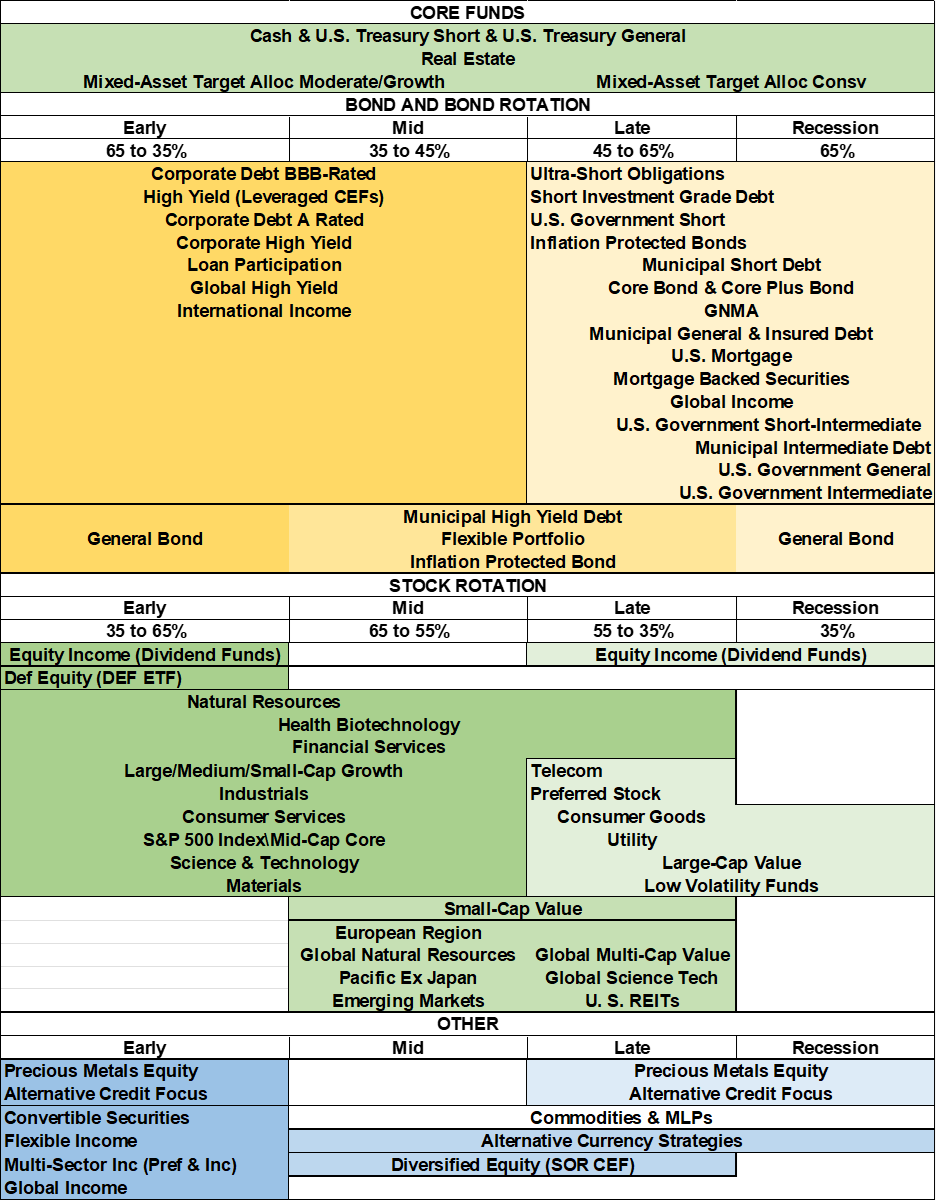
Source: Author
I set up MFO MultiSearch “Searches” to identify funds doing well by business cycle stages using the Lipper Categories in the table above. I adjusted other search criteria focusing on returns during the early and middle stages, risk-adjusted returns in the Late Stage, preservation during a Recession, and short-term trends.
I am most interested in the current “Late Stage” of the business cycle, but also want to have an eye on the Recession which I believe will start in the second half of this year and “Early” stages in case I want to start transitioning some funds for a recovery. The searches each yield about a hundred funds. I reduced these to those contained in the following tables based upon metrics such as “Fund Flow”, “MFO Family Rating”, and Lipper Ratings, among others.
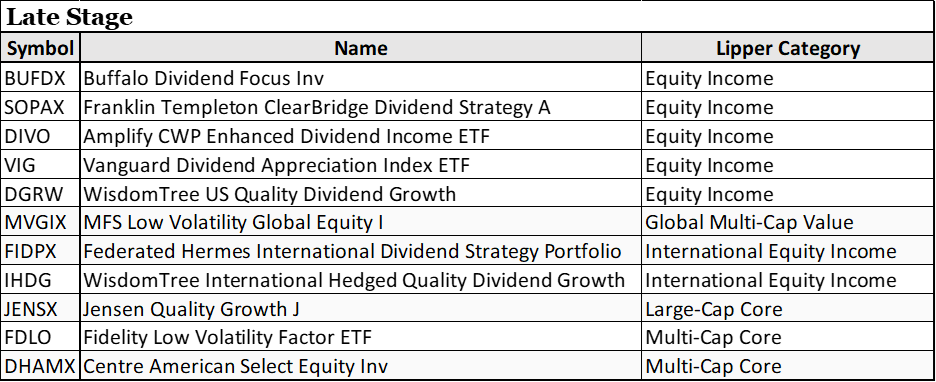
Table #4 contains funds identified in the “Late Stage” screen. In general, the funds are holding up relatively well, in particular Equity Income.
Table #4: Selected Late-Stage Funds Trending Up
Source: Author Using MFO Premium database and screener
Figure #4: Selected Late-Stage Funds Trending Up
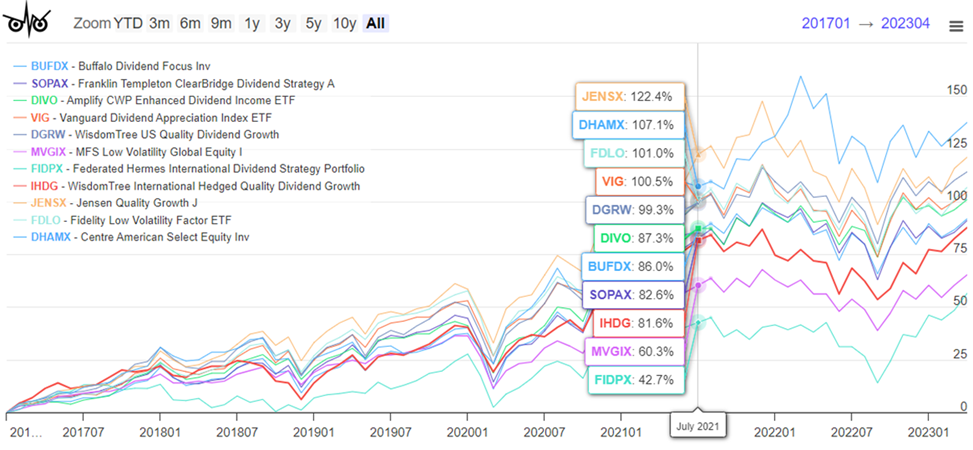
Source: Author Using MFO Premium database and screener
Funds from the Recession screen are also doing well.
Table #5: Selected Funds for Recessions Trending Up
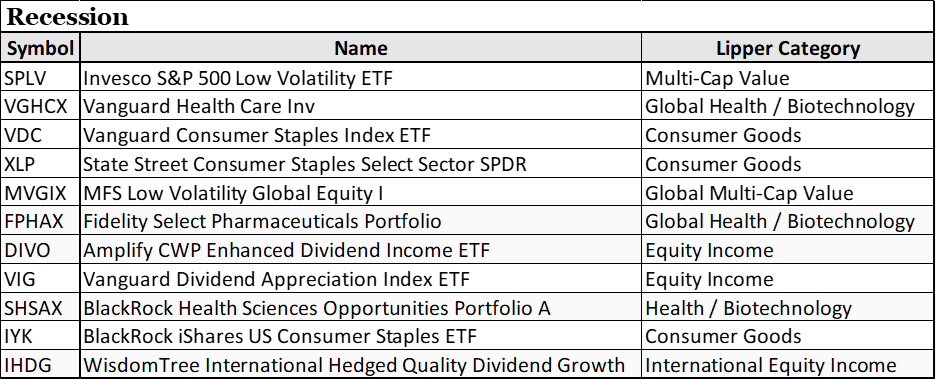
Source: Author Using MFO Premium database and screener
Figure #5: Selected Funds for Recessions Trending Up
Source: Author Using MFO Premium database and screener
Funds from the Early Expansion screen did poorly last year, but have started to recover. Those who want to buy the pullback or believe that the US economy will experience a soft landing may be interested in these funds.
Table #6: Selected Early Expansion-Stage Funds Trending Up
Source: Author Using MFO Premium database and screener
Figure #6: Selected Early Expansion-Stage Funds Trending Up
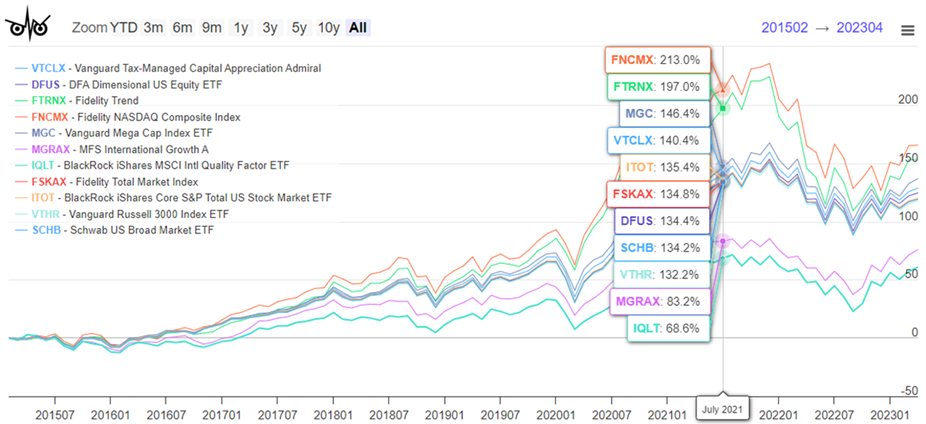
Source: Author Using MFO Premium database and screener
SECULAR MARKETS
Ed Easterling, founder of Crestmont Research, does an excellent job of describing secular markets based on valuations and inflation as shown in Figure #7. By his definition, we are still in a secular bear market. Extremely loose monetary policy has created bubbles. Valuations and inflation are both high which does not bode well for longer-term returns. Mr. Easterling says that secular bull markets are a time to sail (passive management), and secular bear markets are a time to row (active management).
Figure #7: Crestmont Research Secular Markets
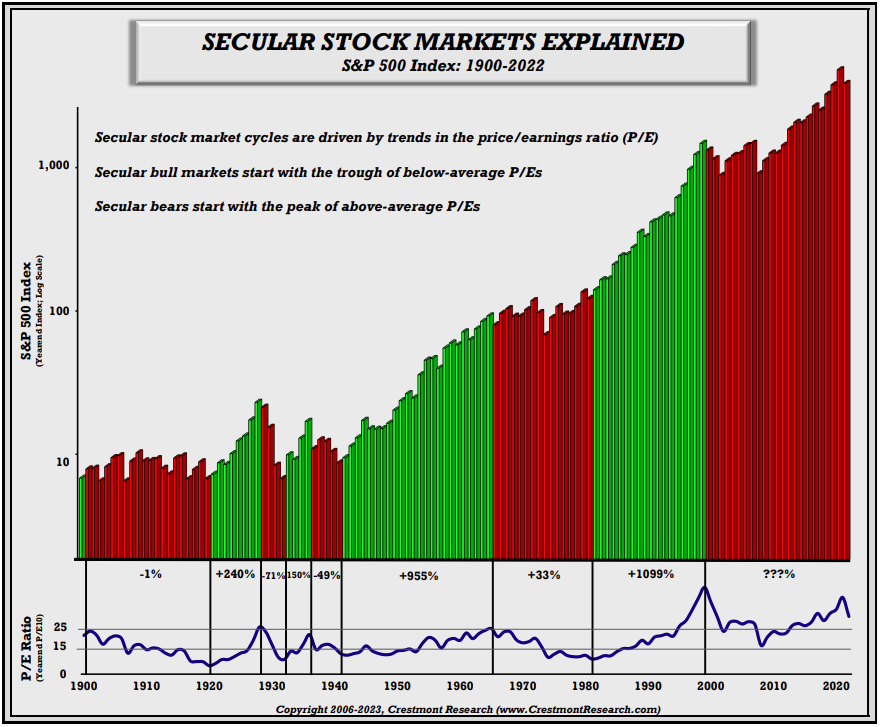
Source: “Secular Stock Markets Explained” by Ed Easterling, Crestmont Research
Both Fidelity and Vanguard create views of how the markets will look over the next decade or two. I consider this to be important in setting up a strategic investing plan.
Vanguard was founded by John Bogle in 1975 based on the principle of low-cost funds and simplicity that performed extremely well during the secular bull market of the 1980s and 1990s. Mr. Bogle wrote Enough: True Measures of Money, Business, and Life in which he recognized that high valuations would impact future returns and he lowered his asset allocation to 35% stocks. Fast forward to 2014, and Vanguard publicly launched the Vanguard Capital Markets Model (VCMM) which it had been working on for six years. Vanguard began working on VCMM well over ten years prior to Mr. Bogle passing away in 2019. The current outlook for the next ten years from the Capital Markets Model is available here.
Fidelity Institutional wrote Capital Market Assumptions: A Comprehensive Global Approach for the Next 20 Years in which they describe how long-term Capital Market Assumptions (CMAs) can help “financial advisors position their clients to reach their long-term goals…” Fidelity combines their long-term CMAs with their shorter-term business cycle research to “add value through active asset allocation”. Fidelity offers an abundance of timely information including Fidelity Viewpoints and their latest thinking on portfolio management.
BATTLE OF THE TITANS – FIDELITY vs VANGUARD
I am comfortable with the Business Cycle Approach, but the advantages of the Secular Market approach are that it looks at opportunities globally and for longer periods of time. Combining a business cycle approach with an overlay of secular markets is attractive. There are very few funds with long-term track records for varying allocations across asset classes that have reasonably high returns over the long term. These are mostly in the Flexible Portfolio and Alternative Global Macro Categories.
Each individual has different circumstances including financial literacy, risk tolerance, guaranteed income through pensions and annuities, level of savings, and goals. Enter portfolio management to customize assets to an investor’s needs (and bring in additional revenue for the manager).
I began using Fidelity Wealth Services recently to manage some longer-term portfolios. I elected to have a simple approach using mutual funds and exchange-traded funds. They make small changes to portfolios and explain why they are making them. I meet with the advisors twice a year.
I like diversifying across both Fidelity and Vanguard. I have talked with advisors from Vanguard twice during the past decade and elected not to use their advisory services. After writing this article, I feel better prepared on what to discuss when I talk to them again.
Vanguard Capital Markets Model (VCMM) and Time-Varying Approach
The purpose of Vanguard Capital Markets Model (VCMM) is to link Vanguard’s investment principles and development of realistic plans and is not intended to be a market timing or tactical asset allocation tool. Vanguard Global Capital Markets Model (2015) describes how “the asset return simulation model and how its forward-looking return projections can be applied in the portfolio construction process.” They describe the model as:
“The VCMM uses historical macroeconomic and financial market data to dynamically model the return behaviour of asset classes. It includes variables such as yield curves, inflation and leading economic indicators. The model estimates the dynamic statistical relationship between risk factors and asset returns using historical data dating as far back as 1960. It then uses Monte-Carlo regression analysis to predict these relationships into the future.”
Source: “Vanguard Global Capital Markets Model”, Vanguard, March 2015
Sophisticated Modeling and Forecasting describes how the Vanguard Capital Markets Model (VCMM), Vanguard Asset Allocation Model (VAAM), Vanguard Life-Cycle Model (VLCM), and Vanguard Financial Advice Model (VFAM) work together “which seek to optimize expected investor utilities including glide-path construction, point-in-time asset allocation, active/passive investment, and financial planning decisions.” The Capital Markets Model provides estimated performance of assets over the next ten years to the Vanguard Asset Allocation Model which optimizes the portfolio. The Financial Advice Model evaluates the strategies to recommend an optimal financial plan. Each month, Vanguard publishes their latest insights in their Portfolio Perspectives.
One approach of the Vanguard Asset Allocation Model (VAAM) is what Vanguard calls “time varying asset allocation”. They describe a 60% stock/40% bond portfolio that would have varied between 47% stock to 75% stocks over the 2020 to 2022 period. I built my Investment Model to have a target allocation of 50% stocks within a range of 35% to 65%. Vanguard cautions that their approach is not for everyone.
Fidelity Secular Capital Market Assumption and Business Cycle Approach
Fidelity has an Asset Allocation Research Team (AART) that “conducts economic, fundamental, and quantitative research to produce asset allocation recommendations for Fidelity’s portfolio managers and investment teams.” They describe Fidelity’s Business Cycle Approach to Asset Allocation. Additional information can be found in How to Invest Using The Business Cycle. Fidelity Institutional has the 2023 Second Quarter Market Update and the Second Quarter Business Cycle Update which I find very informative.
Closing Thoughts
There is plenty of information on the internet about investment management companies and their funds. There is little information about how their managed portfolios perform because they are so customizable. In order to get more information, an investor must call the companies. I choose to tread slowly.
I selected Fidelity Wealth Services to manage a portion of my assets a couple of years ago. I was not interested in using Vanguard advisory services until I learned about the Vanguard Asset Allocation Model (VAAM) and the time-varying approach. Now I want to know more, so I will call Vanguard and ask to talk to an advisor. I can envision a multi-strategy approach with Fidelity and Vanguard managing or advising me on portions of my portfolio and with me managing the remainder. Over time, I may choose to consolidate accounts.