


The mere fact that a belief is common and comfortable does not make it true. Accepting such beliefs makes you part of “the herd,” which is good only when the herd is thriving. But when the herd faces serious threats from hostile changes in their environment, whether it’s drought or wolves, the last thing you want is to have your survival tied tightly to the herd’s.
That holds true in investing, as well as in pastures.
Two such errors animate this month’s essay. First, there appears to be a widespread belief that investing according to the business cycle is market timing to make more money. Second, there’s a widespread belief that the measure of active management is its ability to “beat the market,” or at least the market’s raw returns. Neither is correct. Both adapting your portfolio to our place in the economic cycle and using active management are excellent ways to manage risk and strengthen our risk-adjusted returns. Similarly “active” management is compared unfavorably to index funds which usually invest within the same fund category. Market technician Gregory L. Morris, in Investing with the Trend: A Rules-based Approach to Money Management (2013), argues that active management and investing with the trend are about reducing risk. Mr. Morris was Senior Vice President, Chief Technical Analyst, and Chairman of the Investment Committee for Stadion Money Management, LLC. I concur.
Adjusting allocations across asset classes can be used to reduce risk and increase risk-adjusted returns. In this essay, we’ll review four business cycle models and create a fund rotation framework using 25 years’ worth of data and fund and category performance from the Lipper Global Data Feed, which I access through the MFO Premium screeners.
The simplest form of adjusting portfolios to the business cycle is to own four to six funds and adjust allocations during regular quarterly or annual rebalancing. For those who want to be more active, you may add a few sector funds or rotate between growth and value funds. Portfolios should remain diversified in each stage of the business cycle. In The Intelligent Investor, Benjamin Graham suggested a guiding rule that the investors should never have less than 25% nor more than 75% of their money in stocks. I also suggest a rule of thumb to never put more than 5% into any sector fund, closed-end fund, or riskier fund/Lipper Category.
The business cycle is clearest in the rearview mirror, but insights can be gained from reputable sources. Below are two opinions on global growth from the International Monetary Fund and UBS (Switzerland’s largest bank).
The Fidelity Figure of the Week for November 14th states:
The International Monetary Fund (IMF) cut their 2019 global growth forecast to 3%, matching the weakest performance since 2009. The IMF cites trade wars as a primary factor undermining the worldwide expansion. However, the IMF expects growth to rebound a bit in 2020.
“A Global Economic Recovery is Coming — but ‘Much Later’ than People Think, UBS Says”, CNBC
Our fear is that actually you are going to get a recovery, but it is much later than people think, and it is on a trajectory that is much flatter than people expect.
When the global economy is bumping along the bottom, it is time to be a “bit” conservative despite expectations that growth might rebound a “bit” next year.
Valuations Matter
The commonly cited price to earnings ratio is a poor measure of valuations because earnings are so cyclical. There are a host of other methods to measure valuation such as Warren Buffet’s market capitalization divided by gross domestic product, Robert Shiller’s cyclically adjusted price to earnings ratio, John Hussman’s market capitalization divided by gross value-added, and James Tobin’s Q Ratio of market value to replacement value. In Figure #1, I show my Investment Model composite indicator of five valuation methods. The market is much more highly valued than prior to the 2007 bear market but less so than prior to the bursting of the technology bubble in 2000. High valuations set markets up for steeper falls during bear markets.
FIGURE #1: VALUATIONS
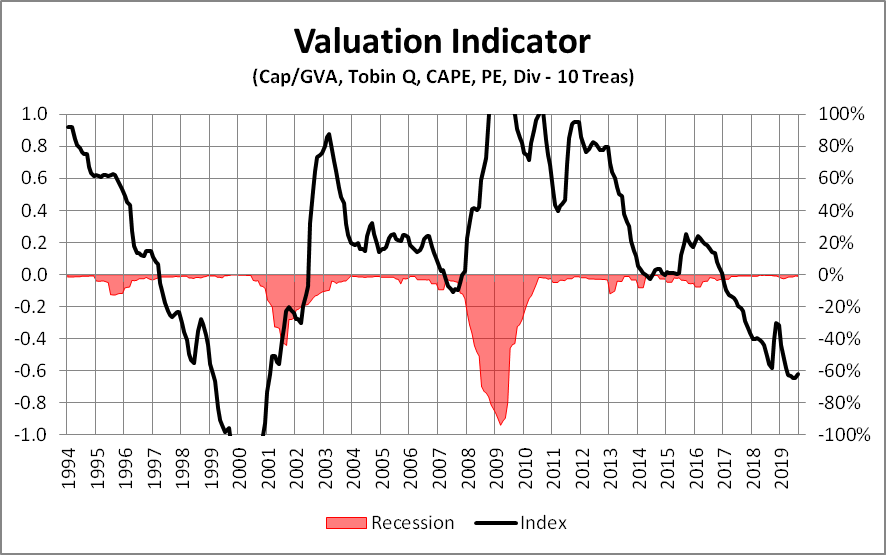
Source: Created by the author based on St. Louis Fed Reserve (FRED) & S&P Dow Jones Indices
Below are quotes from investment professionals describing current market valuations:
John Hussman, “A Striking Collection of Duck-Like Features”:
The combination of extreme stock market valuations and depressed interest rates continues to imply dismal estimated expected returns for passive investors. As of October, our estimate of the prospective 12-year average annual total return for a conventional asset mix (invested 60% in the S&P 500, 30% in Treasury bonds, and 10% in Treasury bills) has declined to the lowest level in history aside from the week of the 1929 market peak.
Lance Roberts, “Corporate Profits Are Worse Than You Think”:
“If the economy is slowing down, revenue and corporate profit growth will decline also. However, it is this point which the ‘bulls’ should be paying attention to. Many are dismissing currently high valuations under the guise of ‘low-interest rates,’ however, the one thing you should not dismiss, and cannot make an excuse for, is the massive deviation between the market and corporate profits after tax. The only other time in history the difference was this great was in 1999.”
Crescat Capital, “Crescat Capital 1Q19 Letter: Dismantling the Bull Case: ‘Central Banks Do Not Have Your Back’ ” by Jacob Wolinsky, ValueWalk
Crescat’s macro model combines sixteen factors across key fundamental, economic, and technical indicators to time the stock market and business cycle. After the year-to-date rally, the model is just two percentage points from record overvalued and record late-cycle levels!
Business Cycle Model #1: Financial Physics
Two of the most educational books for me are Unexpected Returns: Understanding Secular Stock Market Cycles and Probable Outcomes by Ed Easterling, because they explain the differences in long periods of high stock market returns and low returns. Mr. Easterling was a professor at Southern Methodist University and founder of Crestmont Research which maintains interesting articles such as Financial Physics (Figure #2). Financial Physics shows the relationship between inflation and valuations upon stock market returns.
FIGURE #2: FINANCIAL PHYSICS
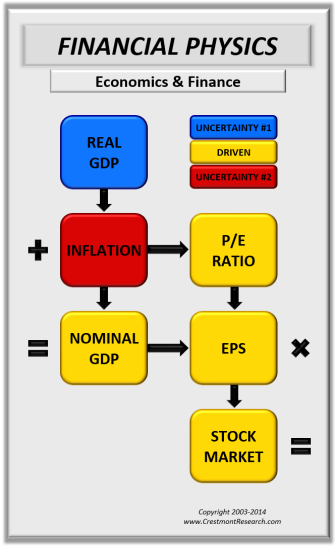
Source: Crestmont Research
To illustrate Mr. Easterling’s concept of secular markets, the S&P 500 returned nearly 17% annually from 1985 until 2000, rising from low valuations with high inflation culminating in the technology bubble. In the nearly 20 years since the bursting of the technology bubble, the S&P 500 has returned less than 6% annually. That the stock market has returned 11% for the past 35 years misrepresents that the majority of the gain was in the first 15 years.
Figure #3 shows the performance, including dividends and expenses, of Vanguard Wellington (VWELX) with about 65% stocks, the Vanguard Wellesley Income (VWINX) with about 35% stocks, and the S&P 500 (VFINX) over the past 22 years. It took the Wellington fund 15 years following the bursting of the 2000 bear market to outperform the more conservative Wellesley fund and another 5 years for the S&P 500 to catch up. Recessions have not been eliminated and we are in the late stage of the business cycle.
FIGURE #3: ILLUSTRATION OF SECULAR PERFORMANCE
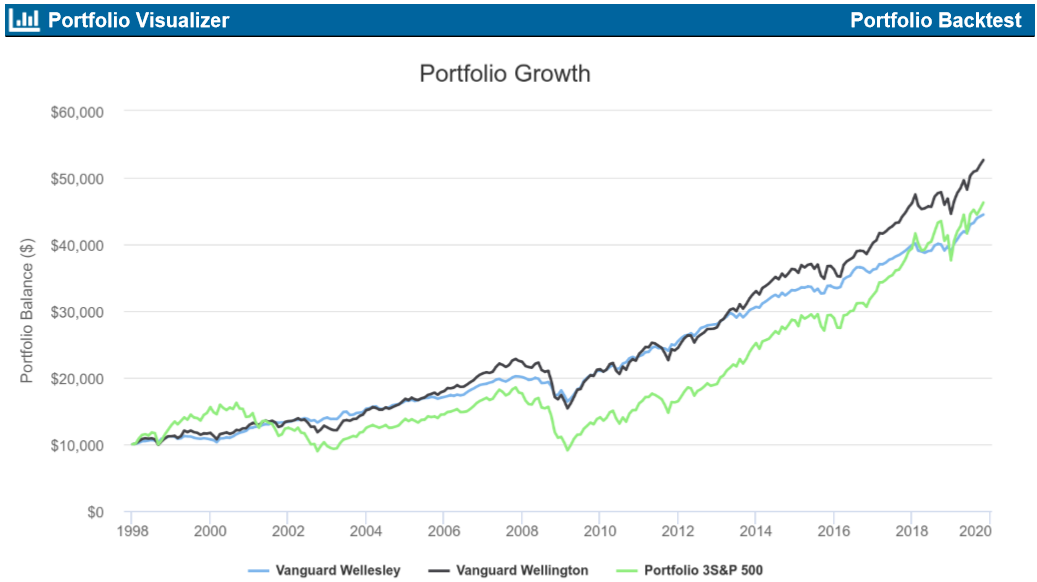
Source: Portfolio Visualizer
Regarding valuations, Mr. Easterling writes (The P/E Summary October 3, 2019):
In the third quarter, the stock market gained an additional 1.2%. As a result, normalized P/E increased to 32.7—significantly above the level justified by low inflation and low-interest rates. The current status remains “significantly overvalued.” Note that stock market valuation is in a zone of exuberance such that each higher level (or slight decline) is equally “high.”
Business Cycle Model #2: Six Stages
Martin Pring was described in Forecasting Financial and Economic Cycles (1994) by Michael P. Niemira and Philip A. Klein as advocating a six-stage business cycle framework which is shown below. Mr. Pring has written numerous books that I found informative and runs the InterMarket Review. The six-stage business cycle model shows how stocks, bonds, and commodities perform during each of the stages.
FIGURE #4: MARTIN PRING’S SIX STAGE BUSINESS AND MARKET CYCLE MODEL
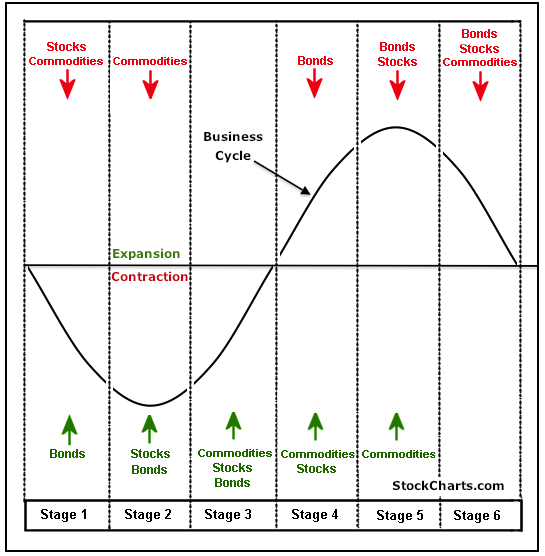
Source: StockCharts.com
The six stages of the model are summarized by StockFigures as follows:
-
- Stage 1 shows the economy contracting and bonds turning up as interest rates decline. Economic weakness favors loose monetary policy and the lowering of interest rates, which is bullish for bonds.
- Stage 2 marks a bottom in the economy and the stock market. Even though economic conditions have stopped deteriorating, the economy is still not at an expansion stage or actually growing. However, stocks anticipate an expansion phase by bottoming before the contraction period ends.
- Stage 3 shows a vast improvement in economic conditions as the business cycle prepares to move into an expansion phase. Stocks are rising and commodities are anticipating an expansion phase by turning up.
- Stage 4 marks a period of full expansion. Both stocks and commodities are rising, but bonds turn lower because the expansion increases inflationary pressures. To combat this, interest rates start to move higher.
- Stage 5 marks a peak in economic growth and the stock market. Even though the expansion continues, the economy grows at a slower pace because rising interest rates and rising commodity prices take their toll. Stocks anticipate a contraction phase by peaking before the expansion actually ends. Commodities remain strong and peak after stocks.
- Stage 6 marks a deterioration in the economy as the business cycle prepares to move from an expansion phase to a contraction phase. Stocks have already been moving lower and commodities now turn lower in anticipation of decreased demand from the deteriorating economy.
Business Cycle Model #3: Four Stages
Fidelity does a great job explaining secular and cyclical markets in How to Invest Using the Business Cycle. If an investor wanted to sit down for an hour and understand the current investment environment with respect to business cycles, this Fidelity presentation is where I recommend starting.
FIGURE #5: FIDELITY INVESTMENTS FOUR STAGE BUSINESS CYCLE MODEL
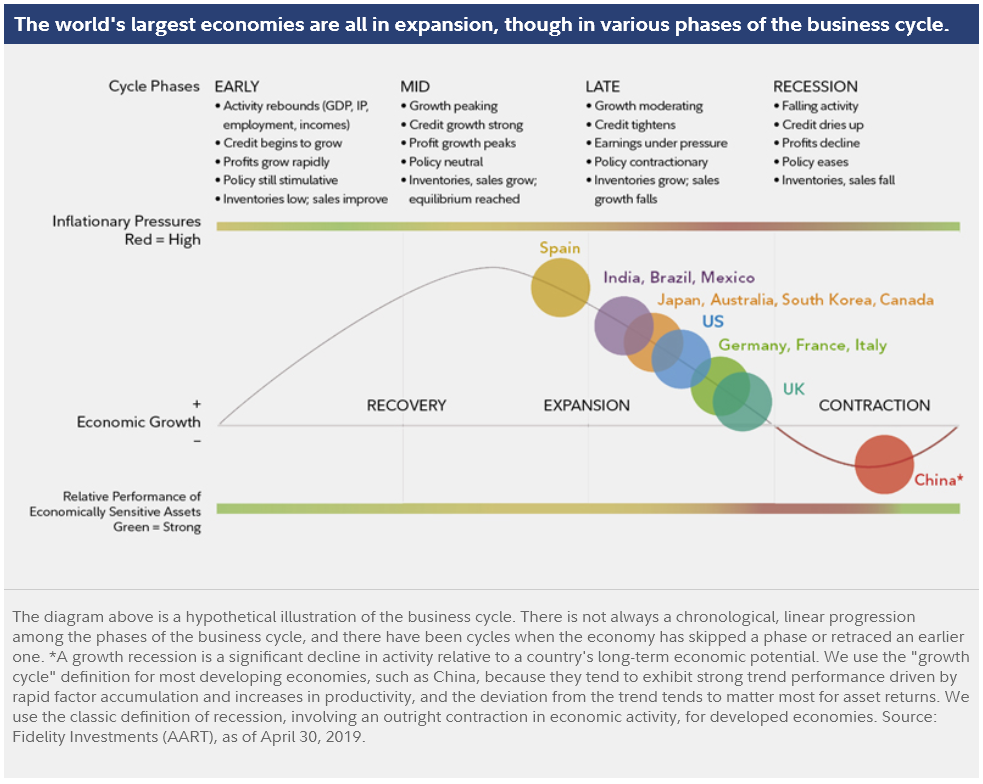
Source: Fidelity Investments
Figure #6 shows Fidelity’s assessment of sector performance during the business cycle.
FIGURE #6: SECTOR PERFORMANCE BY BUSINESS CYCLE
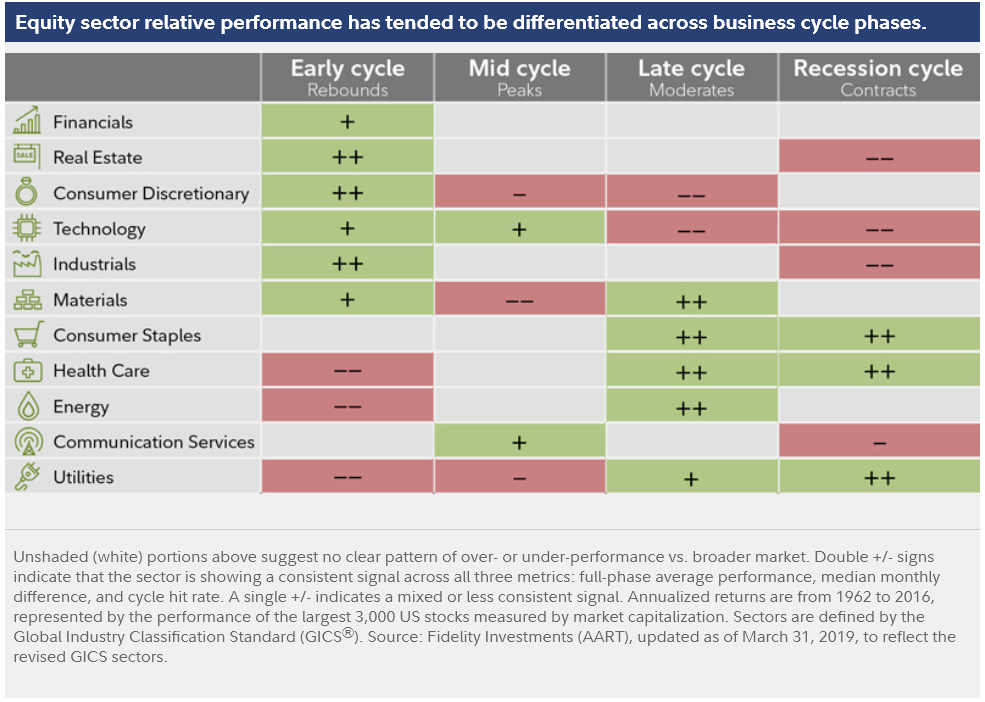
Source: Fidelity Investments
The secular trends that Fidelity identifies are:
-
- Less rules-based and less market-oriented global system
- Peak globalization
- Higher political risk
- Inflationary pressures
- Pressures on productivity growth and corporate profit margins
- Slower global growth with emerging markets leading
- Slower long term growth in the US (less than 2% over the next 2 decades)
- Long term rise in interest rates
These trends have widespread implications for investors. High debt levels and deficits are a concern of mine. For government spending in general, entitlements will have to be reduced or taxes raised. Rising interest rates and inflation will not favor bond investors.
Business Cycle Model #4: Growth and Inflation
The Era of Uncertainty: Global Investment Strategies for Inflation, Deflation, and the Middle Ground (2011) by Francois Trahan and Katherine Krantz is another insightful book about investing according to the business cycle. Francois Trahan is UBS’s head of U. S. equity strategy, and Katherine Krantz is a Managing Director at UBS. I created the following table based on their book. They create a nine-box investment style based on economic growth and inflation. The yellow shaded area is what they say does well during a low growth, low inflation environment. If you believe that we are moving toward a recession with deflation and low growth then government bonds, cash, gold, staples, health care, and utilities are the investments to own. If you believe that growth will pick up and inflation will stay low then corporate bonds, technology, financials, and consumer discretionary funds are the place to be.
TABLE #1: ERA OF UNCERTAINTY GROWTH VS INFLATION MODEL

Source: Developed by Author Based on Era of Uncertainty
Balanced Fund by Stage
I use the Vanguard Wellesley Income and Vanguard Wellington Funds for comparisons by stage, using the S&P 500 as a baseline. The stages were selected on business cycle indicators for the past 25 years and not by cherry-picking the tops and bottoms of the stock market. Table #2 shows the average annualized return and average Maximum Drawdown. The Vanguard Wellington and S&P 500 outperformed the conservative Wellesley fund during the early and middle stages, but the gap narrowed in the late stage. The Wellesley was far superior during the recessions. This is reflected in the drawdowns.
TABLE #2: FUND PERFORMANCE BY STAGE
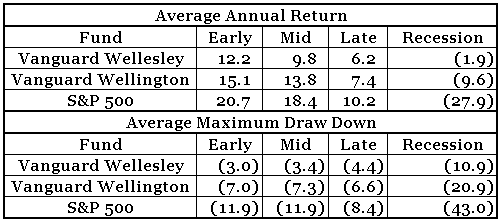
Source: Portfolio Visualizer
Developing a Business Cycle Allocation Model
Keep it Simple. A model built on sound principles will probably survive the tumult of the markets much longer and much better than an overly complex model. Complexity tends to fail, and unfortunately, usually at the worst time… It seems that too often investors associate complexity with viability. That is not correct.
Investing with the Trend: A Rules-based Approach to Money Management, by Gregory L. Morris
In developing an allocation strategy, I wanted to look at what has done well during the past 25 years, taking into account that each business cycle and recession is different. The best Lipper Categories are grouped by business cycle stage to provide longer periods of time where funds may outperform.
Powerful, user-friendly databases allow the individual investor to do an incredible amount of research. I divided the past 25 years into four stages of the business cycle using the St. Louis Federal Reserve FRED database based on the Federal Funds rate, Inflation (PCE Price Index), Unemployment Rate, Real GDP, and recessions. I used the Mutual Fund Observer to create a list of 146 diverse exchange-traded funds in existence before the 2007 recession, and two lists of mutual funds with a few closed-end funds. I then used Portfolio Visualizer to create two portfolios for each stage of the business cycle. I combined the portfolios by Objectives that performed well during each stage of the business cycle.
Table #3 shows the Core Funds including cash, short term and general treasuries that should be in every balanced portfolio. Both retail and institutional investors have been increasing allocations to money funds for the past several years while the stock market valuations increased and risks have risen. Real estate is a broad classification and there is usually one type of real estate that is doing well in each stage of the business cycle. One simple rotation strategy is to own more of a moderate or growth mixed-asset fund like Vanguard Wellington (VWELX) during the early and middle stages of the business cycle and more of a conservative mixed-asset fund like Vanguard Wellesley Income (VWINX) during the late and recession stages.
The bond funds that do well in the early and middle stages of the business cycle are Corporate Debt BBB-Rate, High Yield, and Corporate Debt A-Rated. In the late stage of the business cycle when the Federal Reserve is raising rates then Ultra-short Obligations, short term investment grade, and U. S. Government debt do well. As interest rates stop rising or start to fall, Municipal Debt, Core Bond, GNMA, U.S. Mortgage, and Global Income do well. As the economy goes nears a recession, quality debt like Government intermediate debt and Municipal Debt do well. General Bond does well during recessions and into the early stage, but in the mid to late stages, Municipal High Yield, Flexible Portfolio, and Inflation Protected Bonds tend to do well.
TABLE #3: CORE AND BOND FUND ROTATION BY BUSINESS STAGE
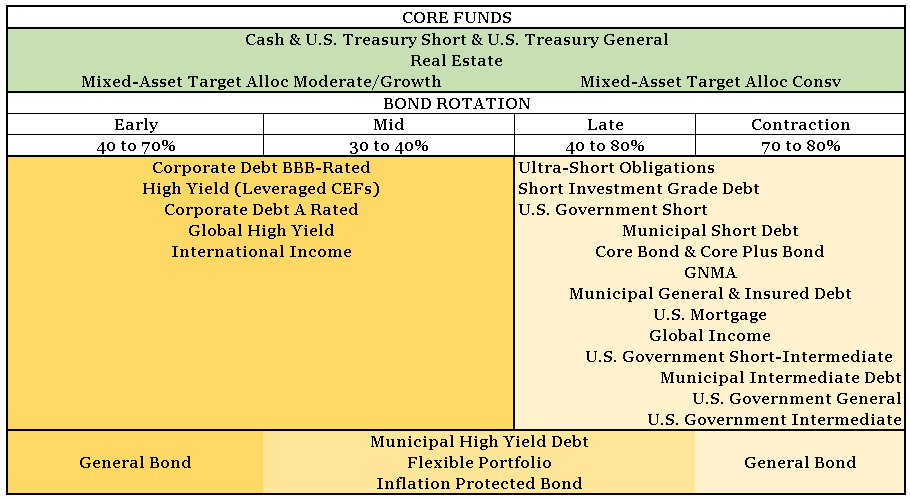
Source: Created by the author based on Mutual Fund Observer and Portfolio Visualizer
Table #4 shows which equity objectives do well by stage. As the economy starts to recover, natural resources, technology health care, financial services, growth funds, small-cap funds, and industrials tend to do well. In the latter stages, consumer staples, utilities, large-cap value, equity income (Dividend Funds) and low volatility funds do well.
TABLE #4: EQUITY FUND ROTATION BY BUSINESS STAGE
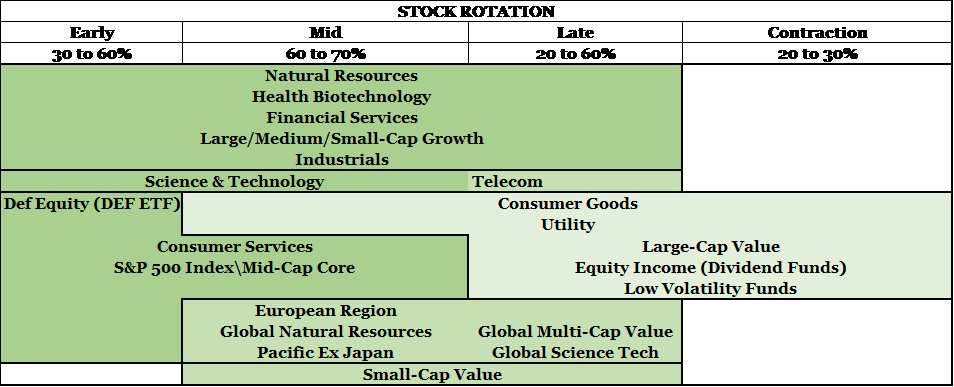
Source: Created by the author based on Mutual Fund Observer and Portfolio Visualizer
Other categories may be considered by some investors as shown in Table #5. Precious metals tend to do well in the late stage, recessions, and the early stage because of uncertainty or recessions.
Alternatives: These strategies usually come to fruition during the mid- to later years of secular bear markets, when investors realize that passive investing is no longer working. Futures, hedging, options, and a whole host of derivative products are used across the board of the alternatives strategies.
– Investing with the Trend: A Rules-based Approach to Money Management, by Gregory L. Morris
TABLE #5: “OTHER” FUND ROTATION BY BUSINESS STAGE
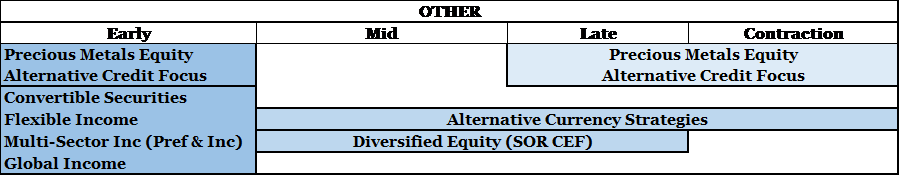
Source: Created by the author based on Mutual Fund Observer and Portfolio Visualizer
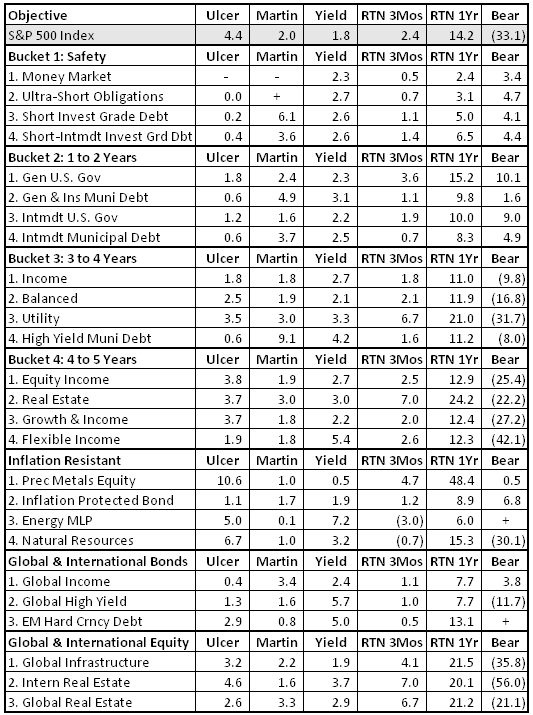
Top Ranked Funds
Since last month, I have made some changes to my ranking system. I used the Ulcer Index, Martin Ratio, MFO Risk, MFO Rating, and performance during recessions to divide the funds by Objective into Buckets to categorize funds by withdrawal needs. The Ulcer Index factors together with the depth and duration of a fund’s drawdowns; funds that go down a long way and stay there a long have higher Ulcer Indexes. Bucket #1 is for money that needs to be kept safe. The MFO Rating assesses a fund’s risk-adjusted returns based on the Martin Index; the Martin Index itself measures a fund’s performance during drawdowns, based on the logic that volatility on the upswing is annoying but volatility on the downside is disastrous. Only the top four categories per bucket are listed in Table #6. I also added funds that tend to do well when inflation is increasing.
Each month I download about a thousand funds from MFO Premium MultiSearch. I rank objectives and funds based on Momentum (3 and 10 month trends and moving averages), Quality (bond rating, low leverage, Fund Family Rating, Ferguson Metrics, composite ratings), Valuation (price to earnings ratio, price to cash flow, price to book), Risk (Ulcer Index, MFO Risk, capture metrics, debt to equity, performance during recessions), Risk-Adjusted Returns (Martin Ratio, MFO Rank, Great Owl Classification), and Income (Yield). The data in Table #4 is based on the past two years from November 2017 to October 2109 because I like to capture the rotation to late business cycle stage investments. The Bear column is the average performance during the past two recessions.
TABLE #6: TOP RANKED OBJECTIVES BY BUCKET (NOV 2017 to OCT 2019)
Source: Created by the author based on Mutual Fund Observer
Top-ranked funds are listed in Table #7 for each Objective. “Other” refers to no-load funds available through Charles Schwab. Cohen & Steers Global Realty (CSSPX) has a minimum investment of $100,000, but I include it because I am able to purchase it through an employer-sponsored plan with no minimum. The low-minimum “A” shares of the same fund are available no-load/NTF through Schwab as well.
TABLE #7: TOP RANKED FUNDS BY OBJECTIVE AND BUCKET
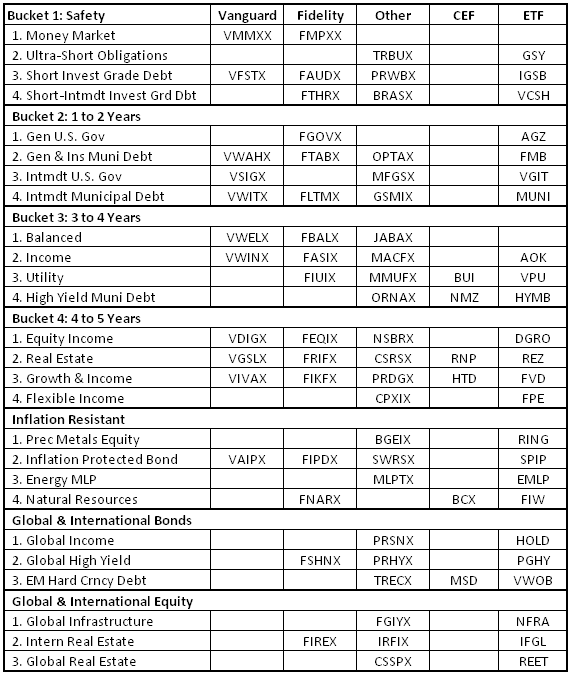
Source: Created by the author based on Mutual Fund Observer
This month, I loaded the 10 top-rated funds from each of Vanguard, Fidelity, mutual funds available at Schwab, closed-end funds, and exchange-traded funds into Portfolio Visualizer and created a portfolio of 18 funds. I show more funds than necessary for a diversified portfolio to give readers a selection. Since November 2017 (two years), the portfolio has a correlation of 0.71 to the US Stock Market, a Sortino Ratio of 2.5, and a maximum drawdown of less than 2%. The average annual return was 7.4% with a yield of 3.3%.
TABLE #8: MODEL PORTFOLIO PERFORMANCE NOV 2017 TO OCT 2019
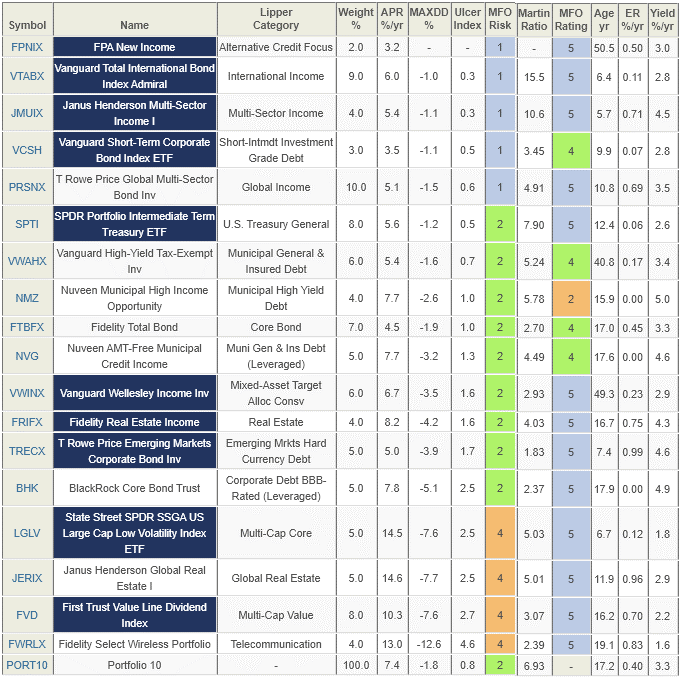
Source: Created by the author based on Mutual Fund Observer
Notes:
-
- Funds highlighted in blue are MFO “Great Owl” funds, which have top-tier risk-adjusted returns in every trailing measurement period longer than twelve months.
The MFO Premium screener defaults to showing a fund’s oldest share class (OSC), which is often the institutional class. That does not mean that your access is limited to the high minimum version. For example, JERIX has a minimum investment of $100,000 at Charles Schwab but the fund offers five other share classes, including a no-load, retail “T” class, JERTX, with a $2500 minimum.
Closing
This article highlights some of the philosophies that have influenced me over the past decade. I find the new Mutual Fund Observer Portfolio Tool (MFO Premium access required) to be one of the best “keep it simple” tools for the individual investor. It gives me a quantitative method for pruning funds that no longer fit into my “sleep at night” lifestyle.
Books and Articles about Business Cycles
MFO’s December 2019 on books and sanity highlights books that aren’t explicitly about markets and investing. Those books emphasize virtues like distance, fresh perspectives and, well, sanity. I’d like to supplement those with some technical works, including essays I’ve published elsewhere, that are more narrowly focused on the significance of business cycles in your success as an investor. I hope you find them provocative and profitable!
Business Cycles: History, Theory and Investment Reality, (2006) by Lars Tvede
Business Cycles (1999) by Francis X. Diebold, Glenn D. Rudebusch
The Age of Deleveraging: Investment Strategies for a Decade of Slow Growth and Deflation, (2011) by A. Gary Shilling
Recessions and Depressions: Understanding Business Cycles (2010) by Todd A. Knoop
Business Cycle: Simple Portfolios by Stage, Charles Lynn Bolin
Business Cycle: Boring Bond Funds, Charles Lynn Bolin
Business Cycle: Slowing Sales with Growing Inventories, Charles Lynn Bolin
Disclaimer
I am not an economist nor an investment professional. I became interested in economic forecasting and modeling in 2007 when a mortgage loan officer told me that there was a huge financial crisis coming. There were signs of financial stress if you knew where to look. I have read dozens of books on business cycles since then. Discovering the rich database at the St. Louis Federal Reserve (FRED) provides most of the data to create an Investment Model. The tools at Mutual Fund Observer provide the means for implementing and validating the Investment Model.