


We’re near year’s end, decade’s end, and quite possibly the bull market’s end and the economic expansion’s end. It’s been easy to be a bad investor for the past 10 years: the market’s relentless rise, fueled by enormous amounts of fiscal (hello, trillion-dollar deficits!) and monetary (hello, negative real interest rates!) stimulus, had made it likely that even a badly constructed portfolio booked acceptable – perhaps even double-digit – returns.
Do not bet your future on a repeat of that happy pattern.
The Observer’s core beliefs are (1) valuations matter and (2) you will do harm to yourself given the opportunity. It’s time to reduce the opportunity.
Our Portfolio Pruning Primer
-
If the number of investments exceeds the number of fingers, it’s time to prune.
In, say, a three-fund portfolio, every fund counts and every fund can be accounted for. That is, you have the brain space to keep track of three objects. Psychologists, famously, think you have the brain space to keep track of five to nine objects (expressed as “seven plus or minus two,” a limit of working memory first tested in 1956). You have no more prospect of keeping track of 15 funds running around your portfolio than you have of keeping track of 15 toddlers running around your house.
-
If you don’t need it, prune it.
Having three domestic growth funds has no advantage over having one. Having minuscule positions in 14 asset classes that you can’t weigh, monitor and rebalance is a lot less powerful than having access to four that you can. (Doubt me? Go play with the portfolio risk analyzer at MFO Premium. Set up a 14-fund portfolio and a one fund/four asset class portfolio – Fidelity Four-in-One Index will do – and try to figure out what you’ve gained from clutter.)
-
If you can’t explain it, prune it.
Commitment is the key to long-term success. Most investors undercut themselves by buying what’s been hot and selling, sometimes in a panic, what’s been cold. That has always been a recipe for failure.
The key to holding on is knowing what you own and why you own it. For each fund I own, I can explain in about three sentences, in terms my 19-year-old can understand, what each of my managers does and why I have chosen them. I have confidence in them, I’m unconcerned by consecutive years of sub-par returns, and I sell a fund about once a decade. That patience would be incredibly hard to sustain if I mostly thought “my guy has a secret sauce or magic wand or something that he uses when he … uhh, hedges his naked straddles?”
-
If the manager won’t buy it, prune it.
There’s decent evidence that managers with substantial “skin in the game” make fewer impulsive moves than those without. Returns might not improve, but riskiness declines. There’s fascinating evidence that managers whose board of trustees have skin in the game are much more responsible; nothing focuses your attention quite like the prospect of losing a lot of your boss’s money. That’s why we report manager and trustee ownership in every fund profile. You can find the same data in the fund’s Statement of Additional Information.
-
If it doesn’t protect you in bad times, prune it.
Market-cap weighted index funds and ETFs can be wonderful devices for capturing the gains in a rising market, and their enormous popularity entirely corresponds to 12 years of a relentlessly rising market. They’re also going to capture 100% of every collapse and have no liquid reserve (aka “dry powder”) to capture opportunities in the face of a collapse. That’s not a criticism of them, it’s just an explanation of their structure.
About 80% of active funds are no better: their managers are so desperate to win the “beat the market” game that they have poor risk or downside management and little upside advantage. Many are just fat, expensive, slightly desperate index wannabees.
Don’t buy those. If you’ve bought them, it’s time to reconsider.
In this story, we look at three different measures of downside risk and highlight the funds that have the worst decade long performance on each measure. The point of this roll call of the wretched is both to answer the question “how bad can it get?” but, more importantly, to point you at the sorts of tools you can use to protect your own assets.
A warning about benchmarks and stats
The tables below report one funds’ behaviors over the past 10 years (144 months). That’s been a bull market, with just 34 down market and 15 bear market months. As a result there’s a degree of optimism built in.
Deviation stats are relative, not absolute. A bear market deviation of 15 does not mean that you’ll lose 15% in a bear market year, far from it. You need to compare your fund’s downside to a relevant benchmark’s; if the benchmark value is 7 and your value is 15, anticipate about twice as much pain as whatever the benchmark suffers.
We offer two benchmarks in each table, representing a 100% US equity portfolio and a 60% equity/40% bond portfolio. Those are directly relevant to some funds, less to others but they do reflect about 90% of investor portfolios. MFO Premium subscribers can access all the specific category averages and can play to their heart’s content with time periods and metrics.
The Worst of the Deviants

While we generally endorse looking at risk-return metrics such as the Martin Ratio, ferreting out funds that might pose the greatest threat in a serious market downturn requires focusing clearly on pure downside measures. Using the tools at MFO Premium, we’ve identified the 10 worst equity-oriented funds of the past decade based on each of three different downside measures.
To be clear, these are not the biggest laggards, they’re just the most challenged ones.
Greatest 10-year downside deviation
Downside deviation can be thought of “day-to-day downside.” It measures only downward variation; specifically, it measures a fund’s return below the risk-free rate of return, which is the 90-day T-Bill rate (aka cash). Downside deviation doesn’t worry about how the stock market is doing, it just identifies funds which – in any market – return less than money in a savings account would.
| Lipper category | Downside deviation | 10-year annual returns | Worst drawdown | vs peer group | |
| Benchmarks | |||||
| Vanguard Total Stock Market VTSMX | Multi core | 7.9 | 13.5 | -17.7 | 1.7% |
| Vanguard Balanced Index VBINX | Growth allocation | 4.4 | 9.6 | 9.0 | 1.0 |
| iShares MSCI Turkey ETF TUR | EM | 22.0 | -4.3% | -68.2% | -8.4% |
| Madison Small Cap BVAOX | Small core | 21.4 | 1.2 | -63.55 | -10.2 |
| Jacob Small Cap Growth JSIGX | Small Cap | 20.4 | 3.9 | -51.5 | -9.3 |
| VanEck Vectors Brazil Small Cap BRF | Latin Am | 20.1 | -0.9 | -79.0 | -1.2 |
| iShares MSCI Brazil ETF EWZ | Latin Am | 19.9 | -1.3 | -70.7 | -1.7 |
| Vanguard Global Capital Cycles VGPMX | Global multi value | 19.1 | -5.4 | -74.2 | -12.4 |
| Upright Growth UPUPX | Global multi value | 18.8 | 0.5 | -73.6 | -6.6 |
| Schneider Small Cap Value SCMVX | Small value | 17.5 | 5.2 | -44.5 | -5.2 |
| VanEck Vectors Russia RSX | EM | 17.5 | 1.2 | -61.3 | -2.9 |
| Pacific Advisors Small Cap Value PASMX | Small value | 17.4 | 7.1 | -54.8 | -3.3 |
The worst big fund: Vanguard Global Capital Cycles (VGMPX) with a downside deviation of 19.1 – more than twice the market average – and $1.2 billion in assets.
Greatest 10-year down market deviation
Down market deviation can be thought of as “the downside in any sort of declining market.” Pure downside deviation includes only fund returns less than zero. Basically, DMDEV indicates the typical annualized percentage decline based only on a fund’s performance during negative market months. So, if the market drops by even 0.1% in a month, we report how each fund did and then project it over 12 months.
| Lipper category | Down market deviation | 10-year annual returns | Worst drawdown | vs peer group | |
| Benchmarks | |||||
| Vanguard Total Stock Market VTSMX | Multi core | 7.8 | 13.5% | -17.7 | +1.7 |
| Vanguard Balanced Index VBINX | Growth allocation | 7.8 | 9.6 | 9.0 | 1.0 |
| Schneider Small Cap Value SCMVX | Small value | 17.5 | 5.2 | -44.5 | -5.2 |
| Pacific Advisors Small Cap Value PASMX | Small value | 17.4 | 7.1 | -54.8 | -3.3 |
| VanEck Vectors Brazil Small Cap BRF | Latin Am | 20.1 | -0.9 | -79.0 | -1.2 |
| iShares MSCI Brazil ETF EWZ | Latin Am | 19.9 | -1.3 | -70.7 | -1.7 |
| Miller Opportunity LMOPX | Multi core | 15.5 | 11.7 | -39.8 | -0.1 |
| VanEck Vectors Russia RSX | EM | 17.5 | 1.2 | -61.3 | -2.9 |
| Pacific Advisors Mid Cap Value PAMVX | Mid core | 15.2 | 3.6 | -38.1 | -8.0 |
| Voya Russia LETRX | EM | 14.7 | 4.1 | -53.3 | 0.0 |
| Oberweis China Opportunities OBCHX | China | 14.2 | 7.5 | -42.0 | 2.1 |
| Hodges HDPMX | Small growth | 14.1 | 9.6 | -37.0 | -3.7 |
The worst big fund: Miller Opportunity Trust (LMOPX) with a down-market deviation of 15.5 – exactly the broad market average – and $1.5 billion in assets.
Greatest 10-year bear market deviation
Bear market deviation can be thought of as “the downside in a seriously declining market.” Basically, bear market deviation indicates the typical annualized percentage decline based only on a fund’s performance during bear market months. For equity-oriented funds, a bear market month is one in which the market declined by 3% or more in 30 days.
| Lipper category | Bear market deviation | 10-year annual returns | Worst drawdown | vs peer group | |
| Benchmarks | |||||
| Vanguard Total Stock Market Index VTSMX | Multi core | 7.4 | 13.5 | -17.7 | 1.7 |
| Vanguard Balanced Index VBINX | Growth allocation | 3.9 | 9.6 | 9.0 | 1.0 |
| Schneider Small Cap Value SCMVX | Small value | 15.0 | 5.2 | -44.5 | -5.2 |
| Pacific Advisors Small Cap Value PASMX | Small value | 14.5 | 7.1 | -54.8 | -3.3 |
| Miller Opportunity LMOPX | Multi core | 14.0 | 11.7 | -39.8 | -0.1 |
| Pacific Advisors Mid Cap Value PAMVX | Mid core | 13.5 | 3.6 | -38.1 | -8.0 |
| Oberweis China Opportunities OBCHX | China | 13.2 | 7.5 | -42.0 | 2.1 |
| Invesco Golden Dragon PGJ | China | 13.0 | 5.2 | -44.5 | -5.2 |
| Hodges HDPMX | Small growth | 12.9 | 9.6 | -37.0 | -3.7 |
| Cambiar Global Ultra Focus CAMAX | Global multi value | 12.7 | 9.3 | -39.9 | 2.3 |
| Auer Growth AUERX | Small core | 12.7 | 2.9 | -36.8 | -8.5 |
| Invesco China Small Cap HAD | China | 12.6 | 2.9 | -39.6 | -2.5 |
The worst big fund: Miller Opportunity (LMOPX) again! It has a bear market deviation of 14, nearly twice the broad market’s.
Managers with some serious explaining to do
And if you’re still alive and your money is among the $3 billion entrusted to these folks, you need to be asking some serious questions of yourself, your financial advisor and your fund managers.
These are the funds that simultaneously fit into four bad boxes:
- Worst downside deviation – for 10 years!
- Worst down-market deviation – for 10 years!!
- Worst bear market deviation – for 10 years!!!
- Worst returns (bottom 20%) in the peer group for the past 1, 3- and 5-year periods. We designate those as “Three Alarm” funds.
Just to add a bit of salt to the wound, we’ve also noted their greatest loss over the past decade (called “maximum drawdown”) and we’ve ordered the table by how far they’ve trailed their peers annually over the past 10 years.
| APR | Bear market dev | Down market dev | Downside dev | Max drawdown | vs. peers | Assets | ||
| Benchmarks | ||||||||
| Vanguard Total Stock Market VTSMX | Multi core | 13.5 | 7.4 | 7.8 | 7.9 | -17.7 | +1.7 | $845B |
| Vanguard Balanced Index VBINX | Growth allocation | 9.6 | 3.9 | 4.3 | 4.4 | 9.0 | +1.0 | $43B |
| Nysa NYSAX | Small Growth | -4.7 | 10.9 | 12.5 | 14.9 | -51.7 | -18 | $1.6M |
| Catalyst Small-Cap Insider Buying CTVAX | Small Growth | 3.7 | 12.5 | 14 | 14.7 | -40.1 | -9.6 | 10.3 |
| CGM Focus CGMFX | Multi Value | 2.8 | 11.4 | 12.6 | 14.1 | -42.2 | -8.1 | 472 |
| Pacific Advisors Mid Cap Value PAMVX | Mid Core | 3.6 | 13.5 | 15.2 | 15.6 | -38.1 | -8 | 2.9 |
| TANAKA Growth TGFRX | Multi Core | 6 | 10.9 | 12.2 | 12.7 | -27.1 | -5.9 | 9.7 |
| Mission-Auour Risk-Managed Global Equity OURAX | Global Multi-Core | 2.7 | 10.6 | 11.4 | 12.2 | -39 | -5.8 | 16.9 |
| Pacific Advisors Balanced PAABX | Growth Allocation | 3 | 6.9 | 8.4 | 8.8 | -29.9 | -5.6 | 3.3 |
| Schneider Small Cap Value SCMVX | Small Value | 5.2 | 15 | 16.5 | 17.5 | -44.5 | -5.2 | 28 |
| Hodges HDPMX | Small Growth | 9.6 | 12.9 | 14.1 | 14.5 | -37 | -3.7 | 154 |
| Bridgeway Ultra-Small Company BRUSX | Small Value | 6.8 | 10.7 | 12.1 | 12.9 | -30.9 | -3.6 | 67 |
| CGM Mutual LOMMX | Growth Allocation | 5.1 | 6.8 | 8.4 | 9.2 | -21.2 | -3.6 | 304 |
| Rydex S&P SmallCap 600 Pure Value RYAZX | Small Value | 7.3 | 12.5 | 13.7 | 14.6 | -28.1 | -3.1 | 35.6 |
| RiverFront Asset Allocation Aggressive RLTIX | Aggressive Growth Allocation | 6.7 | 7.7 | 8.6 | 8.9 | -22 | -2.8 | 35.8 |
| AllianzGI Micro Cap AMCIX | Small Growth | 11.1 | 11.5 | 13.2 | 13.8 | -35.4 | -2.1 | 17.3 |
| Arrow DWA Tactical DWTTX | Flexible | 5 | 7.2 | 8.2 | 8.7 | -19.1 | -1.9 | 117 |
| Bridgeway Aggressive Investors 1 BRAGX | Multi Core | 10.3 | 10.8 | 11.5 | 11.7 | -31 | -1.5 | 169 |
| Adams Small Cap Value SCAPX | Small Value | 9.2 | 11.1 | 13 | 14.3 | -40.2 | -1.2 | 14.4 |
| Hotchkis & Wiley Mid-Cap Value HWMIX | Mid Value | 10.3 | 11.1 | 12.5 | 13 | -31.1 | -0.9 | 964 |
| AllianzGI Ultra Micro Cap AUMIX | Small Growth | 12.4 | 11.1 | 12.5 | 13.2 | -31.2 | -0.8 | 16.2 |
| Putnam Capital Spectrum PVSYX | Flexible | 8.9 | 7.5 | 8.2 | 8.7 | -29.7 | 2 | 632 |
| $3071M |
Collectively, these funds have the poorest downside performance over the past decade, and consistently bad 1-, 3-, and 5-year returns. Nineteen of the 20 also trail their peers for the past 10 years.
The biggest dumpster fire?
At $99 billion, American Funds Investment Company of America (AIVSX) is the biggest Three Alarm fund, trailing 80% of its Lipper peers over the past 1-, 3- and 5-year periods. It’s trailed its peers (by 1.1% per year) over the past 10 years to boot. Morningstar awards it “Silver” status but recognizes it’s trailed 75% of its Morningstar peers over the decade.
I’m incredibly saddened to see the two Bridgeway funds (Aggressive Growth and Ultra-Small Company) here. They were once brilliant performers, their design and execution are data-driven and sensible, and their adviser is one of the most principled and admirable firms in the entire industry. They have funds with tremendous upside (since inception, BRUSX is up 1529% while the small-cap index is up just 975%), and tremendous downside; they share the tendency to be either at the very top or at the very bottom of their peer groups. Sticking with the funds now is a pure act of faith.
Two questions about the list as a whole:
-
If they perform so poorly on the downside, why don’t they trail by much more?
AllianzGI Ultra Micro, for example, has double-digit returns and trails in the long-term by just 0.8% a year.
Answer: the past 10 years have been a relentless upmarket. Funds with bad downside performance have not been penalized a lot because there’s been much less downside than upside over the past decade.
-
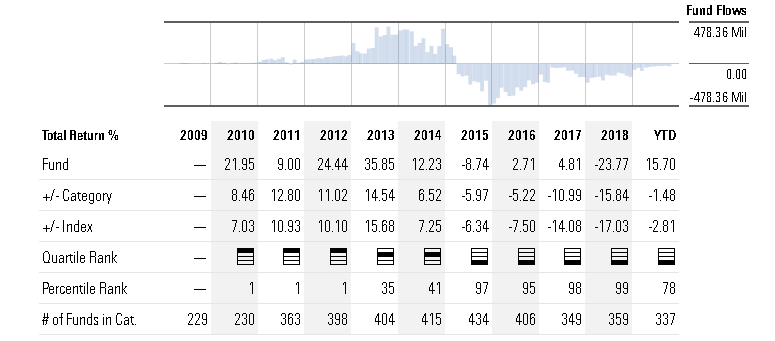
What’s up with Putnam Capital Spectrum? They have a substantial 10-year lead over their peers.
Answer: the five fat years have been followed by the five lean years. Putnam had above-average to top-tier performance through 2014 and money poured in. Starting five years ago, in 2015, they’ve had absolutely bottom-tier performance and money poured out. Here’s the snapshot from Morningstar:
Bottom line:
It’s time. Downside deviation, down market deviation, maximum drawdown and bear market deviation are all tools designed to help you answer three questions:
- How bad can it get?
- Am I ready to suffer that much?
- Do I have to suffer that much?
Our list of Great Owl funds offers alternatives for those who don’t like the answers to 1-3. The Great Owls are funds with consistently excellent risk-adjusted performance, with special emphasis on resilience in down markets. While not all of them might be right for your portfolio, they illustrate the sorts of concerns that we think you should build into every portfolio.