


Introduction
Warren Buffet has a long history of sharing sharp, colorful reflections on inflation and its role in controlling your profits.
Before we drown in a sea of self-congratulation, a further – and crucial – observation must be made. A few years ago, a business whose per-share net worth compounded at 20% annually would have guaranteed its owners a highly successful real investment return. Now such an outcome seems less certain. For the inflation rate, coupled with individual tax rates, will be the ultimate determinant as to whether our internal operating performance produces successful investment results – i.e., a reasonable gain in purchasing power from funds committed – for you as shareholders.
That combination – the inflation rate plus taxes – can be thought of as an “investor’s misery index”. When this index exceeds the rate of return earned on equity by the business, the investor’s purchasing power (real capital) shrinks even though he consumes nothing at all. We have no corporate solution to this problem; high inflation rates will not help us earn higher rates of return on equity. (italics in original, Shareholder Letter, 1979)
He might well have written those words as he munched his Big Mac and Coke, which that year cost $1.34 together.
High rates of inflation create a tax on capital that makes much corporate investment unwise – at least if measured by the criterion of a positive real investment return to owners. This “hurdle rate” – the return on equity that must be achieved by a corporation in order to produce any real return for its individual owners – has increased dramatically in recent years. The average tax-paying investor is now running up a down escalator whose pace has accelerated to the point where his upward progress is nil. (Shareholder Letter, 1980).
His example was roughly, if inflation is 12% and the short-term capital gains rate is 37% (the 2022 rates), any company with a return on equity below 16.5% – a high standard – is losing money for their investors.
… our views regarding long-term inflationary trends are as negative as ever. Like virginity, a stable price level seems capable of maintenance, but not of restoration.
Despite the overriding importance of inflation in the investment equation, we will not punish you further with another full recital of our views; inflation itself will be punishment enough. (Shareholder Letter, 1981)
A further, particularly ironic, punishment is inflicted by an inflationary environment upon the owners of the “bad” business. To continue operating in its present mode, such a low-return business usually must retain much of its earnings – no matter what penalty such a policy produces for shareholders. Reason, of course, would prescribe just the opposite policy.
But inflation takes us through the looking glass into the upside-down world of Alice in Wonderland. When prices continuously rise, the “bad” business must retain every nickel that it can. Not because it is attractive as a repository for equity capital, but precisely because it is so unattractive, the low-return business must follow a high retention policy. If it wishes to continue operating in the future as it has in the past – and most entities, including businesses, do – it simply has no choice.
For inflation acts as a gigantic corporate tapeworm. (Shareholder Letter, 1981)
Two years later, he was “as pessimistic as ever on that front” (1983). That year’s inflation rate – 3.2%, though at the time of his letter he feared it would be closer to 4.4% – is lower than what we yet face today, about 4.9%.
Tapeworms, virgins, escalators, and burgers, oh my! What’s a prudent investor to do?
In this article, I’ve tried to go deeper into some of Warren Buffet’s recent comments with charts and data. I’ve tried to connect some of his history lessons from around World War II, the current market environment, and how that explains some of Berkshire’s market positions. Finally, if one is not to use this as a short-term timing message, thinking about his insights has helped me accept why holding stocks may be okay despite the pessimism from sharp market minds.
Background: a timely but uncharacteristic mention
Warren Buffett writes an annual letter to the shareholders of Berkshire Hathaway. This letter usually arrives in February, a few months before the annual shareholder meeting, in May, and is a good place to peg Warren Buffett’s and Charlie Munger’s views on investing, markets, and the economy at large. As an investor in Berkshire, I look forward to both the annual letter and the meeting.
When the 2022 Letter was released this year on the 25th of February, there was an uncharacteristic mention on runaway inflation. Specifically, Buffett wrote, “Berkshire also offers some modest protection from runaway inflation, but this attribute is far from perfect. Huge and entrenched fiscal deficits have consequences.”
Charlie Munger has been outspoken about the government-led giveaway during the pandemic. In the past, Buffett had always defended fiscal spending as needed because no one knew how bad the alternative could be. That tune changed with this year’s letter and meeting.
Runaway inflation is not a term to be used lightly, and I was puzzled by how someone so careful with his words as Buffett would include that term in his letter. I had wished for some more light on this during the annual meeting. He did not disappoint.
Public Debt to GDP: WW 2 and Today
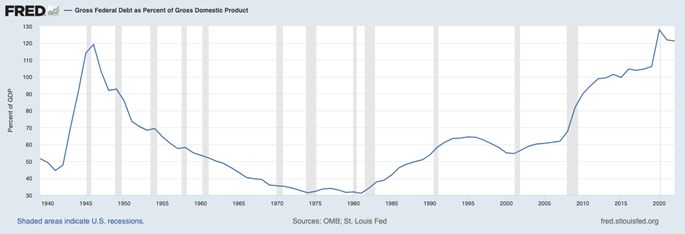
At various points in the Q&A, Buffett brought up the similarity of US debt around WWII and the present time. The picture below shows Gross Public Debt as % of GDP. We are remarkably at the same level of debt to GDP as we were back then – at around 120%. Economists tell us why large and sustained public deficits are not too healthy. Funding those deficits crowds out other investments. As Interest rates rise, investors feel safer in 5% fixed income. Who needs to risk money in an always nerve-wracking stock market?!
War Savings Bonds
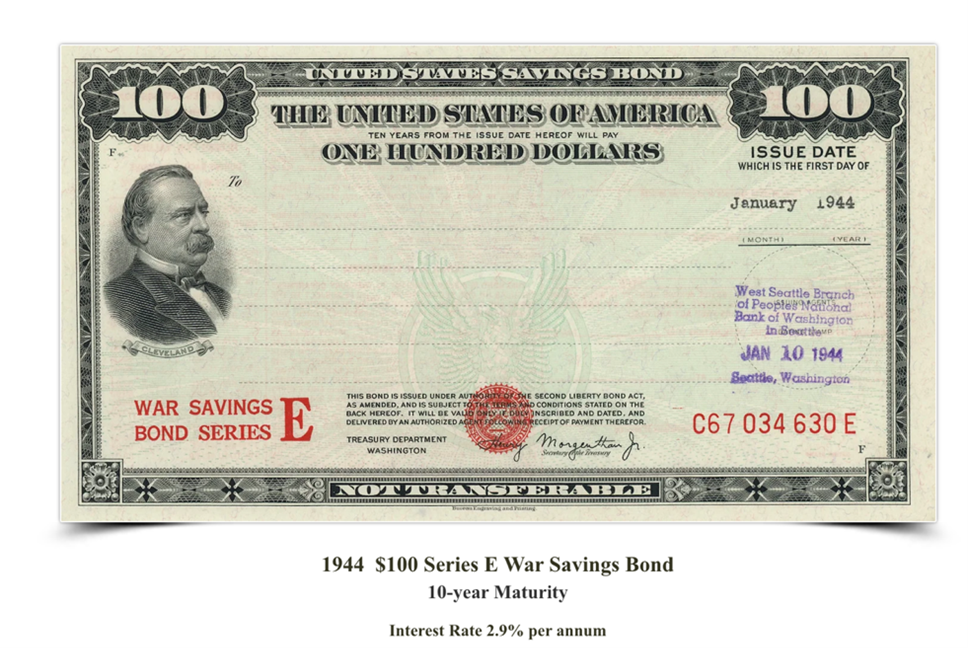
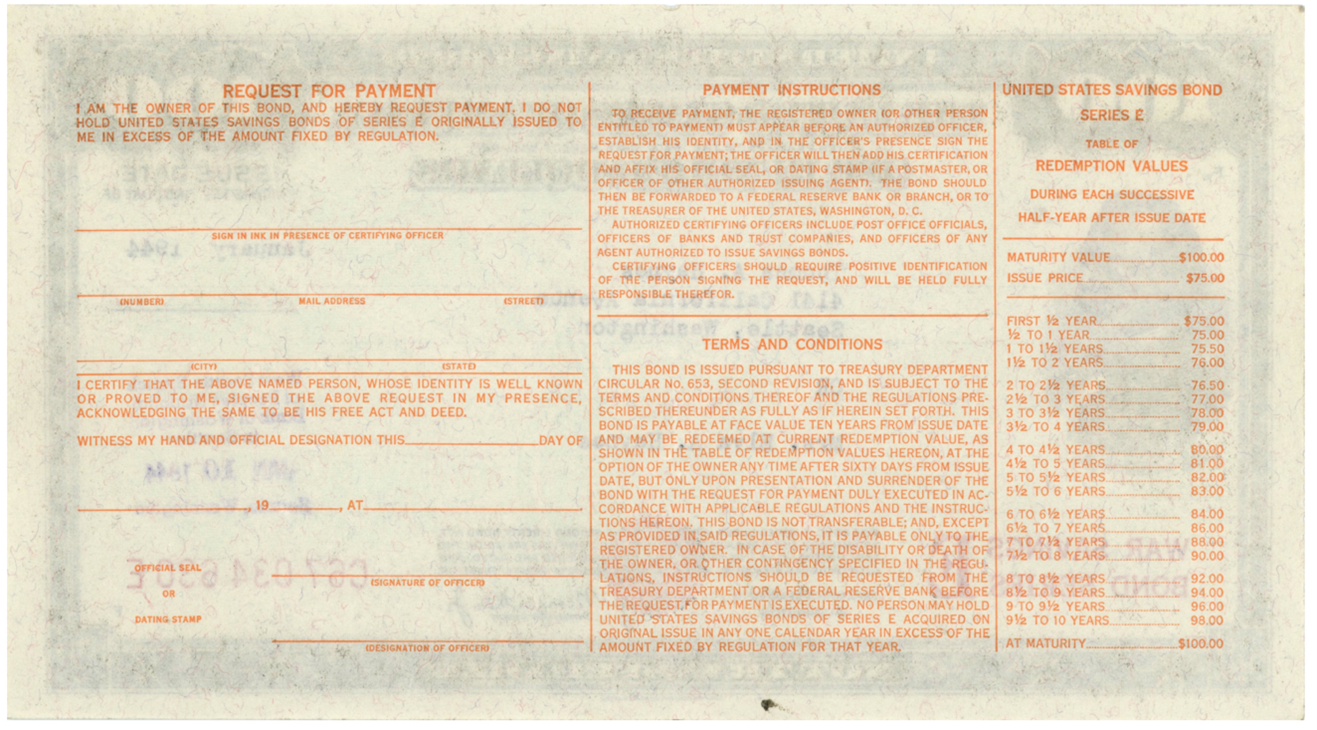
To fund WWII spending, the US federal government needed a lot of money. War Savings bonds was one of the answers. The Joe I. Herbstman Memorial Collection of American Finance has good information on Savings Bonds from 1941 to 2007, along with some history. These bonds were forefathers to our present day Series EE savings bonds. According to the website, “Known originally as Defense Bonds and War Savings Bonds, these securities helped raise some $185 billion for WWII alone. Six million volunteers helped to sell some one billion individual securities for the war effort.” The 1944 War Savings bond apparently had a 10-year Yield to maturity of 2.92% annualized.
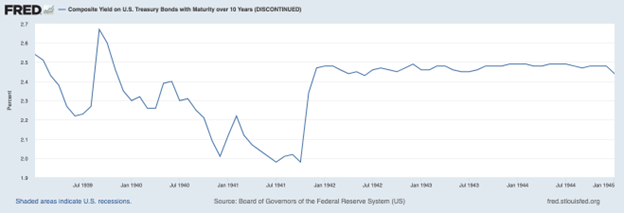
To compare the yield on these bonds, it would help to look at the yield available on 10-year US Treasury Bonds in the early 1940s. Buffett mentioned that he (just 11 years old at the time of the Pearl Harbor attack), many of his young friends (nerd alert!), and a whole lot of other investors rushed to buy War Savings Bonds, mostly because of the incessant calls from Donald Duck and war widows to support our boys and defend freedom, but also because the 2.92% yield from the War Savings Bonds looked attractive compared to what was available elsewhere.
Is there a parallel today?
WSJ reporter Lori Ioannau in an article dated May 6th, 2023, “What Investors Should Know About Money-Market Funds and CDs,” reports:
- About $488 billion has poured into money-market mutual funds this year through April 27, according to Crane Data. These funds now hold a record $5.687 trillion in assets, up from $4.941 trillion a year ago.
- Balances in CDs skyrocketed to about $577 billion in March from $36.6 billion in April 2022, according to the Federal Reserve.
For the first time in almost 15 years, investors are getting over 5% in CDs and money-market instruments. The last time around, in 2007, was God’s gift to those who bought and saved themselves from the Great Financial Crisis. It looks like investors are not going to miss the opportunity this time.
What bond investors got wrong with WWII bonds then and what could go wrong now: Inflation
In the years that followed in the 1940s, observed inflation was much higher than investors expected. This higher inflation eroded the value of money. US Consumer Price Index clocked 18% in 1947, 8.8% in 1947, 5.9% in 1950, and 4.3% in 1951. The CAGR for inflation from the start of 1944 to the end of 1955 was about 4%, or a full point more than the attractive yield in War bonds.
US Consumer Price Index Table (as inferred from Y-Charts).
| 1941 | 9.93% | 1948 | 1.69% |
| 1942 | 7.64% | 1949 | -2.07% |
| 1943 | 2.96% | 1950 | 5.93% |
| 1944 | 2.30% | 1951 | 4.33% |
| 1945 | 2.25% | 1952 | 0.75% |
| 1946 | 18.13% | 1953 | 1.13% |
| 1947 | 8.84% | 1954 | -0.74% |
(*I’ve used the US Consumer Price Index (I:USCPINM) ticker from Y-Charts. A spot check to FRED Data shows the series is in the right ballpark.)
This brings us to recent Inflation:
| 2019 | 2.3% |
| 2020 | 1.4% |
| 2021 | 7.1% |
| 2023 | 6.4% |
Buffett believes that Jay Powell, the Federal Reserve Chair, is absolutely the right man for the job, and he completely gets the inflation situation. Yet, he fears the level of national debt and public deficit and the related consequences have become very real. The inflation monster might just be very difficult to slay. Unlike WWII Savings Bonds and his quick attraction to the higher yield, this time, Buffett wants to be careful. So, what is he doing?
-
T-Bills: Berkshire holds $125 Billion in Treasury Bills, that is, US Government Debt less than one year in maturity. Others call this “dry powder.”
Rolling short-term Treasury Bills allows Berkshire to accomplish a few things:
- Earn 5% annualized yields with negligible risk;
- Have the resources to move decisively to exploit a market panic; and,
- Earn even higher yield if the Federal Reserve is forced to raise rates further.
When asked why he doesn’t hold longer-duration bonds, he replied that he is not good at predicting the future path of long-term interest rates, and he doesn’t know anyone who is good at it either. Take those words seriously.
Perhaps, he is unwilling to commit to long-dated fixed coupon bonds because he doesn’t see enough value in them. With T-Bills, he is happily earning $6 billion a year on the $125 Billion pile at a 5% rate. Perhaps, he is also unwilling to invest in TIPS, given their illiquidity, despite their inflation protection characteristic. When he needs the money, with T-Bills, he can have the money.
-
The Largest Shareholder’s Equity of any American Company:
Buffett likes to remind investors that Berkshire’s Shareholders’ Equity is the largest of any American company.
As of Q1 2023, Berkshire has Assets of $997 Billion vs $480 Billion in Liabilities. The Total Shareholder’s Equity of $517 Billion. The table from Y-charts and while the numbers may be slightly different, the sizes are relatively recent and mostly in the right ballpark.
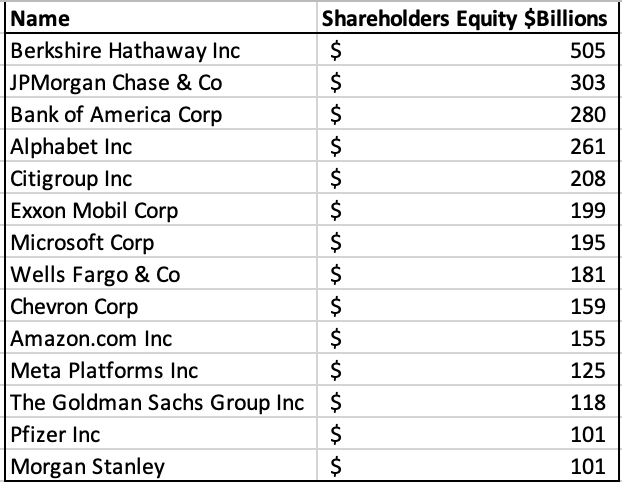
Berkshire owns more net assets, including physical assets – assets that can revalue higher in a high inflation environment – than any other US corporation. Through energy investments, through railroad infrastructure, through direct private holdings of companies, and through indirect investment in publicly listed companies, Berkshire is positioned for a relative loss of purchasing power of money and a corresponding increase in real world assets. This is “far from a perfect hedge,” but a hedge nevertheless against runaway inflation.
On one end, Berkshire has highly liquid T-Bills, which, at $125 Billion, stand at around 25% of Berkshire’s Shareholder’s equity. On the other end, Berkshire owns $388 Billion of Net Assets biased towards public and private equity holdings. It’s a rough approximation, but we can call it 75%. (I am oversimplifying the Balance sheet.) What did Buffett learn from the 1940s that he thinks applied now?
How did equities do in the 1940s and 1950s too?
The annualized return on stocks was 10.2% on the Dow Jones Industrials in the years from the start of 1944 to the end of 1954. During the same time, public debt went from 120% of GDP to 70%, War Savings Bonds yielded 2.92%, and inflation clocked at an average 3.9%.
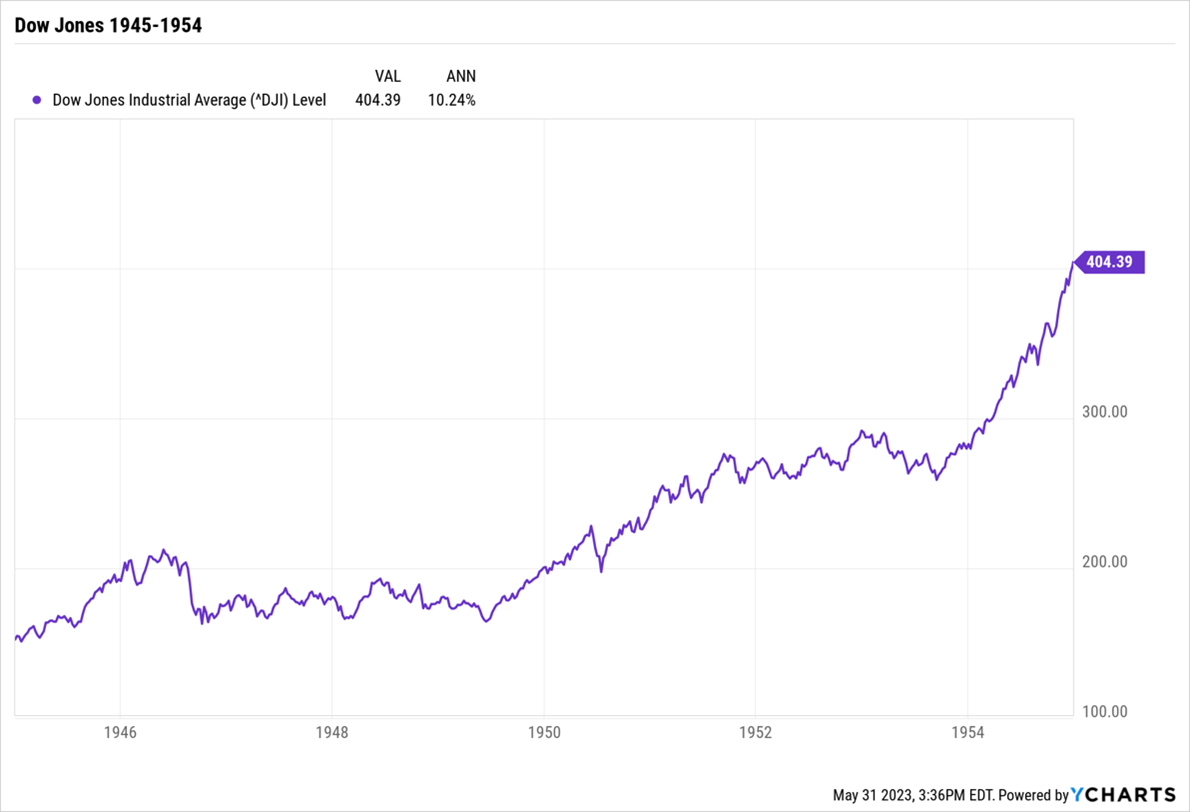
High deficits to GDP and high inflation would certainly have created the same kind of bearish mindset as many investors find it fashionable to sport right now. But runaway inflation might also be a fertile ground for a grudging equity tape higher as the value of money erodes.
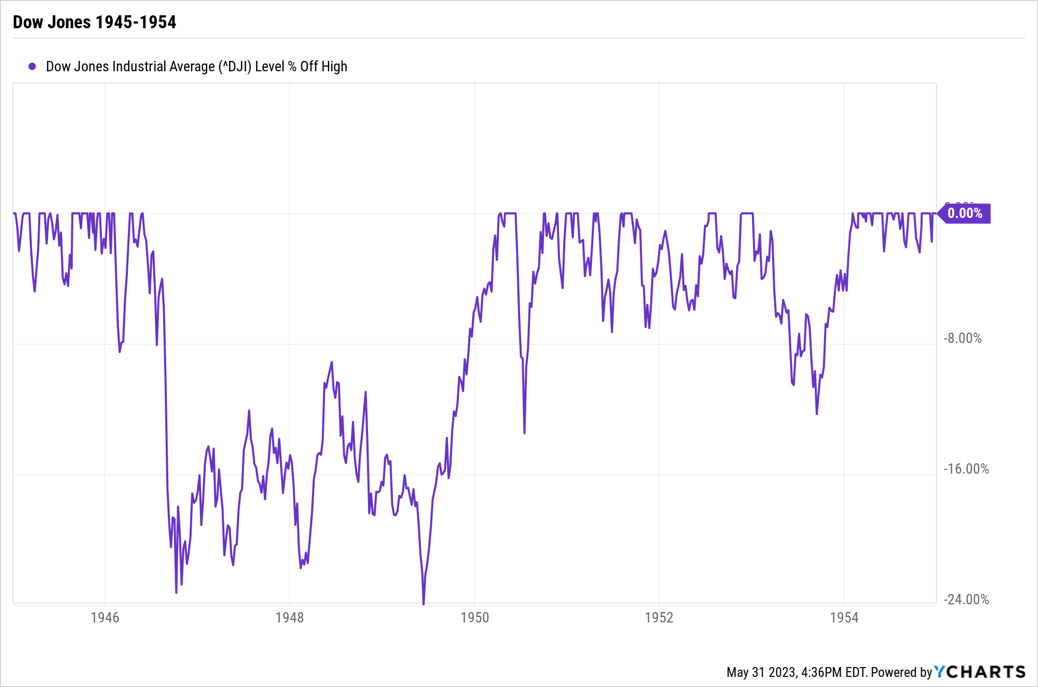
This is not a market-timing call. As the chart shows, equities tred water from 1946 to 1949.
They also went through a 24% bear market. There are no easy answers.
Equities today
We all know the story. Stocks presently have a bad breadth problem. NVIDIA, Microsoft, and a handful of other large technology companies with a focus on Artificial Intelligence have risen tremendously while the rest of the stock market has not. Not a single day goes by without some pundit expanding on how “if only someone were to tell you XYZ, would you still think the stock market would be up here?”
I get it. There’s certainly a nice little mini bubble in stocks focused on AI. But if bad breadth in the stock market bothers investors, they need to acquaint themselves with this 2018 research paper: “Do Stocks Outperform Treasury Bills.”
Professor Hendrik Bessembinder, the author, summarizes in the Abstract: When stated in terms of lifetime dollar wealth creation, the best-performing four percent of listed companies explain the net gain for the entire U.S. stock market since 1926, as other stocks collectively matched Treasury bills.
Bad breadth, apparently, is a feature of US stock returns. Equity returns are formed not because the world is a fair place but precisely because it’s an unfair place with monopolistic or oligopolistic pricing. Maybe the rising tide lifts a few boats much higher than other boats.
Conclusion
When all is done and dusted, stocks might still offer modest protection against inflation. As the world clamors for CDs, be careful not to lean too hard against stocks on a permanent basis.
There is a chance we may not see a repeat of the Great Financial Crisis.
We may need to revalue stocks higher as money gets slowly (sometimes not so slowly) devalued. Just be open to the possibility that maybe the next crash might not be as big as what the purists would like. Maybe stocks do win in the long run. Traders are on their own, but longer-term investors might be okay through inflation.
For readers who want a really readable examination of the performances of both equity and fixed-income in different inflation regimes – from deflation to “severe” inflation – from 1900 to 2010, there are few snapshots better than “Inflation and the US Stock and Bond Market” (2011) from O’Shaughnessy Asset Management. While the essay is more than a decade old, we haven’t seen a serious inflation threat – other than the cycle we’re just in – since its publication. Bottom line: Devesh and Warren are right. You’ll be okay.