


The Chronology of the Economic Cycle provided by Joseph Ellis in Ahead of the Curve is an interesting chart that shows the ripple effect from left to right of inflation and interest rate increases across the economy over the next six to twenty-seven months. In Figure #1, I added my subjective assessment of whether the indicator level is currently positive (blue +) or negative (red -) for the Investment Environment and the direction of change, whether it is improving (red up arrow) or softening (red down arrow). Most of the indicators are softening, but not at a level to be considered negative (contracting) for the Investment Environment, in my opinion.
Figure #1: Chronology of the Economic Cycle from Ahead of the Curve
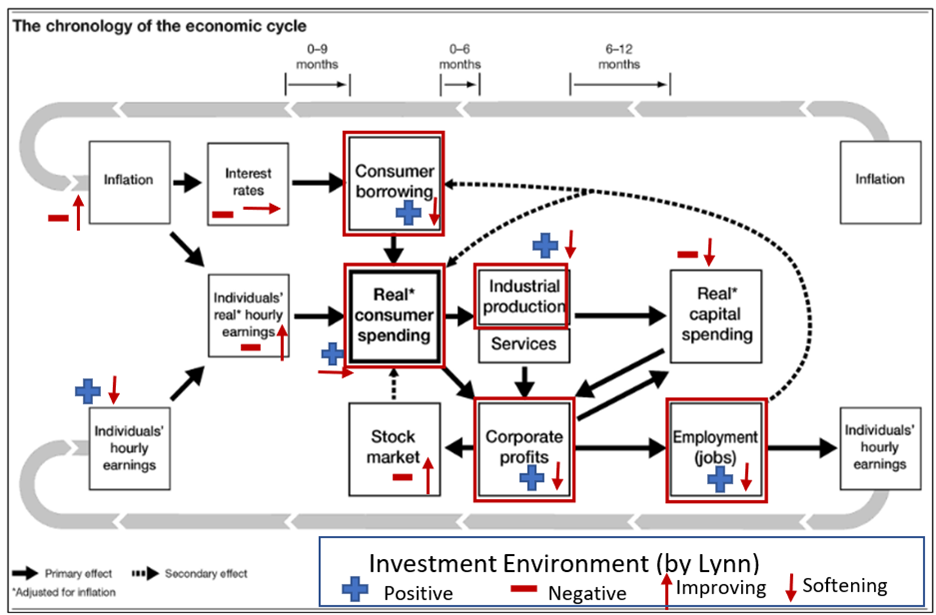
Source: Ahead of the Curve by Joseph Ellis
The Conference Board produces a Leading Economic Index, which “provides an early indication of significant turning points in the business cycle and where the economy is heading in the near term.” The assessment from Justyna Zabinska-La Monica, Senior Manager of Business Cycle Indicators at The Conference Board is:
“The LEI for the US declined for the thirteenth consecutive month in April, signaling a worsening economic outlook. Weaknesses among underlying components were widespread… Importantly, the LEI continues to warn of an economic downturn this year. The Conference Board forecasts a contraction of economic activity starting in Q2 leading to a mild recession by mid-2023.”
In other words, The Conference Board believes that the data for the quarter just ending will come in weak enough to signal that a recession is beginning in the middle of this year.
I built my Investment Model (Figure #2) around the concepts in this book, among others. I use one hundred and twenty-eight sub-indicators composited into thirty-four main indicators, which do not exactly align with those of Mr. Ellis. I include indicators not shown in the chronology of the business cycle by Mr. Ellis for Banking, Monetary Policy, Financial Risk, and Valuations, among others. The goal of the Investment Model is to maximize risk-adjusted returns, which reduces “Sequence of Return” risks due to high drawdowns. The Model currently suggests about thirty-five percent allocated to stocks, thirty percent allocated to short-term cash equivalent investments, thirty percent allocated to bonds, and five percent allocated to defensive investments such as gold.
Figure #2: Allocation View of the Author’s Investment Model
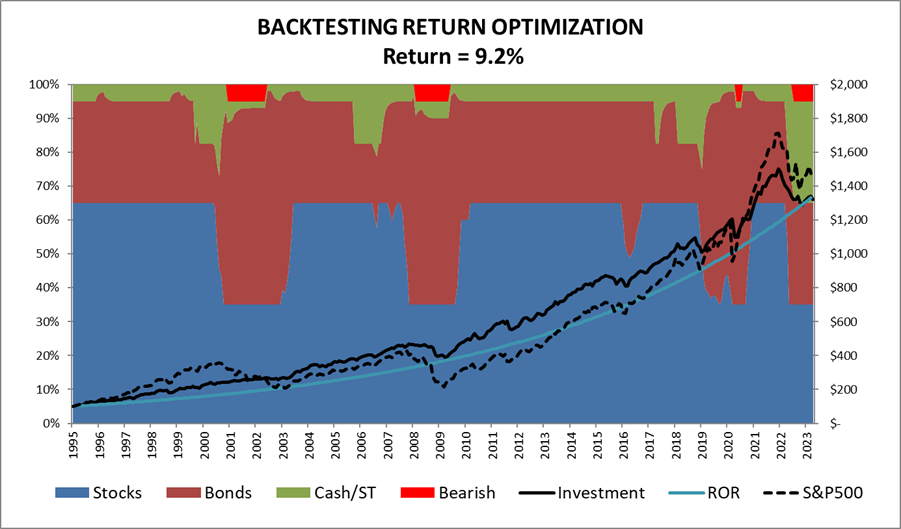
Source: Author
I have selected five of my indicators to discuss which are close to those covered by the red squares representing Consumer Borrowing, Real Consumer Spending, Industrial Production, Corporate Profits, and Employment (Jobs). They are arranged starting with the shortest lag time (Consumer Borrowing/Health) to the longest (Employment). I roll up the Chronology into a single “Declining” Indicator which is based on the percent of the months over that past year that are negative. The last section is about the risk of a recession occurring.
Real Gross Domestic Product
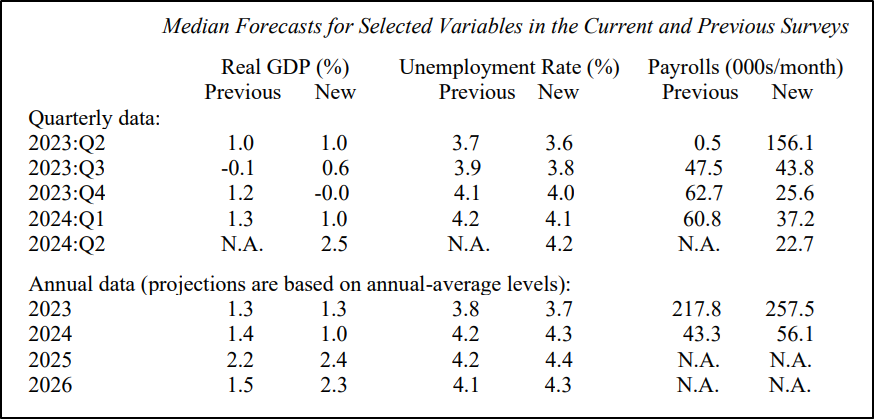
Before we look at the indicators, let’s take a look at the economy through the lens of the Federal Reserve as provided by the Philadelphia Federal Reserve Survey of Professional Forecasters for the second quarter. Like The Conference Board, the Philadelphia Federal Reserve Survey estimates a significant slowdown in growth (Real GDP) in 2023 with GDP growth being nearly zero in the third and fourth quarters. This suggests a mild recession. The economists also estimate that the probability of a negative quarter for each of the quarters in 2023 to be between 39% to 45%. In addition, the New York Federal Reserve estimates that there is a 68% probability of a recession by April 2024 based on the yield curve.
Table #1: Median Forecasts for Real GDP, Unemployment, and Payrolls
Consumer Borrowing
The average consumer can only continue to spend if they have the income or savings to pay for this spending or the ability to borrow money. Figure #3 is my composite Consumer Health Indicator which attempts to measure the consumer’s ability to keep spending. The cost of borrowing has risen, consumers are becoming delinquent on payments, and banks are tightening their lending standards. I believe that the Consumer’s ability to keep spending is negative at the moment. This indicator does not take into account that pandemic-era savings are being depleted nor that student loan payments that were suspended during the pandemic will be resuming.
Figure #3: Consumer Health
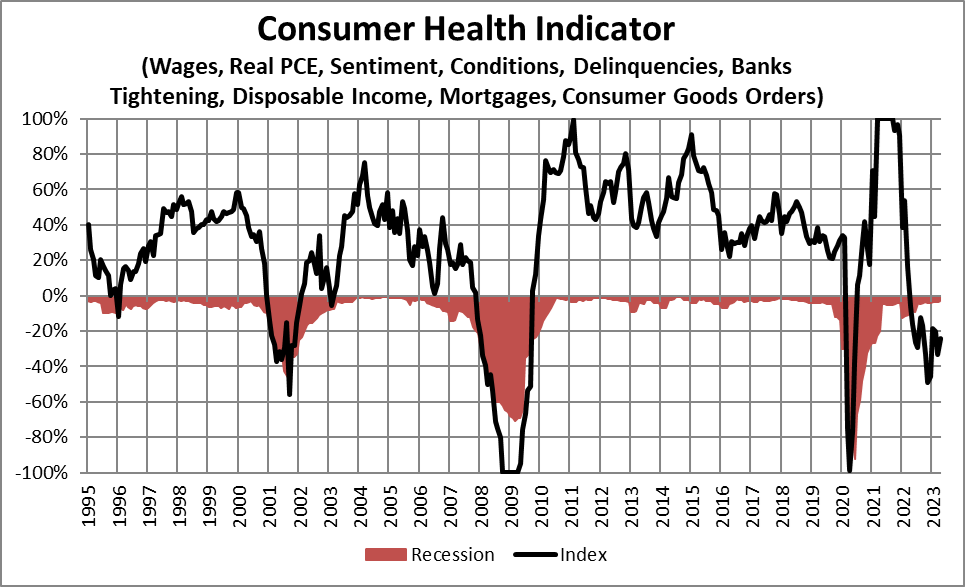
Source: Author Using St. Louis Federal Reserve FRED Database
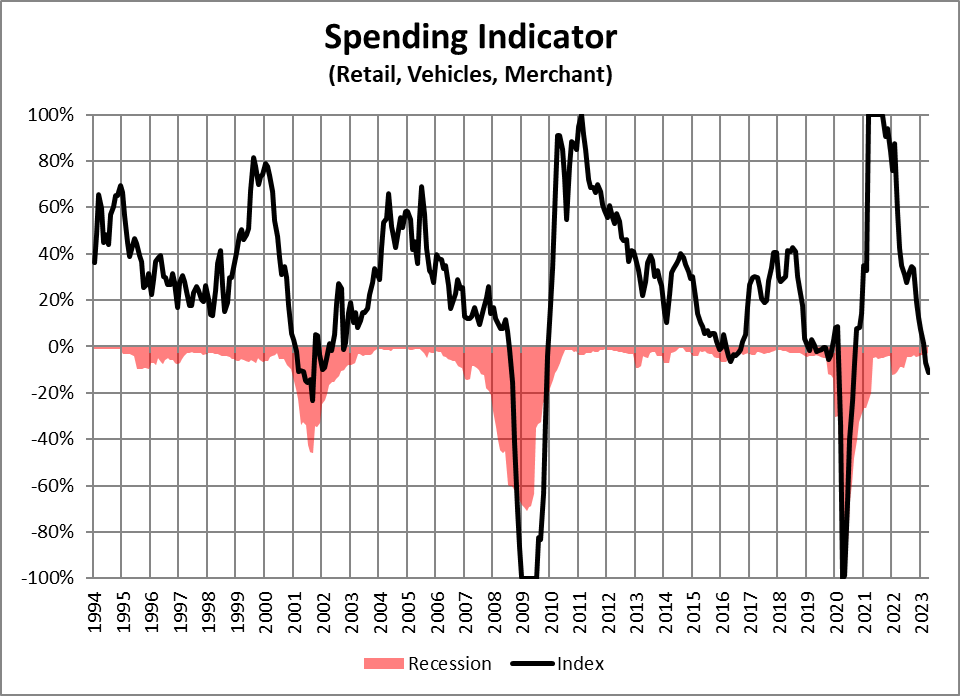
Real Consumer Spending
If the consumer is getting stretched, we would expect to see a decline in the real growth rate of consumer spending as we indeed are, as shown in Figure #4. Real Retail Sales (adjusted for inflation) have been flat since March 2021. Retail sales are not keeping up with inflation. I include Real Personal Consumption Expenditures with a separate GDP Indicator. I consider Real Consumer Spending to be slightly negative and softening.
Figure #4: Real Retail Spending
Source: Author Using St. Louis Federal Reserve FRED Database
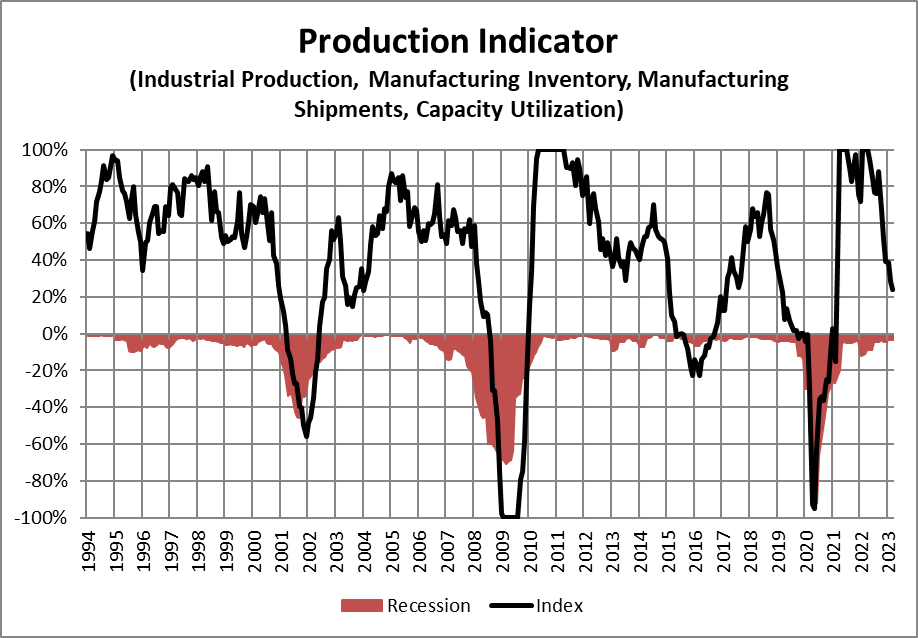
Industrial Production
My Production Indicator includes industrial production, inventories, shipments, and capacity. It should be no surprise that production is softening. Orders, as a separate indicator, are a leading indicator of production, and they have deteriorated more rapidly than production, as you would expect, as the economy slows.
Figure #5: Industrial Production
Source: Author Using St. Louis Federal Reserve FRED Database
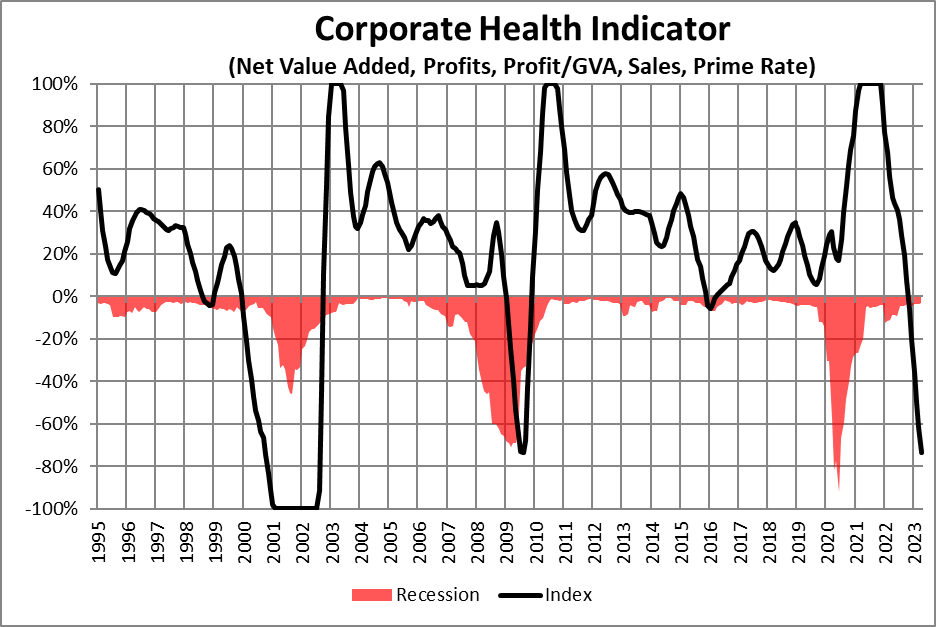
Corporate Profits
In the Berkshire Hathaway annual meeting in May, Warren Buffett said that many of its businesses have an inventory build-up that will have to be reduced by sales, according to Yun Li at CNBC. Mr. Buffett says that “the majority of our businesses will actually report lower earnings this year than last year.” Giulia Carbonaro reported in Newsweek that Berkshire Hathaway sold $13 billion worth of stock. Mr. Buffett believes that “With economic uncertainty and earnings pressures, the time is right for investors to have increased Treasury exposure.”
According to Farah Elbahrawy at Bloomberg, first-quarter profits of S&P 500 companies have fallen for the second quarter and are estimated to have dropped 3.7% compared to a year ago. Ms. Elbahrawy says that a “slowing economy is exerting a toll on profit margin.” In addition to lower profits, bankruptcies are on the rise. According to S&P Global Market Intelligence, there have been 236 corporate bankruptcy filings year to date, which is the highest since 2010. These are concentrated in consumer discretionary, industrial, financial, and healthcare sectors. According to Jennifer Sor at Markets Insider, Bank of America says that corporations may default on $1T in debt in the event of a recession and credit tightening.
My Corporate Health Indicator includes measures of profit, productivity, sales, and the prime rate. I estimate Corporate Health to be negative and worsening rapidly.
Figure #6: Corporate Health
Source: Author Using St. Louis Federal Reserve FRED Database
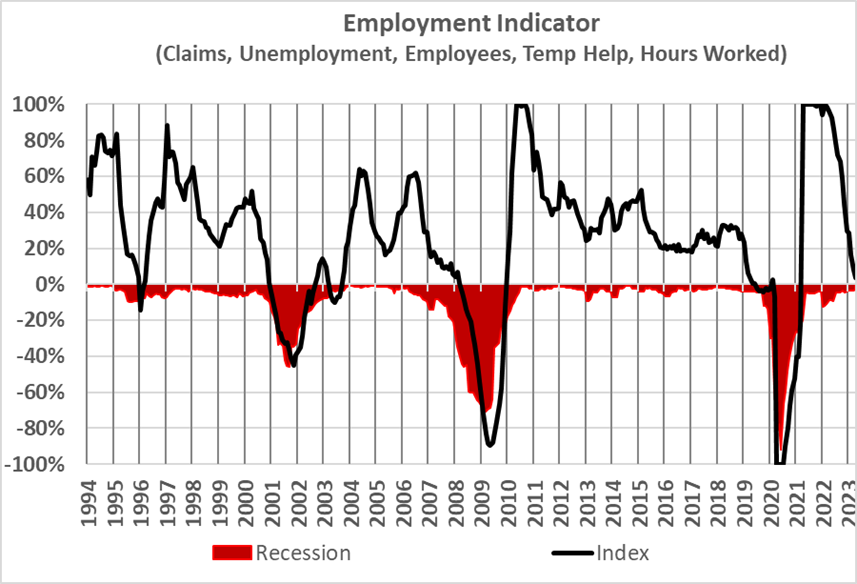
Employment (Jobs)
Year-over-year employment growth has slowed from 5% in the first quarter of 2022 to 1.8% in the first quarter of this year. “Layoffs and Discharges” have almost returned to pre-pandemic levels. Challenger, Gray & Christmas reports that employers have announced plans to cut 337,411 jobs this year, which is an increase of 322% compared to the first four months of 2022.
My Employment Indicator, shown in Figure #7, measures only whether people can find employment, not considering the quality of the work. Temporary Help Services often serves as the canary in the coal mine, giving advance warning of declining labor conditions and working hours being reduced. I estimate that employment has softened almost to the point of being a negative for the Investment Environment.
Figure #7: Employment
Source: Author Using St. Louis Federal Reserve FRED Database
Chronology of the Economic Cycle Rolled into One
The Declining Indicator is calculated differently than most of my other indicators. It is based on the percent of the months during the past year that indicators had negative growth. Collectively, the indicators have peaked, and the decline in the economy is broad based. Matthew Fox at Market Insider provides a deeper dive into indicators in “These 7 Charts Show That a Recession Could Hit The US Economy In The Next Few Months”.
Figure #8: Declining Indicator
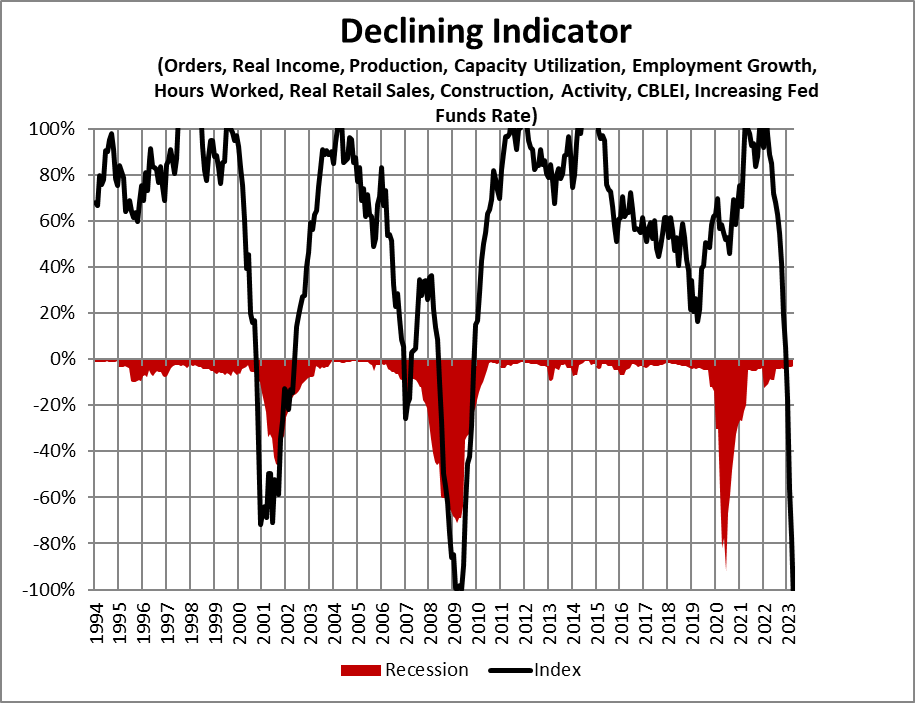
Source: Author Using St. Louis Federal Reserve FRED Database
Buckle Up for a Recession
Money supply is contracting to control inflation which will likely result in higher unemployment and lower borrowing and consumer spending. Credit bubbles tend to have hidden consequences that are not known until the tide goes out. In addition to a probable recession, there is a trilogy of problems, including banking failures, a debt ceiling debacle, and high government net interest costs. Kelly Evans at CNBC warns that the debt ceiling is just “Act One,” and the next issue is likely to be austerity over high government net interest costs, which are now approaching fourteen percent of tax revenues. The consequences of austerity would likely be a headwind to economic growth for years to come.
PIMCO writes in this Seeking Alpha article that their base case is a recession in the US later this year, with the Federal Reserve pausing rate hikes. They are cautious because earnings expectations appear too high. They are underweight equities and “prefer to add high-quality duration at attractive levels, especially during sell-offs if inflation fears resurface”.
Figure #9 is my Recession Indicator. The New York Federal Reserve estimates that there is a 68% probability of a recession (black line) by April 2024, while the timely Chauvet-Piger Smoothed U.S. Recession Probabilities (blue line) estimates the current probability of a recession to be negligible. My own recession indicator (green line), which is intended to be a leading indicator of the Chauvet-Piger Smoothed U.S. Recession Probability Model, estimates the near-term probability of a recession to be 50%, but if the current trends continue, it rises to over 60% by the end of this year.
Figure #9: Recession Probabilities
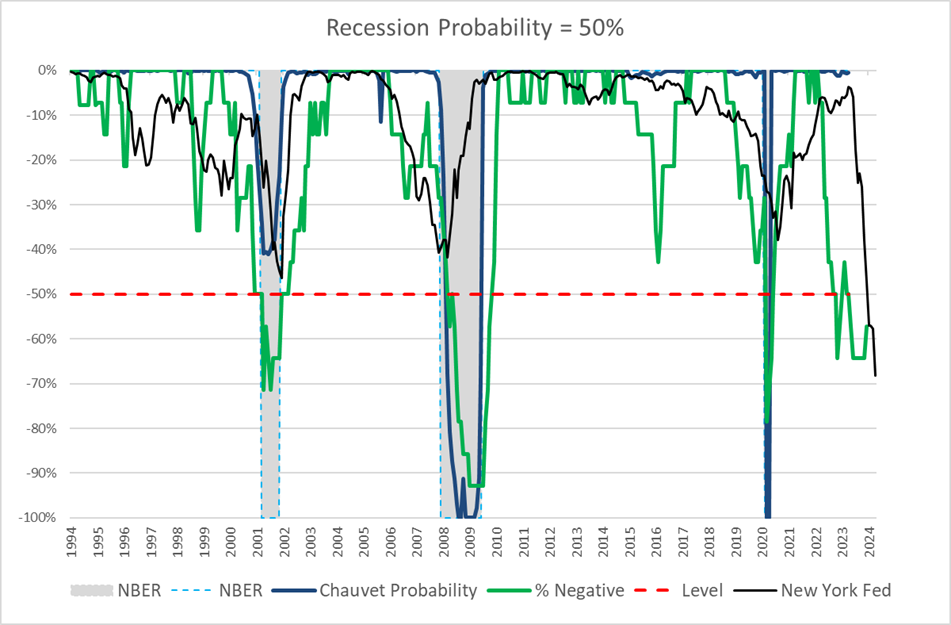
Source: Author Using St. Louis Federal Reserve FRED Database
Closing Thoughts
On May 24th, Fitch Ratings Agency placed the United States’ AAA credit on “ratings watch negative” over the debt ceiling, according to Stephen Groves at Associated Press. Debt ceiling negotiations are progressing. Time is running short to meet the extended June 5th X-Date deadline. At the time of this writing, the stock market has been relatively stable, but Treasury yields have been rising, which provides opportunities to invest in bonds.
My strategy is to be overweight in quality bonds, certificates of deposit, and money markets, and underweight stocks, but still maintain a balanced, diversified portfolio. High yields are providing an incentive to increase allocations to quality bonds. As short-term ladders of Treasuries and Certificates of Deposits mature, I make small decisions to reinvest in bonds with longer durations or in the stock market. At the moment, I see opportunities in Treasuries and Agency bonds with durations of two years or less and Certificates of Deposits and Municipal bonds with durations of five years or less.
In May, I continued to add a small amount to the Columbia Thermostat Fund (Fact Sheet), which increases its allocation to stocks as the market falls. I also bought a modest amount of iShares Gold Trust (IAU) for diversification.
Best wishes during these uncertain times.