


Our new Constitution is now established, and has an appearance that promises permanency; but in this world nothing can be said to be certain, except death and taxes.
— Benjamin Franklin, in a letter to Jean-Baptiste Le Roy, 1789
I read Tax the Rich!: How Lies, Loopholes, and Lobbyists Make the Rich Even Richer by Morris Pearl and Erica Payne at the Patriot Millionaires. They are a group of over 200 “high net worth individuals with annual incomes over $1 million and/or assets over $5 million who are committed to raising the minimum wage, combatting the influence of big money in politics, and advancing a progressive tax structure.” They believe that the tax system should be reformed so that the rich pay their fair share of taxes. Are the Patriotic Millionaires correct?
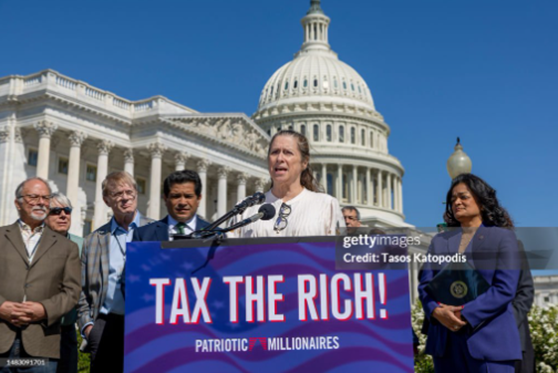
Source: Getty Images, Tasos Katopodis
This article is divided into the following sections:
- Section 1, Media Bias
- Section 2, Patriotic Millionaires
- Section 3, Composition of Federal Taxes
- Section 4, Inequality
- Section 5, Wealth Versus Income
- Section 6, Tax Distribution
- Section 7, Tax Reform
Media Bias
Taxes are an emotionally and politically charged topic and misinformation is abundant. Media Bias / Fact Check is “dedicated to educating the public on media bias and deceptive news practices.” Their methodology rates sources based on Bias, Factual Reporting, and Credibility Rating. The Patriotic Millionaires is rated Left-Center with High Factual Reporting and High Credibility. In this article, I choose media sources that are rated by Media Bias / Fact Check as High Factual Reporting and High Credibility to evaluate the impact of taxes across the wealth groups.
“Tax The Rich!” has an interesting chapter on ten “lies” that the authors perceive as misinformation. Lie #6 is about rich people’s charity for which they provide some facts:
The twenty richest Americans donated about $8.7 billion to charity in 2018 – less than 1% of their net worth. Take away Bill Gates and Warren Buffet, the most generous of the top twenty, and the other eighteen ended up giving just $2.8 billion, or 0.32% of their total net worth. That’s less than the national average – 0.33% of household worth.
Patriotic Millionaires
United Press International published Hundreds of Millionaires, Billionaires Urge Politicians at Davos to Tax Their Wealth describing 268 millionaires and billionaires from seventeen countries that urged world leaders at The World Economic Forum to tax their wealth. Their letter stated that the reasons they thought they should pay more in taxes were:
- Proud to pay more to tackle extreme inequality.
- Proud to pay more to help reduce the cost of living for working people.
- Proud to pay more to better educate the next generation.
- Proud to pay more for resilient healthcare systems.
- Proud to pay more for better infrastructure.
- Proud to pay more for a green transition.
- Proud to pay more taxes on our extreme wealth.
Patriotic Millionaires was one of the organizations supporting the letter. The article describes a survey conducted by Survation on behalf of Patriotic Millionaires, which polled over 2,300 respondents from G20 countries who hold more than one million dollars of investable assets. It found that 74% of millionaires support higher taxes on wealth to help address the cost-of-living crisis and improve public services.
Some of the ways the authors of “Tax the Rich!” describe the tax system favoring the rich are:
- Carried Interest: “The Billionaires’ Loophole”
- The Estate Tax: How We Created an American Aristocracy (Between 35% and 45% of all wealth in America is inherited.)
- Sidestepping Taxes: The Stepped-Up Basis (80% of the benefit goes to the Top 0.1% of households.)
- Annuity Trusts: Don’t Trust This System
- Let’s Play Switch and Swap: The 1031 Like-Kind Exchange
- Help the Rich by Pretending to Help the Poor: Opportunity (for Rich People) Zones
- Just Passing Through: The Pass-Through Deduction (A NBER “paper suggests that nearly 75% of all pass-through income is really just normal personal income funneled through a shell business…” “85% of the “the pass-through income goes to the top 20% of taxpayers, and more than 50% goes to the top 1%”).
Composition of Federal Taxes
The following chart is from Who Pays, and Doesn’t Pay, Federal Income Taxes in the U.S.? by the Pew Research Center which shows that over the past forty years individual income, Social Security, and Medicare taxes have increased while corporate and excise taxes have declined as a share of Federal taxes.
Figure 1#: Source: Changing Composition of Federal Tax Sources
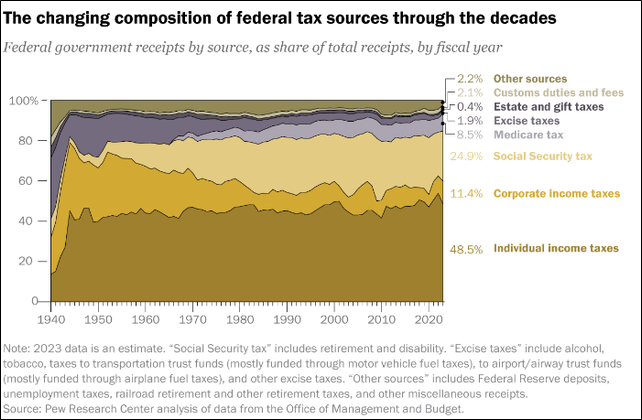
Source: Pew Research Center: Office of Management and Budget
Inequality
According to the St. Louis Federal Reserve FRED website, the wealthiest 0.1% of households (approximately 131,000) own $19.7 trillion dollars (13.8% of total household net wealth) compared to $9.3 trillion (6.5% of total household net wealth) for the bottom 50% of households (approximately 65,000,000). The net worth of those in the Forbes 400 List is $4.5 trillion or over 3% of all household net wealth in America. The net worth of the richest 20 in the Forbes 400 list is $1.9 trillion or 1.3% of the total household net wealth in America.
According to 6 Facts About Economic Inequality in the U.S. by the Pew Research Center income inequality in the U.S. is the highest of all the G7 nations and the wealth gap between America’s richest and poorer families more than doubled from 1989 to 2016.
American Perceptions
The Pew Research Center found that over 60% of respondents to a survey believe that corporations and the wealthy aren’t paying their fair share of taxes. Very few think the poor aren’t paying their share of taxes. Democrats and Democratic Leaners strongly feel (77%) that corporations and wealthy people do not pay their fair share. By contrast, 43% or more Republicans and Republican Leaners feel that the wealthy and corporations are not paying their fair share of taxes. This is consistent with surveys by GALLUP and Reuters/Ipsos.
Figure 2#: Survey of American’s Frustration with the Federal Tax System
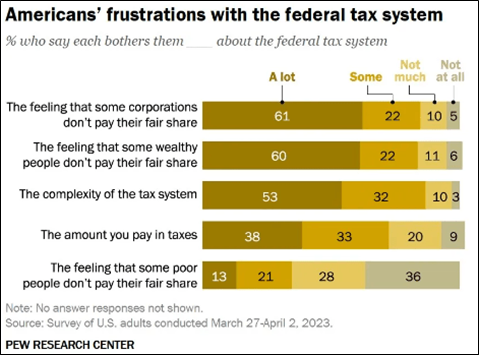
Source: Pew Research Center
Wealth vs Income
USA Facts produced this fascinating chart of income versus wealth below. The wealth of the Bottom 60% by income group is mostly held in real estate (home), other assets (i.e. vehicles, appliances, etc.), and retirement accounts while the wealthiest income groups increasingly own stocks and mutual fund shares and private businesses.
Figure 3#: Components of Wealth by Income Inequality
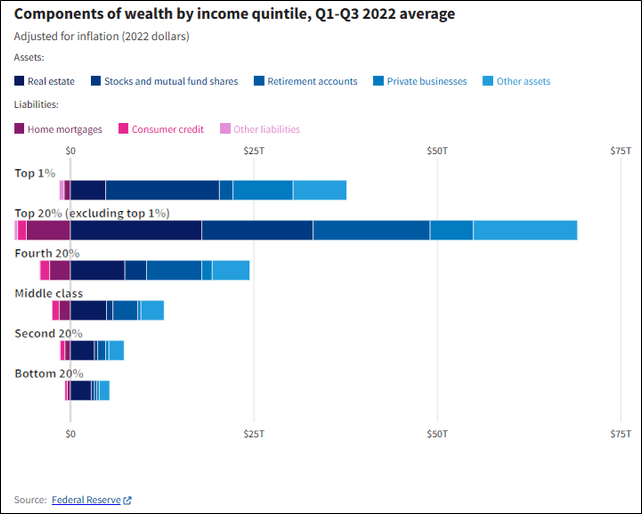
Source: USA Facts: Federal Reserve
I created the following chart from the Board of Governors of the Federal Reserve System Distributional Financial Accounts to show how the distribution of wealth has changed over time. The share of the wealth of the wealthiest 1% grew from 23% to 31% during the past three decades while the share of the wealth of the 50% to 99% groups has fallen from 73.6% to 66.9%.
Figure 4#: Share of Wealth Over Time
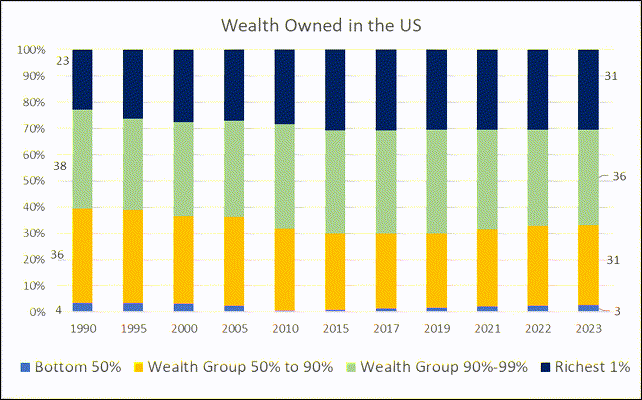
Source: Author: Board of Governors of the Federal Reserve System
I created the next chart from data provided by the Federal Reserve Survey of Consumer Finances to show the wealth distribution by age. The Baby Boomers and older Gen X are the wealthiest Americans (Top 90%).
Figure 5#: Wealth Distribution by Age
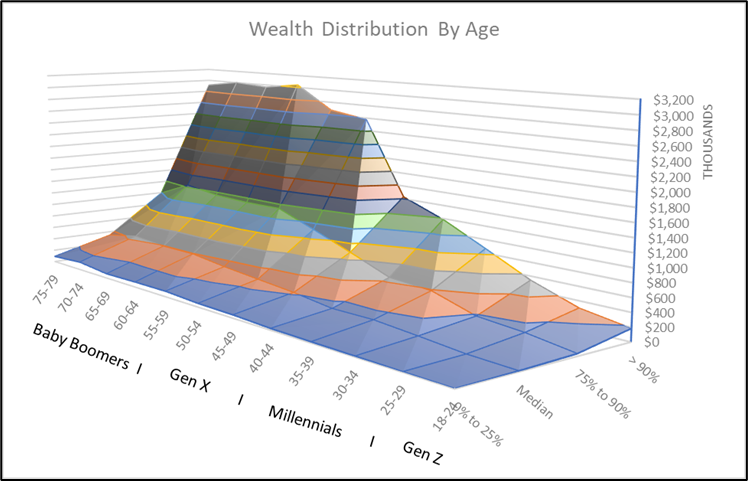
Source: Author: Survey of Consumer Finances
Capital Gains and Wealth Taxes
Some advocate having a wealth tax because stock can be held tax-free until sold when it is taxed at the lower capital gains rate of 20%. By contrast, those working for wages or salary have their incomes taxed at the progressive rates for ordinary income. According to “Tax the Rich!”, 69% of capital gains are earned by the wealthiest 1%. They propose progressive tax rates on capital gains for those with incomes over $1 million.
Stock Buy Backs
President Biden implemented a 1% excise tax on share buybacks. John Foley at Reuters explains the controversy over share buybacks in Biden’s Buyback Tax Shows Who Really Runs America which I summarize as:
- “While dividends are taxed as income, shares sold in a buyback incur capital gains tax that applies only to the owner’s overall profit.”
- Foreign investors, including hedge funds based in tax havens like the Cayman Islands, generally pay no U.S. tax on capital gains, but a 30% tax on dividends. Foreign investors hold around 30% of U.S.-listed stock.
- If companies had paid out $882 billion as dividends rather than in buying back stock the government would have gained up to $80 billion in extra tax revenue.
- Biden’s reforms failed to tackle the biggest problem with share buybacks, which is that they allow very wealthy Americans to amass fortunes and pass them on to their heirs while sheltering from tax.
IRS Audits
In Trends in the Internal Revenue Service’s Funding and Enforcement, the Congressional Budget Office said the IRS estimates that the annual tax gap is several hundred billion dollars per year. Between 2010 and 2018, inflation-adjusted funding for the IRS fell by 20% adjusted for inflation. The authors of “Tax the Rich!” say that “From 2001 to 2019, the proportion of millionaires who were audited dropped from 12% to just 3%, while fewer than 1% of all corporations are now audited each year.”
The Associated Press reported that the IRS has recovered $462 million in back taxes over the past two years from delinquent millionaires. The IRS leadership attributed it to increased funding under the Inflation Reduction Act.
Tax Distribution
Federal Tax Rates
The Pew Research Center analyzed data from the IRS’s Statistics of Income Program to produce the following chart. It shows that most income groups had a reduction in the average effective federal income tax rate during the past two decades.
Figure 6#: Federal Income Tax Is Progressive as a Whole, But Less So at the Top
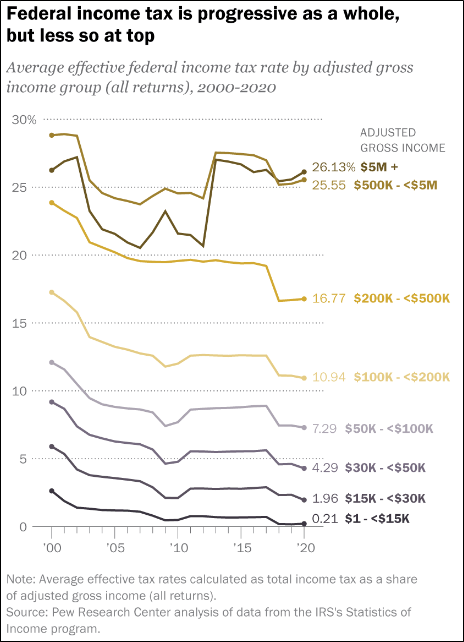
Source: Pew Research Center: IRS’s Statistics of Income program
The Tax Foundation published Summary of the Latest Federal Income Tax Data, 2023 Update describing that the “top 1 percent of taxpayers (AGI of $548,336 and above) paid the highest average income tax rate of 25.99 percent—more than eight times the rate faced by the bottom half of taxpayers.”
While taxes paid can fluctuate, 25.99% paid by the Top 1% is significantly below the 42% from the 1950s when the debt to GDP ratio was high after World War II.
The Congressional Budget Office published Trends in the Distribution of Household Income From 1979 to 2020 that shows that prior to 2020, the Top 1% paid about 25% of the Federal taxes including individual income taxes, payroll taxes, corporate income taxes, and excise taxes, and the next 19% pay approximately 45%.
State and Local Burdens
The following chart from the Tax Foundation estimates average Federal and state/local tax burdens in 2019 by household income levels. State taxes tend to be regressive having a greater impact on lower income groups. Average total Federal, State, and Local income tax burdens are 24.6% for the bottom income group and 34.5% for the Top income group.
Figure 7#: Household Federal and State/Local Tax Burdens
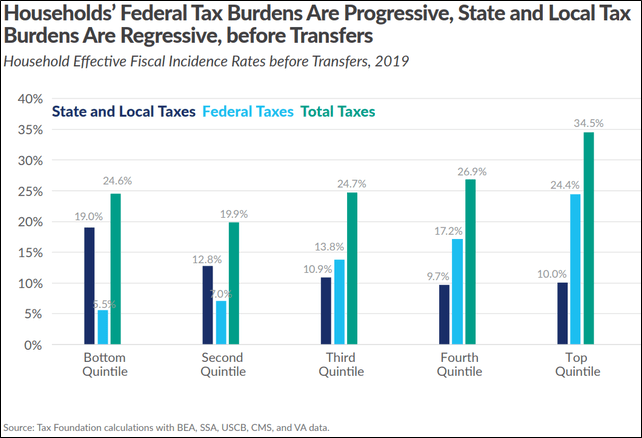
Source: Tax Foundation: BEA, SSA, USCB, CMS, and VA
Corporate Taxes
The wealthiest 1% own over half of all stocks. The Patriotic Millionaires in “Tax the Rich!” list five methods that corporations use to reduce their taxes:
- Multinational Money Games: International Profit Shifting
- Giving Away the Store: Our New Territorial Tax System
- Over There, Over There: Relocating Assets Overseas
- Stocking Up on Loopholes: Stock Options for Executives
- Look Fast! Oh, You Missed it: Accelerated Depreciation
According to S&P Dow Jones Indices, in 2018 approximately 29.1% of the revenue of the companies in the S&P 500 came from international sources. CBS News reported 60 profitable companies in 2018 that paid no Federal taxes. For 2020, the Institute on Taxation and Economic Policy listed that “55 of the largest corporations in America paid no federal corporate income taxes in their most recent fiscal year despite enjoying substantial pretax profits in the United States.” They add that “it appears to be the product of long-standing tax breaks preserved or expanded by the 2017 Tax Cuts and Jobs Act (TCJA) as well as the CARES Act tax breaks”.
Yellen Says 100,000 Firms Have Joined a Business Database Aimed at Unmasking Shell Company Owners by the Associated Press describes that 100,000 businesses have joined a new database that collects “beneficial ownership” information on firms as part of a “new government effort to unmask shell company owners.” The National Bureau of Economic Research published International Tax Avoidance by Multinational Firms that states that according to recent estimates, “close to 40 percent of multinational profits — profits booked by firms outside of their headquarters’ country — are shifted to tax havens.”
Tax Reform
The Patriotic Millionaires offer six solutions to reform the tax system:
- Equalize Capital Gains and Ordinary Income Tax Rates for Incomes Over $1 Million
- End the Bracket Racket: Create Lots of Brackets at Much Higher Rates
- Tax The Rich!: Implement a Wealth Tax
- Stop Letting Investors Delay Tax Payments on Capital Gains: Mark-to-Market Taxation
- Make Corporations Pay Taxes Where They Really Make Their Profits: End Profit Shifting
- Make Sure They Actually Pay: Fund the IRS
The Organisation for Economic Co-operation and Development (OECD) published Summary Economic Impact Assessment Global Minimum Tax in January 2024, describing a 15% Global Minimum Tax (GMT) on multinational enterprises with revenues above EUR 750 million wherever they operate. It was agreed to by over 135 member jurisdictions in October 2021. “Since then, the implementation of the GMT has progressed with around 55 jurisdictions already taking steps toward implementation and with the rules coming into effect in 2024.”
Closing Thoughts
Are the Patriot Millionaires correct? My analysis of the data leads me to agree with the Patriot Millionaires that aligning the tax system to be fairer to the employed wage earner is appropriate. I have signed up for the Patriotic Millionaires newsletter to receive updates.