


The reported death of the 60/40 portfolio is premature. It did suffer some serious illness as the stock market fell and interest rates rose last year. I help family and friends work with Financial Advisors to set up managed portfolios of mutual funds and exchange traded funds at Edward Jones, Fidelity, and Vanguard. Jeff DeMaso from The Independent Vanguard Advisor was kind enough to provide a Moderate Portfolio for this article. In this article, I am describing one managed Traditional IRA portfolio (50/50), one managed Roth IRA portfolio (70/30), one managed tax efficient portfolio (50/50), one self-managed Traditional IRA portfolio with varying allocations, and the Moderate Portfolio from Mr. DeMaso.
Financial Advisors will charge 0.3% to over 1% of the assets in management fees. These management fees are not subtracted from the performance of the portfolios in this article. The investor works with these Advisor to determine characteristics of these portfolios such as risk levels and allocations to active or index funds. I include Vanguard Balanced Index Admiral Fund (VBIAX) in each of the portfolios with no allocation as a baseline for comparison.
If an investor owns both Traditional and Roth IRAs then the risk should be higher in the Roth IRA where taxes have been paid than the Traditional IRA where taxes are yet to be paid. After tax accounts may vary according to whether the investor views them as long-term where a total stock market index fund will work well, or shorter term where the portfolio will include municipal bond funds. After-tax portfolios may also employ active tax loss harvesting strategies.
This article is divided into the following sections:
- Section 1, High Valuations Hold Me Back
- Section 2, Vanguard Managed Traditional IRA 50/50
- Section 3, Fidelity Managed Roth IRA 70/30
- Section 4, Edward Jones xx/xx Tax Efficient Portfolio
- Section 5, Author’s Traditional IRA
- Section 6, Independent Vanguard Advisor Portfolio
- Section 7, Comparison of Three Portfolios
HIGH VALUATIONS HOLD ME BACK
I identify mostly with the philosophy of Howard Marks, co-founder of Oaktree Capital Management, who wrote in Mastering the Market Cycle: Getting the Odds on your Side:
“In my view, the greatest way to optimize the positioning of a portfolio at a given point in time is through deciding what balance it should strike between aggressiveness/defensiveness. And I believe the aggressiveness/ defensiveness should be adjusted over time in response to changes in the state of the investment environment and where a number of elements stand in their cycles.”
While the economy is surprisingly resilient in spite of high yields and an inverted yield curve, I remain conservative. The price-to-earnings ratio is in the upper 15% compared to the last eighty years – higher than all but the Dotcom Bubble and Great Financial Crisis as shown in Figure #1 from S&P 500 PE Ratio – 90 Year Historical Chart. High valuations and high yields that are likely to fall in the second half of the year favors a tilt towards bonds with longer durations, in my opinion.
Figure #1: S&P 500 PE Ratio – 90 Year Historical Chart
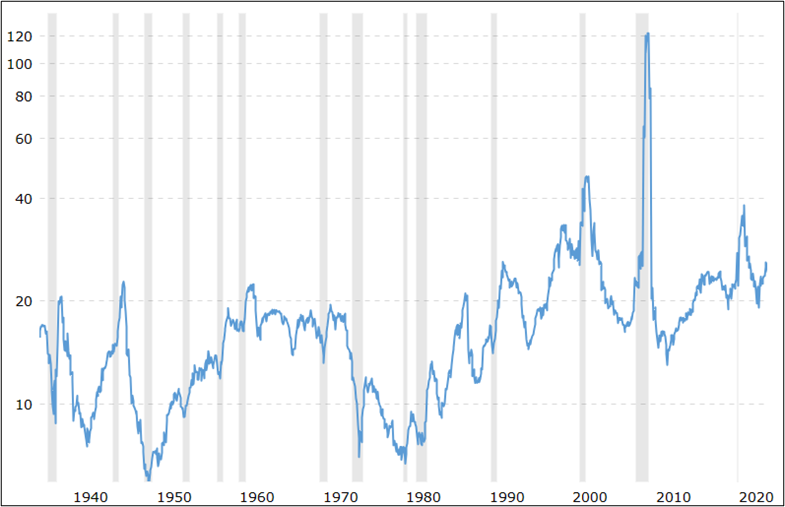
Source: Macrotrends
I prefer using the Cyclically Adjusted Price to Earnings (CAPE) Ratio. Ed Easterling, founder of Crestmont Research provides a good summary in Stock PE Summary (Quarterly) and a good description in Stock PE Report (Annual).
“Today’s normalized P/E is 32.1; the stock market remains positioned for below-average long-term returns. The valuation level of the stock market is above average. Relatively high valuations lead to below-average returns. Further, the valuation level of the stock market is relatively high given the currently elevated inflation rate and interest rate environment.”
VANGUARD MANAGED TRADITIONAL IRA 50/50
Below is a Vanguard-managed Traditional IRA that was set up to be approximately 50% stock and 50% bonds and consists of a mixture of index and actively managed funds. Vanguard uses largely a buy-and-hold strategy. Management fees are 0.3%, but services increase for balances over $500,000.
Figure #2: Vanguard Managed Traditional IRA – 25 months
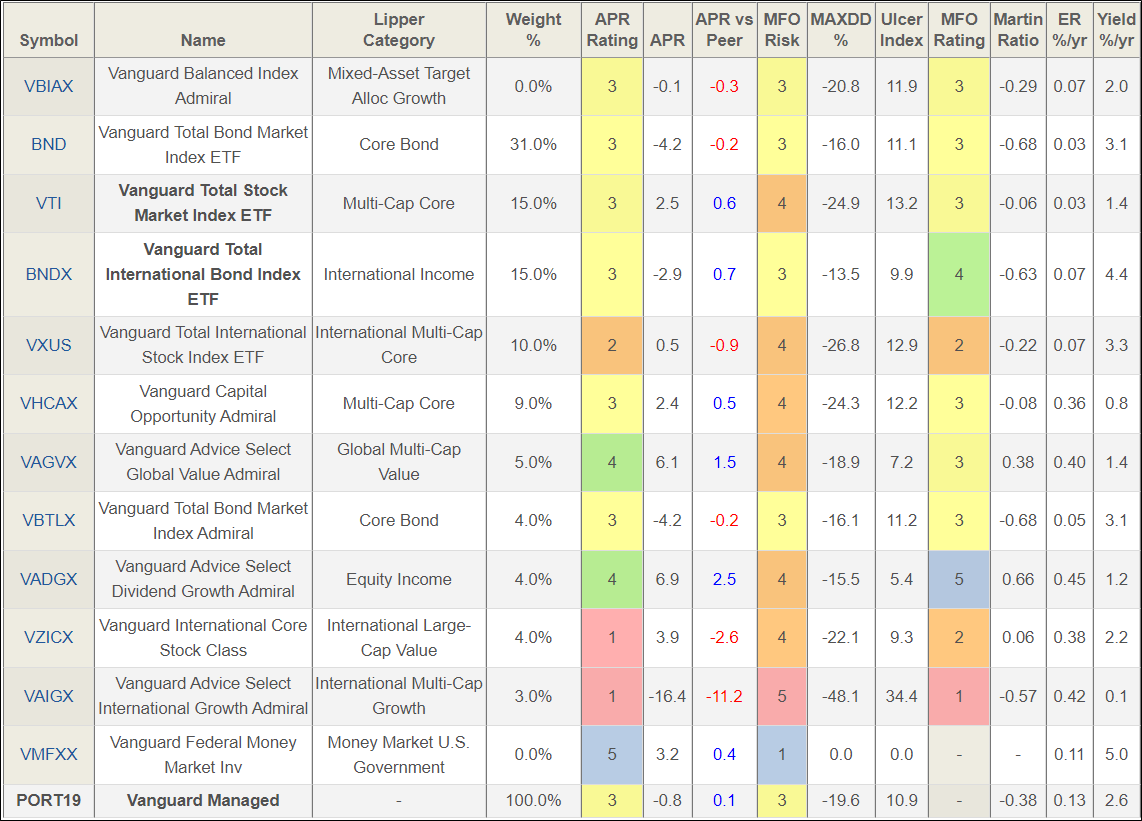
Source: Author Using Mutual Fund Observer Portfolio Tool
The Vanguard Managed Traditional IRA (50/50) is approximately:
US Stocks: 29%
International Stocks: 20%
US Bonds: 32%
International Bonds: 17%
Cash: 2%
Other: 0%
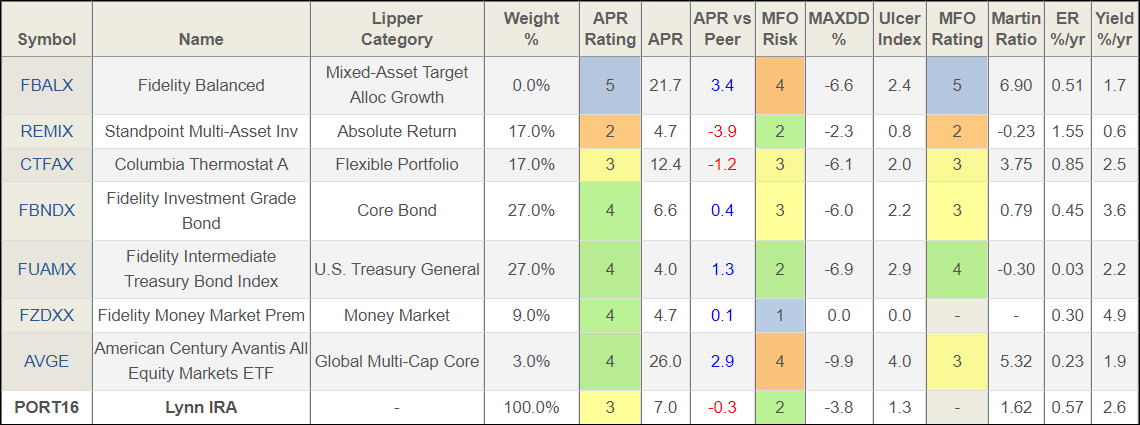
FIDELITY MANAGED ROTH IRA 70/30
Below is a Fidelity-managed Roth IRA that invests according to the business cycle. Fidelity is very flexible working with clients to set up portfolios. The target allocation is 70% stocks, but it varies with Fidelity’s perception of the market outlook. Fidelity states that “Fees will vary based on the products and services you select; however, you’ll be informed of the fees before you make a decision—all part of our commitment to being transparent.”
Figure #3: Fidelity Managed Roth IRA – 17 months
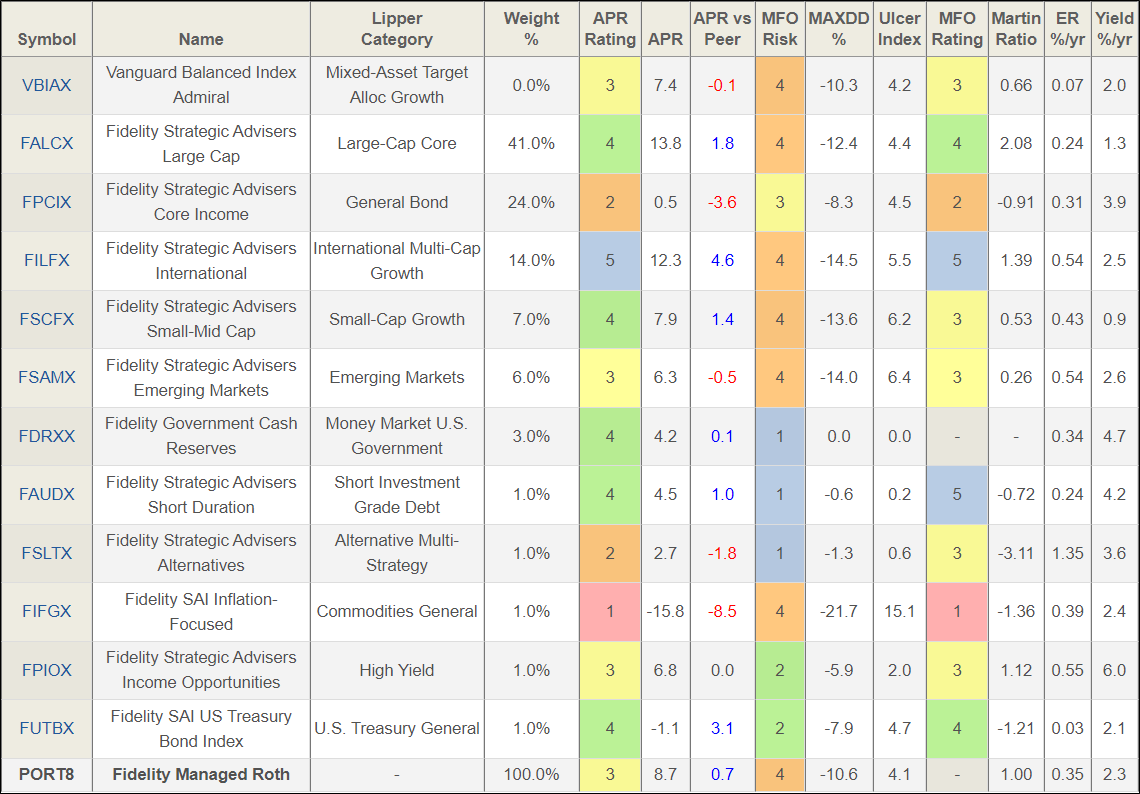
Source: Author Using Mutual Fund Observer Portfolio Tool
The Fidelity Managed Roth IRA (70/30) is approximately:
US Stocks: 47%
International Stocks: 20%
US Bonds: 25%
International Bonds: 3%
Cash: 3%
Other: 2%
EDWARD JONES 50/50 TAX EFFICIENT PORTFOLIO
This is a portfolio that was set up with and managed by Edward Jones to be a tax-efficient portfolio to minimize taxes with moderate growth potential.
Figure #4: Edward Jones Managed Tax Efficient Portfolio – 24 Months
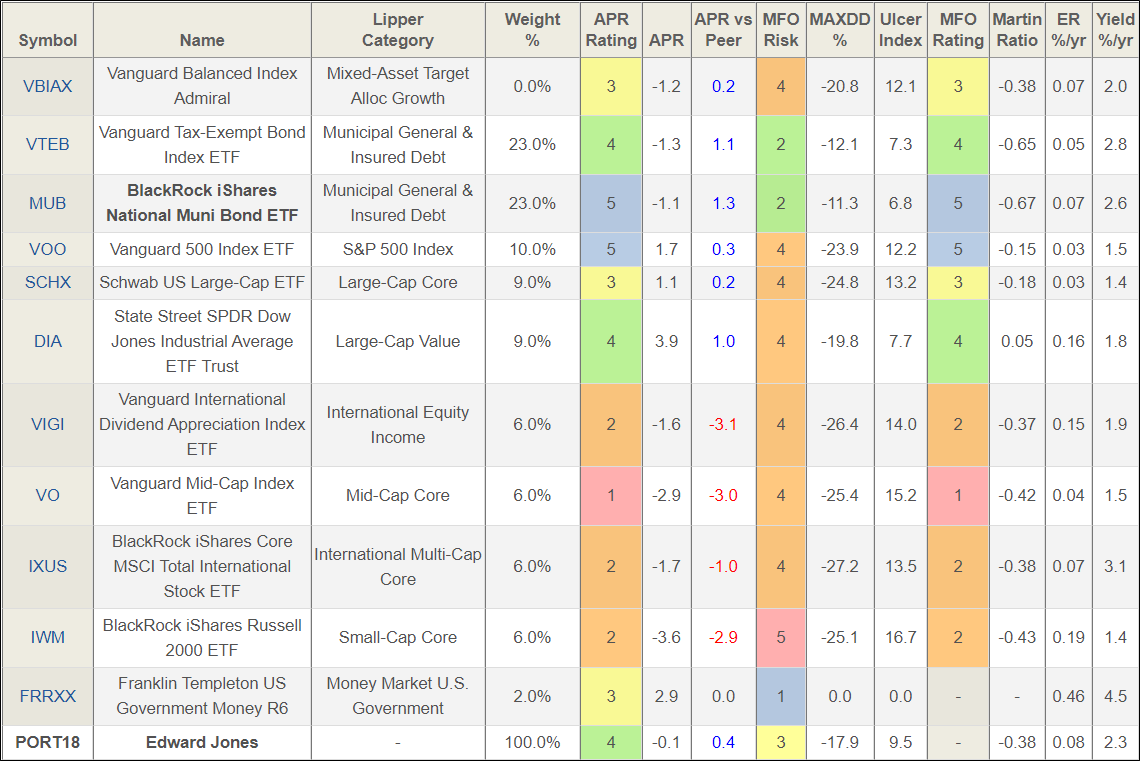
Source: Author Using Mutual Fund Observer Portfolio Tool
The Edward Jones Tax Efficient Portfolio (50/50) is approximately:
US Stocks: 40%
International Stocks: 12%
US Bonds: 46%
International Bonds: 0%
Cash: 2%
AUTHOR’S TRADITIONAL IRA
I follow the bucket approach and use Financial Advisors to manage the Bucket #3 with long-term investments. I manage the short-term Bucket #1 and intermediate-term Bucket #2. I have created a hypothetical portfolio to reflect the Bucket #2 using bond funds instead of the bond ladders that I own. I own several funds that have been written about in the Mutual Fund Observer newsletters. David Snowball wrote Standpoint Multi-Asset Fund: Forcing Me to Reconsider and I wrote One of a Kind: American Century Avantis All Equity Markets ETF (AVGE). Information about the Thermostat Fund (COTZX/CTFAX) can be found at the Columbia Thermostat website and Morningstar. My next purchases will be of AVGE as bonds mature and I want to increase allocations to stock.
Figure #5: Author’s Investment Bucket #2 Intermediate IRA Portfolio – 15 Months
Source: Author Using Mutual Fund Observer Portfolio Tool
The Author’s Intermediate Investment Bucket Portfolio (varies) is approximately:
US Stocks: 10%
International Stocks: 4%
US Bonds: 66%
International Bonds: 3%
Cash: 15%
Other: 1%
INDEPENDENT VANGUARD ADVISOR PORTFOLIO
Jeff DeMaso from The Independent Vanguard Advisor provided a Moderate Portfolio for this article. The Independent Advisor maintains model portfolios for the Do-It-Yourself investors who want to stay on top of the market and happenings at Vanguard.
Figure #6: The Independent Vanguard Advisor Moderate Portfolio – 24 Months
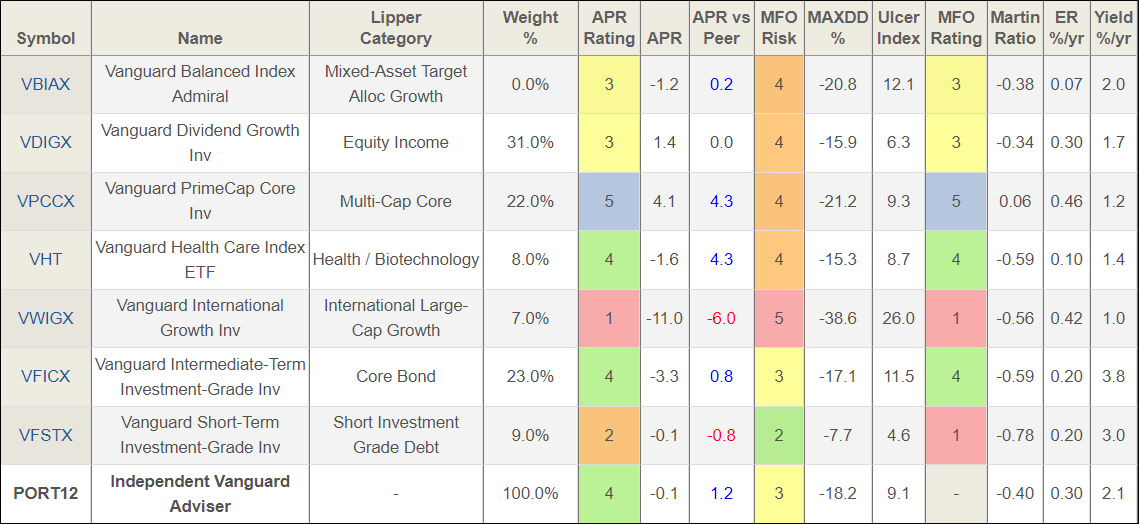
Source: Author Using Mutual Fund Observer Portfolio Tool
The Independent Vanguard Advisor Moderate Portfolio (60/40) is approximately:
US Stocks: 55%
International Stocks: 11%
US Bonds: 26%
International Bonds: 6%
Cash: 2%
Other: 0%
COMPARISON OF THREE PORTFOLIOS
I used Portfolio Visualizer to compare the Vanguard Managed Traditional IRA, Fidelity Managed Roth IRA, and The Independent Vanguard Advisor Moderate Portfolio. The link to Portfolio Visualizer is here. The allocations to the latter two will vary as the managers see opportunities and risks. The fees from the Vanguard and Fidelity portfolios have not been subtracted from their performance. The chart starts in August 2022 due to the short life of AVGE. One final comment is that the allocations are different for the three different portfolios. During this time period portfolios with higher allocations to stocks performed better before fees are subtracted.
Figure #7: Performance of Fidelity, Vanguard and Independent Vanguard Advisor
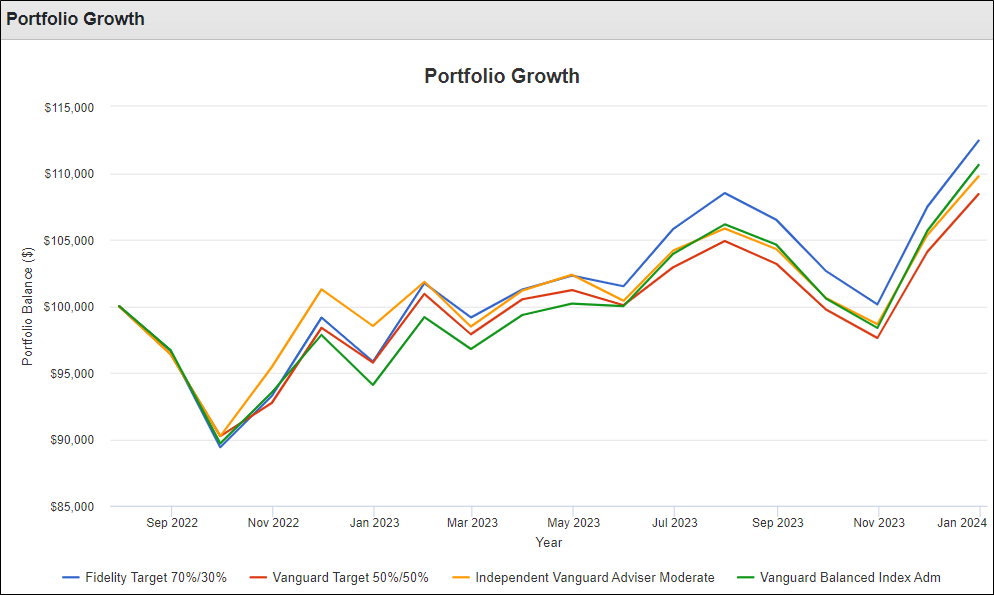
Table #1: Performance of Fidelity, Vanguard and Independent Vanguard Advisor
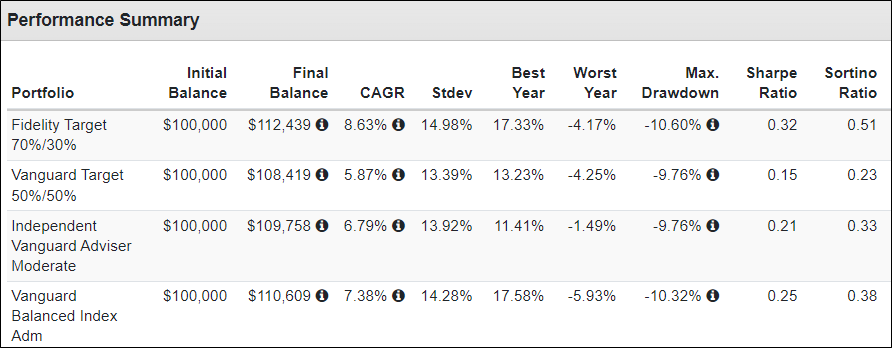
Source: Author Using Portfolio Visualizer
Closing
My current thought is to look for opportunities to increase my allocations to stocks in tax-efficient portfolios to take advantage of lower capital gains rates, and more Roth Conversions before the Tax Cuts and Jobs Act of 2017 sunsets at the end of 2025. Depending upon market conditions.