Ratings System Definitions

Revision: January 7, 2016 to reflect switch to Lipper database and subsequent updates.

Originally published in July 1, 2013 Commentary

The following is a summary of definitions of the various terms tabulated in the MFO rating system. A recap of the system’s methodology can be found in David’s June 2013 commentary under Introducing MFO Fund Ratings. For those interested in the mathematical formulas used in the system, they can be found on the MFO Discussion board under A Look at Risk Adjusted Returns.

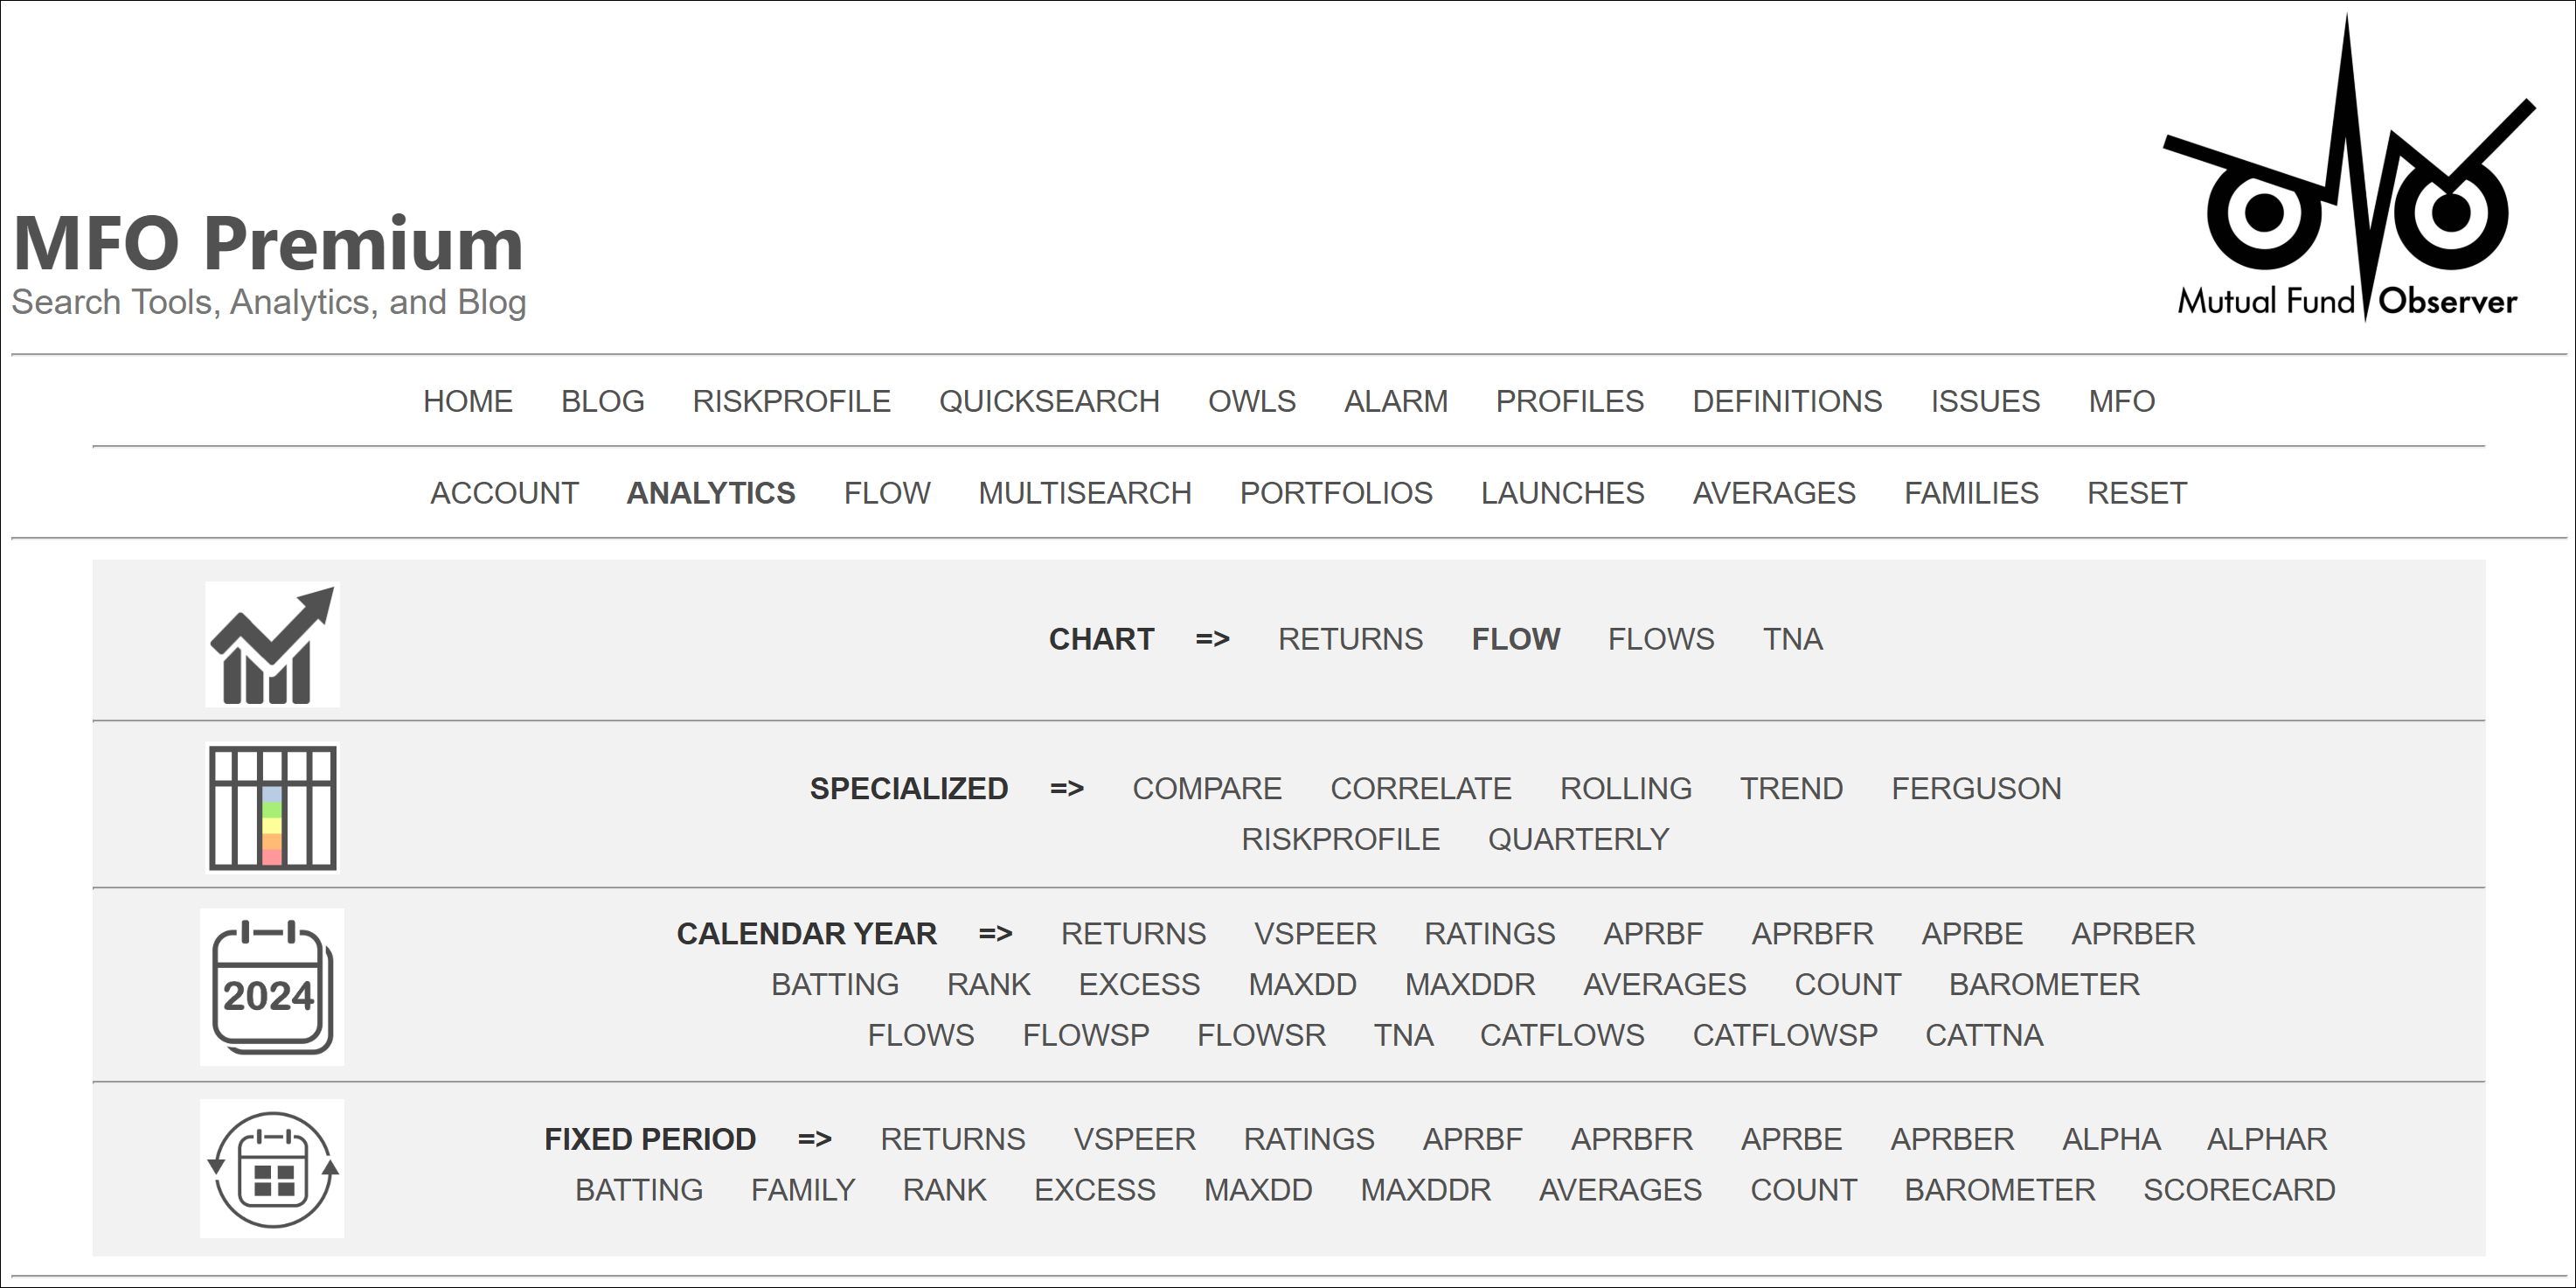
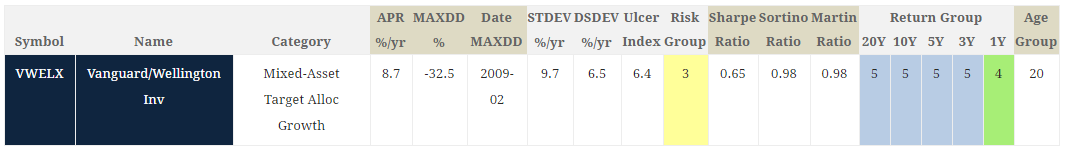
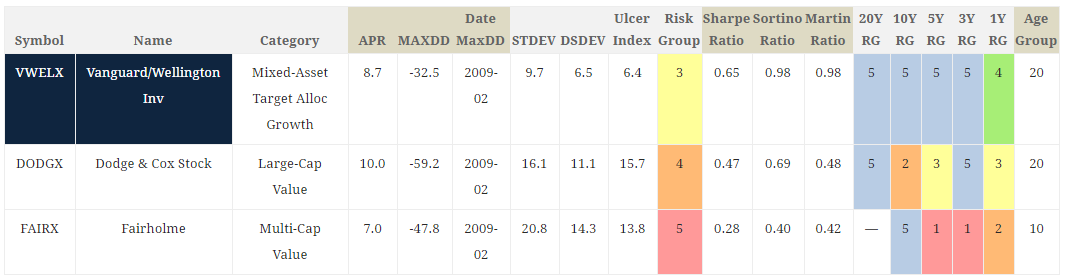
The following definitions are for metrics found in the output pages of our Risk Profile and Miraculous MultiSearch tools (examples depicted below):

definitions_headers

definitions_headers_2

Type

A fund’s broad investment approach. The MFO rating system groups funds into three types: Fixed Income (FI), Asset Allocation (AA), and Equity (EQ). Asset allocation funds typically manage a mixed portfolio of equities, bonds, cash and real property. Typically, but not always, equity funds principally invest in stocks, while fixed income funds principally invest in bonds.

Category

A fund’s current investment style as defined by Lipper. There are 155 such classifications or categories, like Large-Cap Value, Core Bond, and Alternative Long/Short Equity. A detailed description can be found here.

Annualized Percent Return (APR)

A fund’s annualized average rate of total return each year over period evaluated. It is an abstract number, or so-called “geometric return,” since actual annual returns can be well above or below the average, but annualizing greatly facilitates comparison of fund performance. APR is equivalent to CAGR, or compound annual rate of return. It reflects reinvestment of dividend and capital gain distributions, while deducting for fund expenses and fees. It excludes any sales loads.

Maximum Drawdown (MAXDD)

The percentage of greatest reduction in fund value below its previous maximum over period evaluated. MAXDD can be the most frightening of a fund’s many statistics, but surprisingly it is not widely published. Many top rated and renowned funds incurred maximum drawdowns of -60% or worse in 2009. The date (month/year) of MAXDD occurrence is also tabulated in the MFO rating system.

Standard Deviation (STDEV) 

A measure of fund volatility. The higher a fund’s standard deviation, the more its return has varied over time. That can be both good and bad, since a rise or fall in value will cause standard deviation to increase. Typically, but not always, money market funds have lowest standard deviations, stocks funds have highest, while bond funds are in-between. In the MFO rating system, STDEV indicates the typical percentage variation above or below average return a fund has experienced in a year’s time. On good or bad years, variations from average returns have been two or three times the standard deviation, and every now and then even more.

Downside Deviation (DSDEV)

Another measure of fund volatility, but it measures only downward variation. Specifically, it measures a fund’s return below the risk free rate of return, which is the 90-day T-Bill rate (aka cash). Money market and very short term bond funds typically have downside deviations very close to zero, since they normally return T-Bill rate or higher. Stock funds typically have the highest downside deviations, especially in bear markets. In the MFO rating system, DSDEV indicates the typical percentage decline below its average excess return a fund has experienced in a year’s time.

Ulcer Index (UI) 

A third measure of fund volatility and the most direct measure of a fund’s bouts with declining (and uncomfortable, hence its name) performance. It measures both magnitude and duration of drawdowns in value. A fund with high Ulcer Index means it has experienced deep or extended declines, or both. Ulcer Index for money market funds is typically zero. During bull markets, stock funds too can have a low Ulcer Index, but when the bull turns, watch out. In the MFO rating system, UI indicates the typical percentage decline in value a fund has experienced at some point during the period evaluated.

Risk Group 

2013-06-27_1922_rev1
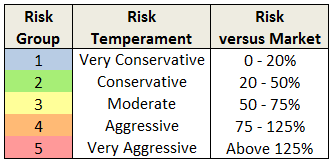
The score or ranking used in the MFO rating system to designate a fund’s risk relative to overall market, defined by SP500 index. Funds less than 20% of market are placed in risk group 1 and deemed “very conservative,” while those greater than 125% are placed in risk group 5 deemed “very aggressive.” Note that the system uses all three risk measures (STDEV, DSDEV, and UI) and all evaluation periods across a fund’s life when making the risk determination. The evaluation periods are 1, 3, 5, 10, and 20 years, as applicable. In this way, the system can be very sensitive to risk. For example, a fund with a 10 year record of moderate risk may get an elevated risk ranking, temporarily at least, if it experiences a rough patch in the past 12 months.  Also, probably good to emphasize here that risk is fundamental to producing excess return and many top rated funds are also very aggressive. The reference market itself in the MFO system is deemed “aggressive” by definition.

Sharpe Ratio 

A measure of risk adjusted return, which is to say it helps quantify whether a fund is delivering returns commensurate with the risk it is taking. Specifically, it is the ratio of the fund’s annualized excess return divided its standard deviation. A fund’s “excess return” is any amount above risk-free investment, which is typically 90-day T-Bill. Sharpe is best used when comparing funds of same investment category over same evaluation period. The higher its Sharpe, the better a fund is performing relative to its risk, or more precisely, its volatility.

Sortino Ratio 

Another measure of risk adjusted return, but in this case it is relative to the amount of downside volatility (DSDEV) a fund incurs. It is a modification of the Sharpe intended to address a criticism that Sharpe unfairly penalizes so-called good volatility (ie., rising value), which investors don’t mind at all.  In other words, a fund that goes up much more than down may be underappreciated in Sharpe, but not Sortino. Like Shape, Sortino is best used when comparing funds of same investment category over same evaluation period.

Martin Ratio

A third measure of risk adjusted return. Like Sharpe and Sortino, it measures excess return, but relative to its typical drawdown. After the 2000 tech bubble and 2008 financial crisis, which together resulted in a “lost decade” for stocks, investors have grown very sensitive to drawdowns. Martin excels at identifying funds that have delivered superior returns while mitigating drawdowns. It too is best used when comparing funds of same investment category over same evaluation period – this very comparison is the basis for determining a fund’s Return Group rank in the MFO rating system.

Return Group 

The score or ranking of a fund’s performance based on Martin Ratio relative to other funds in same investment category over same evaluation period. The evaluation periods are 1, 3, 5, 10, and 20 years, as applicable. Funds in the top 20 percentile are placed in return group 5, while those in bottom 20 percentile are in return group 1. MFO “Great Owl” designations are assigned to funds that have earned top performance rank for all evaluation periods 3 years or longer, as applicable.

Some other qualifications:

  • The system includes oldest share class only.
  • The system does not account for category drift.
  • Funds are presented only once based on age group, but the return rankings reflect all funds existing. For example, if a 3 year fund scores a 5 return, it did so against all existing funds over the 3 year period, not just the 3 year olds.
  • All calculations are made with using monthly total returns from Lipper Data Feed Service for U.S. Open End funds.
  • The ratings are based strictly on historical returns.
  • The ratings will be updated quarterly.

The Options Conundrum: Fund Comparisons, Performance, and Risk

Having looked at the qualitative rationale for why options-based funds are offered by fund managers and sought by some investors, it behooves us to quantitatively analyze options funds’ performance. There is no ONE BENCHMARK that can be used to compare ALL the options funds. That may be a good thing. It’s made me think of what a good way to create a customized benchmark for each fund might look like. The benefit of keeping things focused on the small picture is we can look at one fund at a time, in detail, without drawing too Continue reading →

March 1, 2024

Dear friends,

In like a lion, out like a lamb? The Total Stock Market Index has risen 12% in the past three months, as has the S&P 500. Nvidia stock is up 76% in the same period while semiconductor stocks inched up … 48%.

The thermometer in Davenport today topped 76 degrees, just a bit warm for a late winter day. We heard that participants in the March 1st Polar Plunges at locations across the upper Midwest had to be Continue reading →

The Unfortunate Manager, the Ill-timed Bus, and You

On June 23, 2023, Robert B. Bruce (1931-2023) passed away. It diminishes a rich life and generous soul to describe him merely as “one of the portfolio managers of the Bruce Fund.” A Wisconsin graduate, he had a long-time friendship with Ab Nicholas, another renowned investor, and namesake of the Nicholas Fund, with whom he created an endowment for Wisconsin athletics. His obituary celebrates “a model of hard work, generosity, and unpretentious success” who passed away “in the embrace of his family.” From 1965-1972, Bob helped manage the Mathers Fund (MATRX) to phenomenal success, then set out on his own in 1972. He eventually purchased a small mutual fund in 1983, brought on his eldest son, Jeff, as partner and co-manager, and crafted a 40-year record of distinction and success. Continue reading →

In conversation with Andrew Foster @ Seafarer Funds (SIGIX & SIVLX) : On Emerging Markets

Introduction: Trouble in the Emerging Market Equities asset class

Emerging Market Equities (EM Eq), as tracked by the iShares MSCI Emerging Market ETF, are up almost 10% this year. That would generally be welcome news for the ignored asset class. But the news is not good enough. I have the distinct sense that investors of multiple stripes are “giving up” on EM Eq. There isn’t a wholesale liquidation as much as the flow of money in EM has slowed down. The long-held conviction that EM Eq is an asset class where one has to be involved has now Continue reading →

Strong June Propels New Bull Market

Despite pervasive skepticism based on: Russian invasion. China US tension. Inflation. Rising rates. Bank collapses. Default fears. The S&P 500 has been climbing generally for 9 months. Axios describes this year’s market as “climbing a wall of worry.”

A strong June of 6.6% return propelled the index to 26% over its October low, which qualifies the advance as a new bull market. Continue reading →

Battle of the Titans for Portfolio Management – Fidelity vs Vanguard

Asset Manager Titans Fidelity and Vanguard have options for portfolio management that vary allocations across asset classes over time which include assessments of long-term market trends. Fidelity has the Business Cycle Approach while Vanguard has the time-varying-asset approach based on the Vanguard Capital Markets Model (VCMM). In this article, I briefly describe Continue reading →

Is Bigger Better?

I have often heard that smaller funds are able to outperform larger ones because they can be nimbler. This article started as a search for the best performing “core” funds over the past fifteen years, but I started over several times as I challenged my own search criteria to select only large funds. My assumption was that success builds upon success and investors invest more in funds that are doing Continue reading →

Leuthold Core Investment (LCORX/LCRIX), June 2023

Objective and strategy

Leuthold Core pursues capital appreciation and income through the use of tactical asset allocation. The objective is to avoid significant loss of capital and deliver positive absolute returns while assuming lower risk exposure and lower relative volatility than the S&P 500. Assets are allocated among stocks and ADRs, corporate and government bonds, REITs, commodities, an equity hedge, and cash. Portfolio asset class weightings change as conditions do; exposure is driven by models that determine each asset class’s relative and absolute attractiveness. Equity and fixed-income exposure each range Continue reading →

Investing Without an Ulcer

The good news is, in the long term, things will work out okay.

The bad news is that there are a lot of miserable short-terms between now and then. The most successful long-term investments are ones that allow you to endure the short term with a minimum of trauma.

Or drama. (Comedian Anita Renfroe offers, “Difficulty is inevitable. Drama is a choice.”)

Or ulcers. (Philosopher Marilyn Monroe: “If you spend your life competing with businessmen, what do you have? A bank account and ulcers!”)

Ulcers are to be avoided. We have a way. Continue reading →

Seafarer Overseas Value Fund (SFVLX), April 2023

“We are living through investment regime change”

Objective and strategy

Seafarer Overseas Value pursues long-term capital appreciation. The fund typically invests in common stocks, though the managers have the ability to add both preferred stocks and fixed-income securities. The investable universe includes both emerging markets, as traditionally conceived, and companies domiciled in selected foreign developed nations Continue reading →

Shining the Light into Black Box Funds

Source: PublicDomainPictures.net

A reader on the Mutual Fund Observer Discussion Board asked “how do you feel about putting monies into funds that have a somewhat ‘black box’ dynamic to them…yes, they explain their positions but sometimes I wonder, how safe of an investment are some of these funds?”

For those not familiar with black box investing, Investopedia explains: “a black box is a device, system, or object which produces useful Continue reading →

Emerging Markets Investing in the Next Decade: The Players

Who, from a universe of 200+ emerging markets managers, did we choose to speak to … and how?

Good question! We decided to rely on insiders’ judgment, rather than mere notoriety or a strategy’s recent performance. We started by talking with Andrew Foster about his take on his investable universe and its evolution, then asked Andrew whose judgments he respected and who we ought to talk with. We asked those folks the same. Those recommendations, constrained by time and availability, led to conversations with the six worthies below. Continue reading →

An ESG Primer

There are days when the world seems unnecessarily out of whack. Runways in London are melting, doctors and pharmacies are denying basic legal reproductive care to women because of fear of prosecution, and corporations are hiding more and more dark money contributions.   It doesn’t matter where you stand politically; both parties are rollicking in the dark. Many people are working to make the world a better place, and many more seem stunned and appalled. One of the strategies that was very much in vogue last year was Continue reading →

July 1, 2022

Dear friends,

As you read this, Chip and I will be on vacation in Door County, the idyllic peninsula just north of Green Bay, Wisconsin. While I’m sure there have been years when she and I more needed time away, I surely cannot remember when. I was introduced, this year, to the term “trauma-informed pedagogy” and to the realization that perhaps three-quarters of our young people have taken a few more hits than they’re currently capable of managing.

Having managed their mental health for the past year, we’re going to work on our own for Continue reading →

MFO Premium 2022 Mid-Year Review

The next MFO Premium webinar will occur Tuesday, July 12th.

Our premium search tool site helps individual investors and financial advisers 1) sort through the vast number of funds available today based on criteria important to them, 2) maintain candidate lists of promising funds to conduct further due diligence on, and 3) monitor risk and return performance of their current portfolios. Continue reading →

Not a Great Time for Bond Fund Investors … But There’s Hope

A quick sampling of recent headlines …

  • Morningstar author Sandy Ward: “Bond Investors Facing Worst Losses in Years. With inflation still running hot, bond prices are sliding as the market looks for faster Fed rate hikes.”
  • Bloomberg reporter Ye Xie: “… an unparalleled bond rout wiped 13% off a Bloomberg global index of government debt since its peak in January 2021 as the central banks unwound their pandemic-era stimulus.”
  • Wall Street Journal reporter Sam Goldfarb: “Bond Market Suffers Worst Quarter in Decades. Rout has robbed investors of traditional haven as stocks and many other markets swing sharply.”

Continue reading →

Recipe-based investing

Step One: Find the right recipe.

Indexes are recipes. By that, I mean they’re really precise sets of instructions that direct you in what ingredients, in what amounts, need to be treated, in what way to achieve a particular, predictable outcome. In investing, as in cooking, recipes are relatively recent inventions. Once upon a time, both activities were dominated by the notion that “experienced old guys do their thing, the rest of us watch in awe.”

Take luce or tench or fresh haddock, & boil them & fry them in olive oil. And then take vinegar and the third part sugar & onions minced small, & boil all together, & mace & cloves & cubeb. And lay the fish in dishes & pour the sauce above & serve it forth. Continue reading →

Overcoming Drawdowns

My “Thoughts on Inflation Protection” essay, which appeared in MFO’s February 2022 issue, focused primarily on the role of different major asset classes in providing an inflation buffer for your portfolio. The article was focused in particular on the performance of funds and ETFs with substantial exposure to TIPS (Treasury Inflation-Protected Securities) and similar products. I highlighted the promise of short-duration TIPS funds.

In passing, I also noted the long-term potential role of domestic stocks and Equity REITS in protecting against inflation, while mentioning their two main drawbacks. One, they do not Continue reading →