


At the time of publication, this fund was named Catalyst/MAP Global Total Return Income.
Objective and strategy
The manager attempts to preserve capital while generating a combination of current income and moderate long-term capital gains. The portfolio has four sleeves:
- 40-65 global equity positions constituting 30-70% of the portfolio depending on market conditions. Over the past five years, the range has been 54-62%.
- Income-generating covered calls which might be sold on 0-30% of the portfolio. Of late option premiums have not justified writing.
- Short/intermediate-term bonds, generally rated B+ or better and generally with an average maturity of approximately a year.
- Cash, which has traditionally been 5-15% of the portfolio.
The portfolio is unconstrained by geography, credit quality or market cap. The manager is risk conscious, looking for securities that combine undervaluation with a definable catalyst which will lead the market to recognize its intrinsic value.
Adviser
Catalyst Capital Advisors LLC. Founded in 2006, Catalyst specializes in bringing alternative managers, folks with distinctive strategies which focus on risk and volatility management, to retail investors and advisors. Catalyst advised one fund in 2006 and 27 in 2015. It works with ten investment management firms and has more than $2.5 billion in assets under management.
Manager
Michael S. Dzialo, Peter J. Swan and Karen M. Culver. Mr. Dzialo is the founder and president of Managed Asset Portfolios, LLC (MAP). Mr. Swan and Ms. Culver are portfolio managers at MAP. The trio has worked together for nearly 20 years and average nearly 27 years of industry experience. They currently manage over $450 million in assets in two mutual funds and over a thousand separate accounts. Their work is supported by two research analysts.
Strategy capacity and closure
Mr. Dzialo puts the firm-wide capacity at between $3-4 billion with current assets under half a billion. He’s committed to closing the fund at any point that asset growth, either the total level of assets or the rate of inflow, impedes their ability to execute the strategy.
Management’s stake in the fund
The managers are lightly-invested in their two funds. While that’s not ideal, it is understandable. They presented these strategies in separately-managed accounts a decade before the funds launched. As a result, their investment in the strategy appears primarily through such accounts.
Opening date
July 29, 2011
Minimum investment
$2,500 for either the A or the institutional share class, reduced to $100 for accounts established with an automatic investing plan.
Expense ratio
1.23% after waivers on “A” class shares, 0.98% after waivers on “I” class shares. All on assets of $15 million, as of July 2023. “A” shares also carry a 5.75% sales load. Institutional shares, of course, do not.
Comments
Some firms are all about flash and headlines. Other firms are all about carefully, repeatedly executing their strategies. MAP appears to represent the latter group.
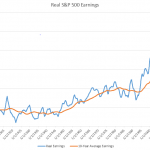
Since 1991, Mr. Dzialo and team have offered three strategies: U.S. equity, global equity and global balanced. The mantra behind all of those strategies is the same: the process must be transparent, disciplined and repeatable.
Portfolio construction begins by winnowing down the 15,000 securities available to the 40-65 in the portfolio. They run quantitative screens to immediately eliminate overvalued securities. That drops them to about 5000. They then target securities that will benefit from one of a handful of global themes they’ve identified; for example, they’ve been convinced since 2007 that excessive public and private debt will constrain growth. That drops them to about 1000. They next look at business quality (down to 200) and then for identifiable catalysts which will unlock the value in these well-run, well-positioned, undervalued securities. That leaves them with a portfolio of 40-65 names.
That element of the portfolio is complemented by short-term bonds, selective use of covered calls and cash. As with stocks, they tend to look for misunderstood bond issuers; by way of example, while JC Penney’s intermediate term bonds might reasonably be rated as “junk,” they have sufficient capital and cash flow to cover their short-term bonds. The fact that Penney is “a junk bond issuer” can then lead to mispricing of their short-term debt. In periods of high volatility, the managers can sell covered calls on up to 30% of the portfolio. That strategy generates consistent income. In steadier markets, the strategy is scarcely worth the effort and its role in the portfolio dwindles. Finally, they hold 5-15% cash depending on whether there’s an attractive opportunity set now or the prospect of a more attractive set in the near future.
On whole, it’s not very complicated which helps explain why it works.
And it does work. The Global TRI fund is one manifestation of MAP’s Balanced strategy. That strategy dates to 2001. Since then it has returned 6% per year compared to 3.9% for its global benchmark. Over time, that compounds to a significant advantage: $1000 invested in the Balanced Composite at inception would be worth $2400 as of June 30, 2016. A similar investment in its passive benchmark would have grown to $1700.
Similarly, $10,000 invested at the inception of the mutual fund would have grown to $13,100 by June 30 while its average world allocation peer would have returned $11,200.
More importantly, the Global TRI strategy has produced higher returns while exposing its investors to less volatility. Over the long term, the MAP Balanced Composite has a beta of just 0.69 compared to its benchmark and captures just 53% of the benchmark’s downside. The Composite has been around for 144 rolling 36-month periods (July 31, 2004 – June 30, 2016). It has never lost money over any 36-month period while its passive benchmark has had 22 negative periods.
Though we don’t have precisely the same calculation for the mutual fund, all of the measures of risk and risk-adjusted returns we track show the Global TRI fund beating its peers.
| APR %/yr |
MAXDD % |
Recvry mo |
STDEV %/yr |
DSDEV %/yr |
Ulcer Index |
BMDEV %/yr |
Bear Rating |
Sharpe Ratio |
Sortino Ratio |
Martin Ratio |
|
| TRXAX | 4.4 | -5.5 | 12 | 6.9 | 4.1 | 1.9 | 3.4 | 3 | 0.63 | 1.05 | 2.32 |
| Flexible Portfolio | 3.9 | -13.3 | 15 | 9.3 | 6.1 | 4.7 | 4.8 | 6 | 0.43 | 0.72 | 1.21 |
Translation: TRXAX has higher annual returns, a lower maximum drawdown, lower standard deviation, lower bear deviation, smaller Ulcer Index (a measure of the factors in both size and duration of a loss), higher bear market rating, and higher Sharpe, Sortino and Martin ratios. The actual numbers on the no-load TRXIX shares would actually be better because of its lower expense structure. Since those shares only launched in 2014, we chose to give the stats for the oldest share class.
That’s really good.
Bottom Line
MAP has been doing their work, and doing it very well, for 15 years. I’m impressed by their consistent performance and even more impressed by their focus; they’ve added no new managers, branched off into no new strategies, undertaken no splashy asset-gathering gambits. They seem proud to serve their over 500 clients – family offices, institutions, and others, many of whom have been with them for the long haul. It’s a disciplined process rather than a flashy strategy which is, we believe, an enormous strength. Folks interested in maintaining some equity exposure but anxious about the distortions imposed by giddy central bank policies and corporate managers obsessed about the short term, should spend some serious time learning about these folks.
Fund website
Catalyst doesn’t provide pages dedicated to their individual funds. Instead there’s sort of a pick-up spot where you can grab literature on all of the Catalyst products. MAP’s website, while not primarily dedicated to fund investors, is infinitely more interesting. Go there.
© Mutual Fund Observer, 2016. All rights reserved. The information here reflects publicly available information current at the time of publication. For reprint/e-rights contact us.