By David Snowball
Dear friends,
Hi. We’re back. Did you miss us? Chip and I greatly enjoyed our holiday in Scotland; she’s the tiny squidge in the middle of the picture, smiling and waving at you. This shot captures much of the delight of our time there. It’s taken from atop Dun Beag, the remnants of a 2,400 year old fortified keep near Struan, on the Isle of Skye. It’s on the edge of a pasture that stretches for miles, up mountains and down ravines. Sheep grazed all about it, studiously ignoring us. It looks out onto The Inner Seas that separate Skye from the Hebrides.


Chip adds, “And here’s our fearless leader, perched atop Dun Beag, enjoying the glorious views and perfect weather.”
We stopped and hiked here a bit on my birthday, on our way to dinner at the Edinbane Inn. I’d share a picture of our dinner, but then you’d drool on your keyboard and that can’t be good.
A few days later we staged our own Brexit, traveling from Glasgow to Newark. Shortly thereafter Ed, Charles, Leigh and I descended on the Morningstar conference while Chip was relegated to returning to her role as chief information officer for her college. (Strange. These people seem to want her to show up for work almost every day, even in summer! Barbaric New Yorkers.)
In any case, we’re glad to have gone and glad to again be sharing your company.
Morningstar Recap
It would be easy to come away depressed from the Morningstar conference. Attendance was down (845 advisors paid to attend while one of the Morningstar folks recalled last year at 1100). The exhibitor’s hall seemed smaller and subdued. Panel attendance was inconsistent and much of the discussion seemed to focus more on threats (from robo-advisors, passive products and the new fiduciary rules) than on opportunities. Heck, even the coffee seemed weaker than before.
 |
 |
|
My colleagues detected some disquieting parallels between this year’s subdued Morningstar conference and the ruins of the Elgin Cathedral.
|
And yet there are grounds for optimism. Charles Ellis’s renowned The Loser’s Game essay (1995) predicted the current state of events, in which fewer and fewer managers could separate themselves from the herd and make a compelling case for entrusting your money to them. The fundamental problem, he noted, was not too little talent in the industry, it was too much talent. It was easy to be an investing legend when you were competing against a bunch of crusty yahoos who were committing money based on hunches, rumors and impulses. It’s hellishly harder to do so when you’re competing against hundreds of well-trained, disciplined competitors. Ellis points, in particular, at the folly of performance investing: that is, defining your success as “beating the market,” a nearly impossible and utterly irrelevant objective. In a series of later essays, Ellis stressed the importance of relationships. He views success as likeliest when an investor understands his clients, earns their trust, takes a long view and helps them stick with the plan.
That’s hard. And it might be harder – perhaps impossible – for many of today’s investors who are bright but are the wrong kind of bright. There are a bunch of folks who are conventionally bright. These are folks who are very good at sticking with the plan. They’ve been taught a system and they’re very good at executing it; they read balance sheets, discount future cash flows, hug their mean variance optimization software, think themselves bold when they tweak one of the variables and feel quite entitled to six- and seven-figure compensation.
They are The Herd. They’re a very bright herd, but a herd nonetheless. They fall somewhere in the range of anachronistic, irrelevant and doomed.
But then there are The Others. The great virtue of the Morningstar conference, and one of the greatest gifts that working with the Observer affords, is the ability to talk with (heck, mostly listen to) remarkable people. That roster most recently included Rupal Bhansali, Abhay Deshpande, Andrew Foster, Teresa Kong and David Marcus. These folks aren’t just bright, they’re scary bright. More importantly, they’re the right kind of bright. Their perspectives and experiences are unusually diverse. They’ve succeeded, and they’ve failed. They don’t get puffed up about the former and don’t seem threatened by the latter. They’re willing to be different, even at the risk of being wrong. They say more interesting things in ten minutes than most of their peers manage in a day. They’re thinking about things that escape their peers. Above all, you get a real sense that their minds are engaged. They listen attentively, sometimes even fiercely, to the folks they’re talking with; they listen to understand, not merely as a polite gesture before launching into some canned response that only half fits.
They leave me feeling energizing, enlightened and hopeful. That’s rare.
For now, we’ll share some highlights from those conversations. In the months ahead, we’re hopeful of profiling their new funds and of renewing the profiles we’ve already shared.
Michael Hasenstab, The 5-year anchors
Dr. Hasenstab is the head of global fixed income for Franklin Templeton and manager of both Templeton Global Bond Fund (TPINX) and Templeton Global Total Return Fund (TGTRX). He’s been with Templeton since 1995, exception for a sabbatical during which he earned his PhD. Both of his funds have vastly outperformed their peers since inception but both are wildly independent of those peers. By way of illustration, his exposure to the U.S. market is about on par with his exposure to Uruguay. As a result, he’s prone to periods of beating 95% of his peers followed by trailing 90%. They are, Morningstar opined, “the boldest funds” in their category.
Mr. Hasenstab offered three projections around which he is anchoring his portfolios.
- The U.S. dollar will rise in value. Prime Minister Abe needs a weak yen to stimulate Japanese growth. The euro and pound are both at risk. “Europe is held together by political will, not economic realism. Brexit reflects the erosion of that will.” In contrast, the US is near full employment with a lot of openings going unfilled. That’s created a bit of upward wage pressure which pretty much eliminates the risk of deflation. The currency market is priced for deflation while he sees inflation of as much as 3% by year’s end.
- U.S. Treasuries are a disaster. Treasuries have been propped up by international buyers, mostly Asia or OPEC, who needed to find something to do with their trillions of excess US dollars. The oil price collapse and a sputtering Chinese economy have pretty much put an end to such buying. Treasury yields could drop to European levels; that is, zero or below.
- Emerging markets are wildly undervalued. These are opportunities he hasn’t seen in a decade. In particular, he believes China’s position is misunderstood. China has traditionally been a manufacturing/export driven economy. With changing internal demographics, they’re now much more dependent on service sectors. The rise of those sectors should eliminate the prospect of “a hard landing.” If that occurs, emerging markets currencies are wildly underpriced.
Not all emerging markets have equally rosy prospects, so he’s calling for “a rifle, not a shotgun.” I imagine that’s a swipe at ETFs. Venezuela, Turkey and Argentina are all in trouble. Mexico, Ukraine and even Brazil are all places where positive developments are being ignored.
His funds have suffered lately from their vastly higher emerging markets weighting than their peers. Given that Mr. Hasenstab has been pretty good at this, I wouldn’t be surprised if that overweighting leads to a substantial rebound.
The Arnott & Asness Show
One of the headline acts was a moderated exchange between Rob Arnott of Research Affiliates and Cliff Asness, the “A” of the AQR Funds. This was sort of the epitome of a tired walk-through. There were two problems. First, it was clear that the guys had been through this a dozen times before so it occasioned no sense of engagement from them. Second, the conversation very, very quickly devolved into minutiae that almost no one in the audience could (or cared to) follow. Within five minutes, the folks around me were glued to their phones and tablets.
Arnott’s best argument is that there’s no intrinsic magic in low vol/low beta/smart beta investing. While volatility might have some enduring predictive value, it won’t work if you overpay for the underlying securities: “price matters hugely. To win with smart beta, check the price.”
Asness was even more skeptical of low beta strategies. He wants, he says, to say both data and a compelling story that helps explain the data. In the case of low beta investing, “it’s hard to explain why it works.” His review leads him more to favor small and quality.
Of course, he’s also the guy who announced, “I pride myself on not knowing what’s in my portfolio,” which makes the whole “need to know the story” thing odd.
Teresa Kong, “look at the numbers”
Teresa Kong is the incomparable leader of Matthews Asia Strategic Income Fund (MAINX) and of the newly-launched Matthews Asia Credit Opportunities Fund (MCRDX). She is, in a literal sense, incomparable: no other publicly-available fund does what she does. Aberdeen Asia Bond (AEEAX) is closest and she’s roughly tripled their return; they’re up 8% and she’s up 21% since launch.
Three conclusions stood out from our conversation. First, she’s very risk-conscious and able to hedge away some risk. With the new portfolio especially, she’s trying to let fundamentals rather than currency fluctuations drive returns. Second, Asian credit and high yield markets have been remarkably strong, largely invisible performers. Over the past 15 years, Asian high yield bonds have returned three times as much as US stocks with one-half of the volatility; they’ve been the highest performing asset class in the world but no one notices. Third, given current valuations, there is an exceedingly high probability that returns over the next three years will average 10-15% annually. Starting from these levels, Asian high yield has never earned below 8% in the succeeding three year period. That argument is documented in Riding the Credit Cycle – Is It Time to Buy? (2016).
Abhay Deshpande, a sense of exceeding calm
Abhay Deshpande had been managing about $100 billion for the First Eagle funds. He struck out last year to start his own firm and just launched two funds whose approach parallels that in his old charges.
Our conversation was somewhat delayed and somewhat brief. With the funds newly launched, there wasn’t yet much specific to pursue. That said, I came away with two strong impressions. First, Mr. Deshpande is confident and centered. He projects a sense of thoughtful calm. Second, he is deeply skeptical of ETFs. Like many managers, he allows the index funds are likely a valuable tool for most investors. ETFs, on the other hand, are pernicious because they encourage trading and trading encourages our worst impulses. SPY, for example, tracked the S&P 500. There are about 850 million shares outstanding and average daily volume is about 130 million shares. That means the average holding period for a share of SPY is 6.5 days. He is particularly irked that “active underwrites passive.” That is, actively managed funds pay a distribution fee to places like Schwab, reputedly around 40 basis points. ETFs get to boast of low expenses because they trade on those platforms but aren’t assessed those fees.
Mr. Deshpande argues that the key to long-term success is risk-management, which he keeps in the center of his disciple. ETFs, on the other hand, encourage impulsive risk-taking and the consequences of following those impulses might not be understood until it’s far too late.
Andrew Foster, ”I hate my portfolio”
As Observer readers know, we regard Mr. Foster as one of the industry’s premier figures. He left his long-time post at Matthews Asia to launch “a new kind of mutual fund,” one that it obsessively committed to partnership with its investors. That translates to consistently lowering expenses when circumstances permit (sometimes more than once a year), communicating clearly and copiously, and managing your money as if it’s his own. (With millions in his funds, it is his own.)
Charles and I had the opportunity to spend an evening with Mr. Foster, eating well and talking at length. Part of that conversation is reflected in our discussion, below, of Seafarer Overseas Value. In response to a reader’s question about capacity in his flagship fund, Mr. Foster allowed that he could probably manage $4 billion or so, that he would almost certainly soft-close at half of that amount, that he would explore other options to manage fund flows and that he hoped never to have to hard-close it.
He thinks the new fund makes sense, he held off launching the fund until he thought he had a manager capable of excelling and has invested at least $1 million of his family’s money in it. We’re hopeful of speaking with Mr. Espinosa in the next several months but we really wanted to give him time to begin settling into his new job before we bugged him.
In a public presentation at Morningstar, Mr. Foster demonstrated his hallmark openness about his portfolio. He’s looking for “companies that will survive crises,” so he starts with the negatives and tries to track down everything that could possibly go wrong with every firm he’s considering. Since so much is unforeseeable, he’s prone to “diversify the heck out of it” and “over-concentrate on things that seem cheap.”
Rupal Bansali, “we eliminate ideas”
Rupal Bansali has managed both Ariel Global (AGLOX) and Ariel International (AINTX) since 2011. Over its lifetime, Global has modestly underperformed its peers with noticeably less downside while International modestly outperformed its peers (6.9% annually to 6.6%) with substantially less downside volatility. Before that she managed MainStay International (MSEAX) from 2001-2011. During her watch, the MainStay fund gained 97% while its average peer rose 61%. The fund posted top 1% returns in 2008. She began her career with the Oppenheimer Funds in the 1990s which she left when they were bought out by Allianz. (“I’ve never wanted to work for an insurance company.”)
Ariel represents Ms. Bansali’s third set of funds. In each case, she’s built a new research team (anti-poaching agreements were in place) and has encountered considerable success. Morningstar highlighted her as one of this year’s three “virtually undiscovered” international managers that they’re now paying greater attention to. International is currently a five star fund while Global has earned four.
Charles, Ed and I had an engaging but as-yet incomplete interview with Ms. Bansali. We met just at the end of the conference, things were running late and she had a fairly short opening. We hope to continue the conversation by phone during July, then provide a full profile of AINTX in August.
The most striking characteristic of our conversation was her insistence on maintaining an emotional distance from her portfolio (“we don’t ‘love’ any of it”) and focusing on what might yet go wrong.
- India is a trap. The consensus among analysts is too favorable. On this, I’m distinctly non-consensus.
- In building a portfolio, we eliminate ideas. We actively seek reasons to reject possible holdings, rather than to include them.
- You can’t make money on a consensus trade, only on the lonely ones. Investors love “heady” growth, but we strongly prefer “steady” growth instead. Microsoft is an example. People gave up on Microsoft, mostly because they labeled it a tech company and wouldn’t accept anything less than “heady” growth for it. Instead, Microsoft offers steady growth and, since 2012, has been a much better performer than Apple. (The accompanying chart shows Apple up 62% since January 2012 while Microsoft is up 87%.)
- I’ve made so many mistakes already that I simply don’t worry about keeping my job.

Morningstar Conference: Grasping at Straws, Department of Labor’s Fiduciary Rule, and Vanguard CEO McNabb
 During our annual (sometimes bi-annual) excursion to Chicago this past month, I was reminded of the old adage:
“We see things not as they are but as we are–that is, we see the world not as it is, but as molded by the individual peculiarities of our minds.”
Quickly followed by:
“It’s better to be uninformed than misinformed.”
Company President Kunal Kapoor started the first day general session by showing Morningstar’s Market Fair Value metric … “It says the US market is fair valued.”
Gold-star fund manager Michael Hasenstab of Templeton Global Bond (TPINX) stated that “we are at a pretty rare point in markets where you have huge dislocations … unprecedented and untested monetary policy experiments creating tremendous amount of volatility.” The Fed will inevitably be raising rates, due to inflation and a labor market with little or no excess capacity. He is negative US Treasuries (“valuations nowhere near justified”), but sees “real upside opportunities in select emerging markets … the most unloved asset class.”
Later the same day, famed author and investing advisor Bill Bernstein stated that “I do find foreign equities valuations more attractive. Of course, there is good reason for that. Stocks don’t get cheap without good reason.”
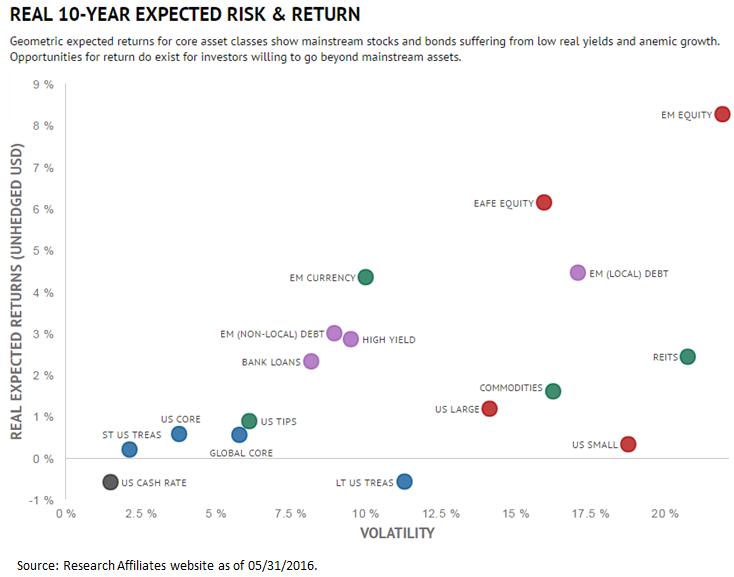
The day two general session featured a polite debate called “Meeting of the (Big) Minds: Arnott and Asness.” Mr. Arnott’s firm Research Affiliates maintains an Asset Allocation site that provides 10-year Expected Returns across various securities and asset classes. The bottom-line: near zero real return expected for traditional asset classes. “Valuations matter,” he explains. He sides with Professor Shiller that US equities based on historical norms are currently overvalued.
During a sidebar with Tadas Viskanta, founder and editor of Abnormal Returns, he offered his impression of the conference: “Grasping at straws…”
Our colleague Ed Studzinski later added: “Half the people in this room will not be here five years from now.”
How many people were there? 2016, including 831 paid advisors, 581 exhibitors, and 43 speakers.

Why might Ed think the attendance will be under pressure? I’ll offer two reasons: The Department of Labor’s (DOL’s) Fiduciary Rule and Vanguard; basically, the two elephants at the conference.
As background, please reference:
- Fact Sheet – DOL Finalizes Rule To Address Conflicts of Interest In Retirement Advice, Saving Middle-Class Families Billions of Dollars Every Year.
- “Why Vanguard Will Take Over the World,” by our colleague Sam Lee from October 2015 commentary.
The new fiduciary rule requires investment professionals, consultants, brokers, insurance agents and other advisers “to abide by a fiduciary standard—putting their clients’ best interest before their own profits.”
Patrick Clary, Chief Compliance Officer at AlphaArchitect (former USMC Captain, a Harvard MBA, ops/complinance ninja) puts the meaning of fiduciary in proper perspective in the insightful March 2015 post “Distribution Economics – Understanding Wall Street’s Conflict of Interest Problem”:
Fiduciary responsibility matters in financial services more than in any other product category outside of urgent medical care. Shouldn’t this fiduciary have your best interests at heart? Just as you don’t want your doctor to receive kickbacks from Pfizer for overdosing you on Oxycodone, why would you want your financial advisor–or their institution–to receive kickbacks for overdosing you on inefficient, overpriced, investment product that probably won’t help you achieve your investment goals?
HBO’s John Oliver recently gave a more humorous but no less accurate account (click on image to play YouTube video):

In the same session where Bill Bernstein spoke, Morningstar’s Don Phillips warned the fiduciary rule will usher in an “era of blame … litigation heaven.” And in fact, several groups have filed suit against implementation, which is scheduled to become effective initially April 2017, with final compliance required by 1 January 2018.
During the conference break-out session “The Fiduciary Rule and the Future of the Industry,” analyst Michael Wong presented an assessment of impact of rule on financial industry:
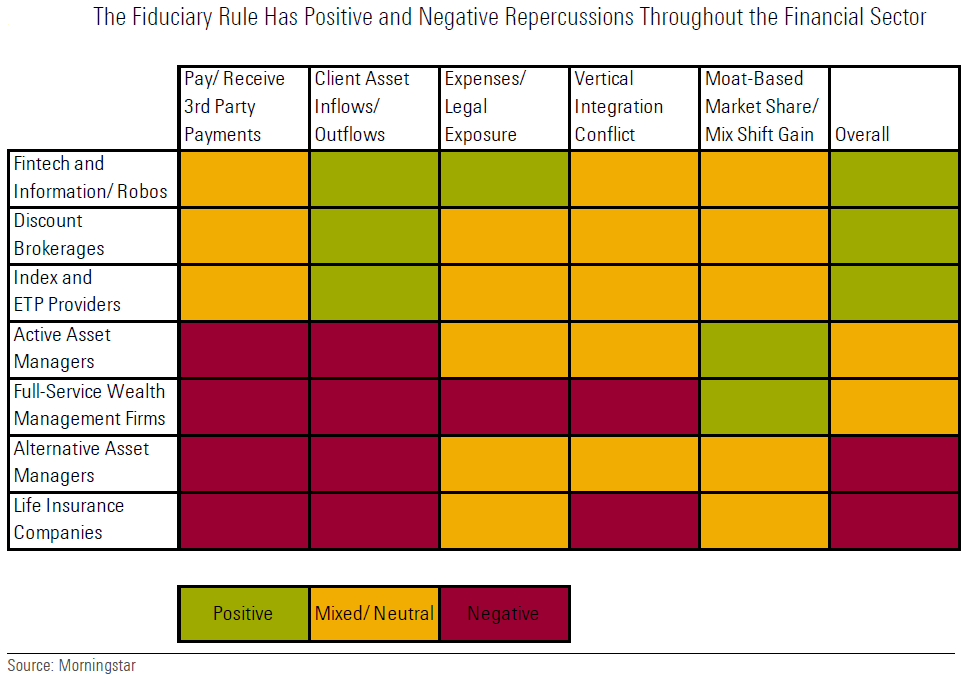
He predicts three main trends:
- The movement to fee-based from commission-based full-service wealth management accounts.
- Adoption of robo-advisors and digital advice solutions.
- Shift to relatively lower-cost passive investment products from actively managed.
Morningstar was kind enough to share the session’s presentation charts, here.
Here is a telling example of landscape investors face today. Lipper identifies 42 funds in the category “S&P500 Index,” oldest share class only, at least three months old, as of May 2016. The expense ratios range from less than 20 basis points for funds offered by Vanguard, State Street, Schwab, Northern Funds, Fidelity, Blackrock, and DFA to nearly 60 basis points and higher for funds offered by Legg Mason, Great-West, and Nuveen.
Hard to see how any advisor “acting as a fiduciary” could recommend the funds with the substantially higher expense ratios.
Lipper shows 693 US large cap equity funds, but exclude the S&P Index and other index funds, the number is 532. There are more actively managed large-cap funds than stocks traded in the S&P500! Some industry experts believe the fiduciary rule will help flush out “closet indexers.”
Similarly, Lipper shows 2,447 US Equity funds, which is nearly as many funds as there are equities in the Russell 3000 Index, representing 98% of the US public equity market. How can that be? David is fond of enlightening us: “… 80% of all funds, active and passive, could vanish without any loss to anyone other than their sponsors.”
Maybe Ed has underestimated.
Michael Wong reports: “We’ve already seen the exit of several foreign banks (Barclays, Credit Suisse, Deutsche Bank) from the U.S. wealth management landscape, sale of life insurance retail advisory businesses (AIG, MetLife), and restructuring of wealth management platforms (LPL Financial, RCS Capital, Waddell & Reed) in anticipation of the rule.”
At the same session, Morningstar Australia’s Anthony Serhan stated that the rule, which effectively imposes “fiduciary” criteria in place of “suitability” criteria currently practiced, will help force brokers and fund companies to unbundle their proprietary products from financial advice. The rule will bring more transparency … like turning on a light in a dark room. Serhan warns: “Put decent value on table or be challenged.”
One fund manager speculated that brokers will likely switch to using Morningstar ratings instead of their own “Select Lists” or “Preferred Lists” currently practiced.
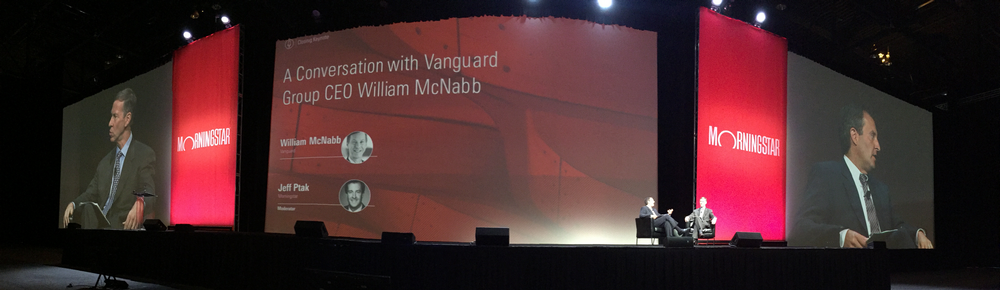
On day three general session, Vanguard CEO Bill McNabb encouraged advisors not put off implementation of DOL’s fiduciary rule because of current lawsuits … will take 12-18 months to implement required processes so “prepare as if court cases will not be successful.”
The new fiduciary rule will only help to advance Vanguard’s already dominant position. Of the 9,360 US mutual funds through May, excluding money market and funds less than 3 months old, Vanguard has five of the top six funds by assets under management (AUM):
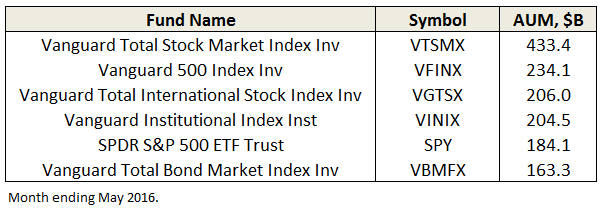
It has 36 funds in the top 100. It has $3.4T in AUM. Our MFO Fund Family Scorecard shows 76% of Vanguard’s 164 funds have beaten their peers since inception.
Its fees are amongst the lowest in industry. Its robo-advisor, Vanguard Personal Advisor Services VPAS, has quickly gained $40B in AUM mostly from existing Vanguard customers.
Mr. McNabb stated VPAS targets accounts between $50 – 200K and charges 30 bps points versus the 1% charged by most advisors. His advice to other advisors: “Go lower or do more.”
Going forward McNabb’s vision for Vanguard in 2026 “will be a far more global firm … where we really run all of our investments on a global basis.” Only $300B of its AUM is from non-US clients. He sees tremendous demand for Vanguard products globally and meeting that demand will be “the most profound change in Vanguard over the next decade.”
On the product side, he sees making more tools available to advisor community, particularly to help manage the “drawdown phase” facing retired baby boomers. And also sees simplification of services … vibrant applications for mobile and a move away from PC-based tools.
While enjoying deep dish pizza after the conference at the famed Giordano’s and then stroll afterward to walk it off up Michigan Avenue to Chicago’s magnificent Millennium Park, our colleague Sam Lee pondered that scandal would be the only threat to Vanguard’s continued dominance.

The Black Swan of Brexit
“A bank is  a place where they lend you an umbrella in fair weather and ask for it back when it starts to rain.”
Robert Frost
By Edward Studzinski
The title of this month’s piece probably leads one to expect that I will be writing a review of a circa-1930’s costume drama film, set in either 15th century England or France, starring Tyrone Power, etc, etc. Sadly, the time is today. And while many of the players act like fictional characters in terms of temperament and self-interest, unfortunately they are not.
I expect many of my colleagues, especially David, will have a lot more to say about BREXIT than I, but I do think the matter of it as a black swan event is critical. In recent years, many have thought about the United Kingdom as one country, especially after the Scottish secession vote was defeated, without realizing that economically it was many. You have the city state of London and southeastern England, an area that rivals Renaissance Florence as a center of commerce, trade, wealth, culture, and the arts. And then we have the rest of England, which includes the southwest as well as the impoverished former industrial north of Manchester and Yorkshire, an area of high unemployment and rather daunting poverty. Similar segmentation plays out in both Northern Ireland and Scotland. So, the surprise is not that 52% of the population, in a 70% plus voter turnout voted to leave the EU, but rather that the politicians and pollsters got it so wrong.
At this juncture I will spare you the history lesson, but suggest that some digging, especially with attention to The Hundred Years War, will give you a greater appreciation of the back and forth between England and the Continent over a thousand years. And for those who keep making a comparison between the events of today, especially the rise of economic nationalism, and the events of the 1930’s, I will suggest that a more apt comparison is the 15th and 16th centuries, where you had the continuing conflicts between England and France, France and Burgundy, and the economic rivalries of the Italian city states of Florence, Genoa, and Venice. You also had the fall of Constantinople and then Trebizond marking the end of the Byzantine Empire concurrent with the rise of the Ottoman Turks and their empire. And while politics and religion were given lip service as to the primacy of place, the real drivers of events were economics, trade, and the greed for greater personal wealth.
So what investment conclusions can one draw from BREXIT? It is far too soon to tell. Obviously there is and will continue to be a ripple effect, which has already begun in terms of increased market volatility and dislocation. There will be winners and losers, in terms of economies and businesses. At the same time, knee-jerk reactions, either to sell investments or make new investments, are to be avoided. Those who liquidated investments in the first days of a global sell-off have probably realized losses that would not have been losses had they waited a few days longer. Those who ran in and purchased things such as European banks (thought to be undervalued before the BREXIT results) find that that they are still cheap and may become even cheaper. Over the last several months it had become clear that a number of large European banks were going to need additional help from their central bank counterparts. We see then the announcement in the last few days that one of the greatest potential sources of systemic risk to the financial system is Deutsche Bank.
In terms of real assets such as property and commodities, the fog of volatility is even thicker. I have a friend who is in the process of relocating from the UK to Switzerland, an unwinding that has been going on since the beginning of the year. The last piece was to be the sale of a home in London. The higher- end London market had already been somewhat toppy this year, with slowing sales. So, the process was dragging. This week she told me that as a result of last week’s vote, the market price that she had been expecting has dropped by 25%. In terms of commercial real estate, the short-term dislocations should be equally as great. London may appear to be a loser and locations such as Dublin, winners. Alternatively, if the British find their footing and resume being a trading and finance center for Africa and Asia, the property dislocations may be short-lived. At this point no one knows. And once again, investor time horizons matter.
A 25% move in real estate prices in one week is huge, and not easily recovered. Similarly, we saw a huge move in currencies last week, in particular the British pound sterling, by what, 15%, in a very short period? In markets which are zero sum events (for a winner there has to be a loser), we should be looking for some failures or liquidations to be announced in coming days.
And Now For a Word From …..
This brings me to a thought which will surprise many of you, given my previously expressed preferences for low cost, index products for most fund investors. This is almost the ideal environment for the active, long-term oriented value manager. The issue becomes finding that active manager who will put your interests first, above that of career and firm.
At the beginning of June, we were seeing active managers’ performance trailing the index funds (again). A friend related to me a conversation he had had with the director of equity research at an investment management firm that was seeing consistent outflows because of index-lagging performance for the year-to-date, one year, and three year periods (not surprising as most investment and financial consultants have a much shorter investment time-horizon than the one they advise their clients to have). This individual told him that even if the outflows continued and the assets under management dropped to X billions of dollars, he would not be concerned as there would be “more than enough money to go around.” So recognize the priorities here, which were on self-interest.
This is the humorous aspect of seeing presentations from investment firms about eating their own cooking, when the true focus is upon how much can be taken out of the business. For those who think these are random situations rather than episodic, I commend you to an article entitled “For the Love of Money” by Sam Polk which appears in the Sunday, January 19, 2014 Sunday Review section of the Sunday New York Times. The piece discusses the concept of “money addiction” and starts with this sentence, “In my last year on Wall Street my bonus was $3.6 million and I was angry because it wasn’t big enough.”
Think about it. The compensation of a Fortune 100 CEO is disclosed. All-in someone may get a combination of salary, bonus, benefits, and option/stock compensation tied to profitability that may come to perhaps $20 million dollars a year. This is a business with billions of dollars in revenue and profits, thousands of employees, and its performance can have a major impact on the national and global economies. Contrast that with the fund manager whose compensation all-in, for managing $40 billion of assets is $30 million dollars a year, she or he has perhaps forty employees and an economic footprint that is far less. And of course, the $30 million dollars a year is part of a shell-game that is played so that trustees of fund organizations see perhaps a $5 million dollar compensation number for the manager, with other amounts categorized as “ownership interest in the firm” or “long-term compensation pool” etc., etc. But wait, the firm is a wholly-owned subsidiary of an asset-gathering fund company? And people are surprised by how much support politicians like Sanders and Warren have garnered?
There is another game going on here as well, and that is on the parent side of such organizations.
I recently had a conversation with someone at an asset-gathering firm where we talked about the dislocations and shut-downs in the hedge fund and mutual fund industry. This person said to me, look, it is all about leveraging our distribution platform to gather assets. If the assets under management at a subsidiary don’t grow over a five to ten year period, we are going to either offer to sell it back to the subsidiary managers or shut it down. We are not in business to not make money for our shareholders.
I related this conversation to a West Coast-based fund manager who said to me, this explains why a friend of mine at another firm was faced with the choice of mortgaging his home and signing away his life. He was presented with the choice of repurchasing his firm at the price dictated by the parent or being shut-down. Depending on the state where you are doing business, you may face rather dire choices. California of course, has made non-compete agreements illegal. Not so, New York and other jurisdictions.
This brings me to my final point this month. There is a storm brewing that will sweep over the mutual fund business as we know it. The proposed rules from the Department of Labor which will make the financial advisors, the platform companies, and the funds fiduciaries will effect drastic change. On its face, the idea that an investment should be suitable for those purchasing it and the fees disclosed for that investment would appear to make sense. And yet the rules are being fought tooth and nail by the industry.
Have you ever wondered about the economics of purchasing funds through a discount brokerage account where there is a no-transaction fee fund supermarket? Who gets paid and how? Are we talking about billions of dollars here in profits to the discount brokers? Are we talking about the ability to gather assets in funds that would not be able to so do otherwise? What do those 12(b)1 distribution fees you see in the prospectus for distribution really amount to over time? How do they impact the long-term returns on your fund investment? This is the tsunami that is coming.
Liquid Alts: The thrill is gone
By Leigh Walzer
The tone of the 2016 Morningstar conference was decidedly subdued. Attendance was down sharply. Keynote speaker Bill McNabb of Vanguard took a “victory lap” to mark another year of rapid growth for passive funds. Active equity managers continue to get pummeled by outflows and rising distribution costs. These forces may have slowed in 2016 but the shakeout continues. Purveyors of actively managed funds are either reluctantly jumping on the ETF bandwagon or seeking defensible safe-havens like fixed-income, smart beta, and liquid alts.
Liquid Alts: Explained
Liquid alts received a lot of positive attention at the 2015 Morningstar Conference – and negative attention this year. Liquid alts are funds pursuing alternative investment strategies and offering daily liquidity. In other words, these are hedge funds marketed in “40 Act” garb. Generally, investors look to alternative investments to deliver returns with below average market correlation.
Common investment strategies include Long/Short Equity, Long/Short Credit, Market Neutral, Managed Futures, Event-Driven, and Short-Selling. Fund managers can reduce risk by selling one security against another, hedging, or buying derivatives. Some are trying to deliver a market neutral return; others are trying to outperform an equity or fixed income benchmark with lower volatility. Sometimes the distinction between categories is a little blurry.
We identified a liquid alt universe of approximately 500 funds. Morningstar tracks 650 so either they use a more expansive definition or our “universe” has a few black holes. We apply two main criteria: (a) the fund describes itself or is widely categorized as an alternative strategy (b) in our assessment, it acts like an alternative fund, meaning we can’t replicate the returns using traditional strategies. We count approximately $280 billion of liquid alt assets under management.
Two thirds of these funds are single strategy, the balance are MultiStrategy. Fund of fund and sub-advisory structures are not uncommon. Some liquid alt vehicles offer investors performance which is pari passu with hedge fund classes. Others offer a separate account which may have tailored guidelines or a risk management overlay. For example, one of the fund managers we spoke to noted that he asked his subadvisors to dial down European risk before the Brexit vote. Implementation of alternative strategies in “40 Act” formats requires higher balances of cash and liquid assets – particularly for the pari passu offerings – which is a drag on returns. A few funds pay performance fees to subadvisors.
Even purveyors of these funds concede there is confusion in the marketplace about the proper role for these funds in investor portfolios. Nonetheless, the liquid alt industry has boomed over the past 8 years. The allure for investors has been access to strategies previously available only in hedge fund format. According to GSAM, Liquid Alts outperformed equity by 23% and fixed income by 16% during bear markets. The allure for fund companies has been an infusion of new assets earning higher expenses. The average expense ratio for long/short equity is 174 bps. Established managers who can raise money at 2 and 20 may not participate, but there are plenty of second-tier managers ready to step in.
The success of liquid alts has attracted a lot of new entrants. 45% of liquid alt funds are under 3 years old. (Our data for this article runs through April 30, 2016.) But the new funds have ramped slowly: only 13% of the industry AUM are in those new funds. Growth stalled a year ago. Judging from the number of funds and the assets they attracted, the greatest interest is in Long/Short Equity and MultiStrategy funds. The biggest players in our database are BlackRock, GMO, AQR, Pimco, JPMorgan, and GSAM. Some of the industry giants like Fidelity and Cap Re have been notably absent.
Recent Results
Despite the surge of interest (or perhaps because of it) results from liquid alts have been rather disappointing. Skill as measured by FundAttribution.com for liquid alts in the aggregate has been -1% per year over the past 36 months.
Maybe the free lunch of strong and uncorrelated returns doesn’t exist after all
The biggest negatives, not surprisingly, are Short Sellers, Commodities, and Momentum. Global Macro, Credit Focused, and Absolute Return also did poorly. Event Driven and Low Volatility strategies fared best while Market Neutral, Long/Short Equity, Long/Short Credit, Currency, and MultiStrategy had a modicum of skill. These are measures of excess return corresponding to the sS measure (explained here) on the www.fundattribution.com website. (Mutual Fund Observer readers may register for a free demo. Currently, demo users can access funds in the Market Neutral and Large Value categories.)
Our sS measure adjusts the gross return of these funds for any return from equities, fixed income, commodities, or currency which we could have mathematically replicated with passive indices. Other metrics may assess skill differently. For example, alt funds (particularly Futures strategies) show slight pickup from Beta which might offset the negative skill. One way of interpreting our findings: as these strategies have gotten crowded, the performance which fueled interest has evaporated; and the cost of offsetting or hedging away risk exceeds the benefit.
Results by Strategy
Over the past 10 years, the Morningstar Market Neutral sector composite generated a return of only 0.5%. The Long/Short Equity sector, which takes more market risk, returned 1.5%. Maybe the free lunch of strong and uncorrelated returns doesn’t exist. But those sectors did show fairly good returns prior to 2006
Our take is that returns in Liquid Alts are governed by supply and demand. Just as individual managers have limited capacity, returns for the strategy suffer when too much money rushes in.
Managed Futures showed excellent returns through 2009 and poor results ever since. From what we can discern, this strategy tracks mainly commodities and currencies. While the funds are supposed to go both long and short there is a significant correlation between the category and the Barclay CTA Index. So when commodities suffer, it is hard for this strategy to work. These funds rely heavily on momentum and trend-following, a strategy which has been challenging of late.
Many hedge funds seek investments with asymmetric risk. And many strive to capture most of the market in bullish periods while declining less in a down market. However, our preliminary work suggests the major liquid alt strategies haven’t delivered on this promise. For example, using Morningstar data, the Long/Short equity category captured 41% of the upside of the S&P500 as compared with 61% of the downside.
Individual Liquid Alt Funds
Even if the market as a whole has become efficient, there is a wide range of returns among liquid alt funds. The standard deviation of sS is 3.3% for liquid alts (higher than for other asset classes we studied). See Exhibit I. So even if sector returns disappoint, we can try and identify individual funds poised to outperform.
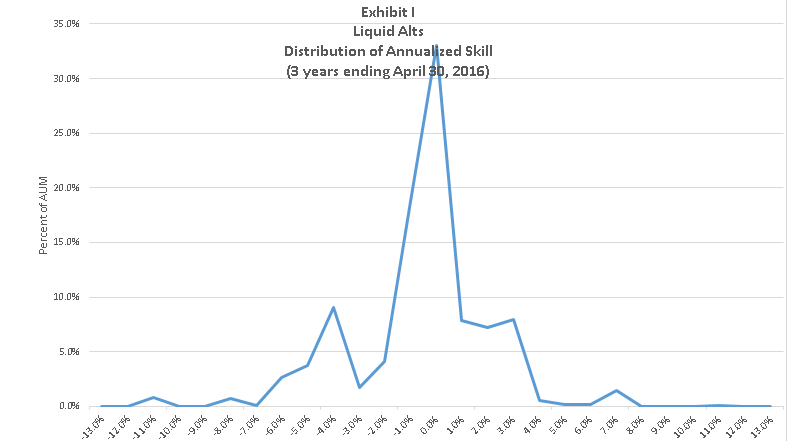
Exhibit I
FundAttribution is a great starting point for comparing liquid alt funds. Funds in the same category may have very different correlations and factor exposures; but our metrics normalize the impact to permit clean comparisons. Even the drag from holding extra liquidity can be isolated.
For example, AQR Managed Futures Strategy (AQMIX) returned roughly 3.6% (4.7% gross return) on an annualized basis from inception through 3/31/16. We estimate that without directional bets on commodities and currency, that return would have declined to 2.6%. That return is fully explained by the fund’s exposure to credits markets. So we don’t ascribe any skill to the manager.
Here are some funds which show well. Some had strong sS over the past 3 years in relation to expense ratio. Others have done well over a longer period. Not all of these made the Trapezoid Honor Roll (implying 60% confidence that next year’s net return will be positive.) Some don’t have enough track record and others are too small.
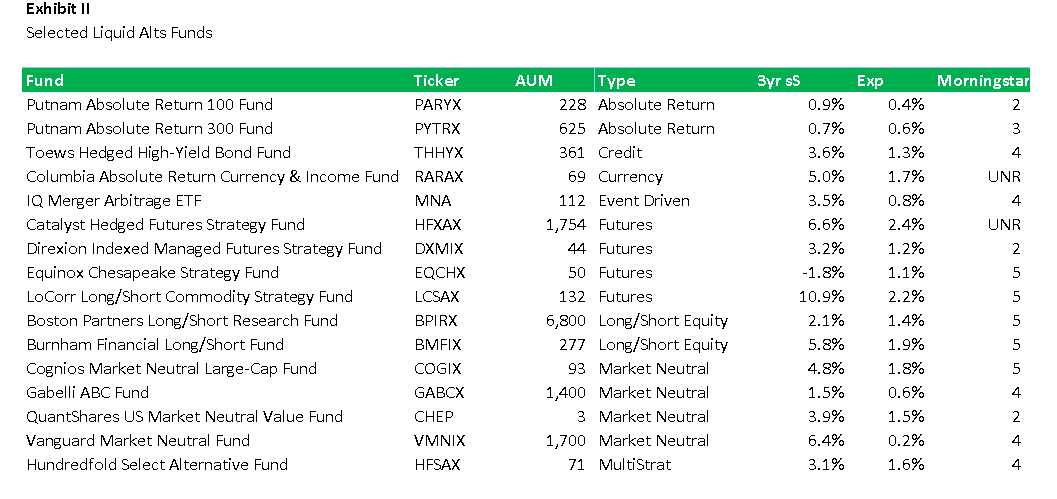
Exhibit II
One Honor Roll fund is Vanguard Market Neutral Fund (VMNIX). The fund has been around since 1998, costs are very low. (The minimum investment is $250k.) Around 2007 Vanguard replaced the subadvisor with its own Quantitative Equity Group; since then sS has been exceptional. Most of the return is based on buying stocks cheap using fundamental analysis and selling expensive stocks in the same sectors. The investment process is systematic but human judgement plays an important role. The strategy has grown from $0.3 billion to $1.7 billion over the past 18 months but there appears to be plenty of remaining capacity. Much of that growth has been through Schwab. We also observed an independently managed liquid alt parking its excess cash in VMNIX. Investors who register for the demo can access additional analysis of VMNIX and other Market Neutral funds at www.fundattribution.com.
The eight largest liquid alts in our universe registered negative sS over the past 3 years. One large player which has performed well is Boston Partners Long/Short Research Fund (BPIRX). Historically, net exposure has been 40 to 60%. BPIRX is closed to new investors. Boston Partners Global Long Short Research Fund (BGLSX) is currently open. We do not publish metrics on BGLSX because the management team has been on the job less than three years.
Event Driven has been one of the stronger liquid alt categories in recent years. For investors who want exposure, IQ Merger Arbitrage ETF (MNA) is a passive ETF managed by NY Life. which goes long announced deals and hedges out market risk by shorting equity indices. The event-driven category encompasses many strategies; this is one of the more vanilla. Demand in this category has been relatively stable which may have aided returns while supply (M&A volume) was robust. But M&A activity may be poised to fall.
New SEC Rules
The rapid expansion in liquid alts has not gone unnoticed by regulators. The SEC has moved recently to regulate use of derivatives by mutual funds, which it views as a form of leverage. A draft rule 18f-4 was circulated December 2015 and industry comments were submitted in March. An industry association estimates that funds managing $600 billion would be impacted by the rule. One of the nettlesome provisions would regulate leverage based on the gross notional value of derivative positions. A coalition led by AQR and John Hancock seeks to modify the rule. They note some asset classes like currencies and futures can sustain higher leverage. Among other things they want the limitations to reflect the value at risk, relax requirements to post cash, and give greater leeway if a fund temporarily exceeds the ratio. We also observe that funds like AQMIX have many offsetting risk positions. So while we share the SEC’s overall concern, their starting position seems extreme.
Takeaways
Everyone is taking potshots at hedge funds these days, that extends to liquid alts in “40 Act wrap.” The growth phase is largely over; a few funds have closed. It will be interesting to see how much the SEC rules are relaxed and how fund structures hold up during periods of volatility.
We do find some funds which delivered in the past. We would not be quite so generous as Morningstar in awarding 4 or 5 stars, because the statistical significance of their short track records is simply too low.
Even if investors can identify skilled managers, they need to consider the timeliness of the strategies and monitor how quickly they gather assets. Opportunities (supply) in these markets come and go, demand is not always in sync. You can either skate to where the puck is going or be patient and diversify.
 What’s the Trapezoid story? Leigh Walzer has over 25 years of experience in the investment management industry as a portfolio manager and investment analyst. He’s worked with and for some frighteningly good folks. He holds an A.B. in Statistics from Princeton University and an M.B.A. from Harvard University. Leigh is the CEO and founder of Trapezoid, LLC, as well as the creator of the Orthogonal Attribution Engine. The Orthogonal Attribution Engine isolates the skill delivered by fund managers in excess of what is available through investable passive alternatives and other indices. The system aspires to, and already shows encouraging signs of, a fair degree of predictive validity.
The stuff Leigh shares here reflects the richness of the analytics available on his site and through Trapezoid’s services. If you’re an independent RIA or an individual investor who need serious data to make serious decisions, Leigh offers something no one else comes close to. More complete information can be found at www.fundattribution.com. MFO readers can sign up for a free demo.
The Alt Perspective: Commentary and news from DailyAlts
 Investors don’t like surprises as we found out over the past week. But traders love volatility, and volatility comes with surprises. As the dispersion of returns increases across global markets, traders can capitalize on the large swings by taking both long and short positions. With bets on both sides of the trade, events such as the Brexit fallout can turn a mediocre year into a great year for some managers. And indeed managed futures managers took full advantages of the market’s wild ride following the decision by U.K. citizens to give the E.U. the …… Well, you know what I mean.
Managed futures mutual funds closed out the month on a strong note with the category returning 3.36% versus -0.27% for large blend equity funds and 1.59% for intermediate term bond funds. Topping the managed futures list was the Arrow Managed Futures Strategy Fund (MFTTX) with a return in June of 12.33%. Not bad for a volatile month. Emerging market equity funds stood out on the equity side with a category return of 3.64% while the long government bond category rallied and closed the month up 5.83%. A few more months like that in the bond market and we will start hearing more talk about negative yields on U.S. bonds.
Other alternative mutual fund categories didn’t fare quite as well as managed futures, but multi-alternative funds squeaked out a positive return over the month of 0.41%, thus giving investors some buffer from the downturn in equities. Long/short equity funds lost 0.99%, nearly as much as world stock funds, which lost 1.09%. Not a great showing for the category, but a few funds, such as the Longboard Long/Short Fund (LONGX) did quite well with a return of nearly 9%.
Asset Flows
Flows into alternative mutual funds and ETFs remained positive in May (the latest data available) with roughly $1.1 billion flowing into the category. Multi-alternative funds, which have seen a steady inflow over the year turned negative in May with outflows of $344 million. Long/short equity saw a continued outflow from the category in May with $671 million leaving the category, bringing the year-to-date total to $2.8 billion. The engine driving the inflows is managed futures, which took in $1.4 billion during May, bringing that category’s year-to-date flows to $6.7 billion. Investors are clearly hedging their portfolios with uncorrelated managed futures strategies as they unload equity risk.
Research & Miscellany
A few article on DailyAlts resonated particularly well with readers in June, as follows:
Are Hedge Funds Superior to Liquid Alts? – This article highlights an important and ongoing debate, one that will likely go on for many years, or even decades. Perhaps it will eclipse the decades old active vs. passive debate.
Balter Responds to the Critics of Liquid Alternatives – Taking the other side of the coin versus the above article, Balter Liquid Alternatives penned a solid piece outlining why liquid alternatives are just as good as, or even better than, higher priced hedge funds.
Institutional Investors Turn to Alts to Boost Returns – While the diversification benefits of alternatives are often highlighted, institutional investors (like many others) are struggling to figure out where to get return. Alternative investments are the answer for many.
Thanks for reading, and have a great celebration of America’s Independence Day!
Requiem for a heavyweight: Aston/River Road Independent Value’s closure
On June 27, 22016, I received a singularly surprising notice in my inbox:
River Road Asset Management is formally announcing its intent to close the firm’s Independent Value Strategy® and return capital to investors. The decision to close Independent Value was based upon the recommendation of the portfolio manager, Eric Cinnamond, who stated that given the current fundamental environment, the Strategy’s roughly 90%+ cash balance, and the lack of discounts in the equity portfolio, it is no longer in the best interest of clients to continue offering the Strategy.
At the time of the announcement, ARIVX, the mutual fund which embodies the strategy, had $330 million in assets, was up nearly 10% year-to-date and was a top performing small cap value fund over the preceding year. Those are not the sort of numbers that usually signal imminent closure.
But, Eric Cinnamond does not do things the way other folks do. He, as much as his strategy, earns the designation “Independent.” Mr. Cinnamond has, for the past 17 years, single-mindedly pursued an absolute value strategy in which he buys good companies when they’re available at a substantial margin of safety. When he can’t find enough such stocks, he holds cash and waits for normalcy to return.
Sadly, the Fed and other central banks have largely destroyed the normal balance of the market. When rates are at, near or below zero, people are not rewarded for saving. Folks who would normally buy bonds for income find that they’re getting just 1.5% per year for short-term bonds; after taxes and inflation, even the 4% return on a Total Bond Market Index fund starts feeling perilously close to zero. Investors are forced to become speculators: they move money out of low-risk assets and into high-risk ones in hopes of making enough to make ends meet. That shift pushes up the price of risky assets like stocks, fundamentally undercutting their attractiveness to value investors. The folks at GMO calculate that stock prices are so far ahead of earnings right now that if we ever do return to normal, we should expect to see negative stock market returns for the better part of the next decade.
In that tipsy environment, Mr. Cinnamond found that good businesses were unaffordable and the few affordable businesses weren’t good. “Quality,” he groused, “is outrageously expensive.” As a result, he was holding more and more cash (nearly 90% now, up from 50% five years ago) and fewer and fewer stocks (about 10 currently). Investors grumbled about “paying 1.4% for a money market fund.” As he stayed true to his discipline, Mr. Cinnamond’s stocks continued to excel (the stock portion of his portfolio is up approximately 90% YTD) but fewer opportunities were popping up.
He saw two options. The first was to loosen his standards so that he could justify buying the best of an overpriced bunch. He rejected that:
I’m often asked why I don’t lower my discount rate (increase my valuation) given lower risk free rates. Answer: discount rates are meant to measure the risk and uncertainty of future cash flows. Has risk to corporate cash flows declined during this profit cycle? I argue no. Just ask an energy service provider! Or how about dozens of retailers. Risks to cash flows are alive and well (also note four consecutive quarters of profit declines). If risk hasn’t changed why should I lower my return demands?
The alternative was to maintain his standards and close the fund. Which he did. He has no current plans to join (or start) another investment company. He has threatened to start an investing blog (great, just what I need: more competition) and promises that if normal returns, he will too.
I very much look forward to talking with him once he’s completed the painful task of winding down his fund. I’ll share what I learn.
Snowball’s portfolio update: Add Intrepid Endurance (ICMAX)
A couple months ago, Artisan announced the liquidation of my longest-held fund, Artisan Small Cap Value. Their plan was to roll shareholders over into a mid-cap fund managed by the same team. I strongly preferred to maintain my long-term exposure to small cap value stocks and spent a lot of time working through the data at MFO Premium. I searched for the small cap funds with the best risk-adjusted performance over the latest full market cycle. I reviewed the performance of all domestic, global and international small cap funds.
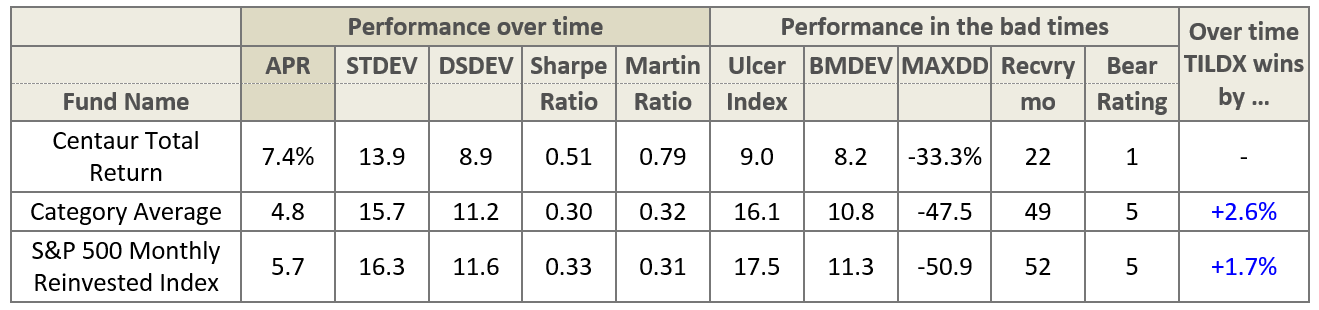
Intrepid Endurance, a slightly more-flexible version of Mr. Cinnamond’s fund, finished first on every meaningful measure of risk-adjusted performance: highest Sharpe ratio, highest Sortino ratio, highest Martin ratio, lower Ulcer Index, lowest maximum drawdown, shortest recovery period … and it returned a respectable 8.2% per year, well ahead of its peers.
Endurance is now one of my five largest holdings. I wish them well.
If I were an investor in Mr. Cinnamond’s fund and wanted to invest with a kindred spirit, I would first consider Intrepid Endurance (ICMAX) but also Pinnacle Value (PVFIX) and the newly-reopened Queens Road Small Cap Value (QRSVX ) and FMI Common Stock (FMIMX) funds. Folks wanted to stay with the Aston/River Road family should look at Select Value (ARSMX) or Small Cap Value (ARSVX).
Launch Alert: Moerus Worldwide Value Fund (MOWNX/MOWIX)
 Moerus Worldwide Value Fund launched on May 31, 2016. It is managed by Amit Wadhwaney who led Third Avenue International Value (TAVIX) from December 2001 to June 2014. Mr. Wadhwaney founded the international business at Third Avenue and was the founding manager of the Third Avenue Global Value Fund, LP, the Third Avenue Emerging Markets Fund, LP, as well as being founding manager for TAVIX. Before his stint at Third Avenue, Mr. Wadhwaney was director of research for Marty Whitman’s firm, M.J. Whitman LLC, a New York-based broker-dealer. (He speaks English, French, Gujarati, Hindi, Sindhi, and Spanish. I do not.)
He left Third Avenue during a period of rising turmoil at the firm; several members of his research team left (perhaps were forced out?) in the year before his departure. Over the past two years, constrained by non-compete agreements, he’s been reading and traveling.
Mr. Wadhwaney chose the Latin word “moerus” because it embodies his investing approach. The moerus was a city’s defensive walls, protection against risks both known and unanticipated. (At least one Latin scholar speculates that “moerus” might also appear in the “munis” at the heart of “community.” That is, a community was a group that provided mutual support and common defense.) In describing his portfolio, Mr. Wadhwaney reports that “we seek to populate our portfolios with companies that have a ‘Moerus’ – the strength, staying power and wherewithal – to withstand a variety of risks.” His mentor, Marty Whitman, had that same commitment that stocks that were “safe and cheap.”
The portfolio is built from the bottom up and will generally hold 25-40 names, including firms in the U.S. and the emerging markets. The target is undervalued stocks of firms that have “solid balance sheets, high quality business models and shareholder-friendly management teams.” Mr. Wadhwaney has frequently targeted small- to mid-cap stocks, often not covered by analysts at other funds, sometimes illiquid and unpopular.
Mr. Wadhwaney’s previous charge was international rather than global, but the performance of that fund might still guide your analysis here. Third Avenue International Value:
- beat its benchmark, MSCI All-Country World ex-US Index, by more than 200 basis points per year.
- It approximately matched the long-term performance of its international small- to mid-cap value peer group, but it did so with substantially less volatility.
- In 2008, it dropped 37% while its peers dropped 47%.
- It outperformed its peers in 75% of down markets but only 35% of up markets.
- It was still pretty good in its bad years; in the three years that it trailed 90-98% of its peers (2006, 2010, 2013), it posted returns of 17%,11% and 21%.
- Returns tended to be lumpy; there would be a couple years ahead of the pack, then a couple years behind.
Morningstar’s valedictory judgment when Third Avenue announced Mr. Wadhwaney’s departure was very positive:
The disciplined execution of his uncommon strategy has made the fund a good diversifier for investor portfolios and supported the fund’s ability to limit volatility in a risky category. Although the fund’s 10% annualized return since its inception through February 2014 roughly matches the category norm, its low volatility has allowed it to stack up well against its peers on a risk-adjusted basis.
It might also be worth noting that Third Avenue has had disastrous performance since his departure, combining high volatility and substantial losses. The fund is down 25% since his departure while its average peer is down 12%.
Investor shares cost 1.65% after waivers while Institutional ones charge 1.40%. The difference is explained by the 12b-1 fee that’s necessary to get the fund onto major distribution platforms. Both share classes carry a 2% redemption fee on shares held for fewer than 90 days. The minimum initial investment is $2500 and $100,000. The fund’s homepage is www.moerusfunds.com .
Launch Alert: Seafarer Overseas Value (SFVLX/SIVLX)
 Seafarer Overseas Value launched on May 31, 2016. There are, per Morningstar, 235 emerging markets funds. Of those, six proclaim themselves to be value funds. Seafarer offers the seventh and, for the average investor, the most promising.
Seafarer argues that most emerging markets investors have traditionally had a rational focus on growth. There were two reasons for that. First, growth was predictable. Developing economies were largely hostage to growth in the developed markets; when policymakers in the developed market pursued fiscal or monetary stimulus, certain EM sectors and firms predictably boomed. Second, value was unreliable. Value investing requires that you find a company that’s worth more than people think. Assuming that capitalism is self-correcting (that is, dumb companies get fixed or die), the trick is to invest in companies that are on the verge of being fixed and then sell to the growth investors once they get a clue and begin bidding up the price of the stock. The “verge of being fixed” part means that you need to identify a catalyst which might unlock the firm’s unrecognized potential. For a variety of cultural and legal reasons, though, emerging markets didn’t develop catalysts. Broken companies stayed broken, neither being fixed nor dying.
Those conditions have now changed. Growth in the developed world has slowed and become uncertain; policy-makers have juiced growth so incessantly and so vigorous that they’ve virtually exhausted their options. From the three legs of Abenomics to negative interest rates of Europe, we may have wrung as much growth out of the system as we’re going to get. At the same time, catalysts have begun to develop in the emerging markets. Traditionally only foreign investors, an easily-ignored bunch, demanded that corporations unlock value. Seafarer argues that a series of domestic constituencies, much harder to ignore, are joining in the call. Three stand out:
- The Grand Old Men who have run these firms for decades are now looking at passing along their ownership stakes and management responsibilities to a younger generation. They need to get their houses in order to make that happen.
- Pension funds in their home markets can’t afford to have underperforming companies; they have payout obligations to meet and are agitating for the changes needed to boost corporate performance.
- As the EM high-yield bond market develops, it becomes increasingly possible for corporate outsiders to make meaningful leveraged buyout offers. Those outside investors need a high-performing corporation in order to recoup their investment, so they’ll force through corporate reorganizations to unlock value. That’s essentially what Michael Milken did in the US in the 1980s, as he led a wave of hostile takeovers financed by junk bonds.
Too, in at least some markets, legal changes have increased transparency and protections for passive outside investors. Assuming they are right, value investing will provide a driver independent of macro-level growth; that is, even if economies are not growing robustly, the value of corporations might climb a lot as they clean up their acts and begin allocating capital well.
This fund has been incubating for three and a half years, as Seafarer looked for the right guy to hire and train to run the fund. They believe they now have that guy in Paul Espinosa. Mr. Espinosa joined Seafarer Capital Partners in 2014. The greater part of his career has been as an equity analyst and stock selector for Legg Mason, Citigroup and J.P. Morgan.
Investor shares cost 1.15% after waivers while Institutional ones charge 1.05%, both are admirably low for a new emerging markets fund. There is no 12b-1 fee. Both share classes carry a 2% redemption fee on shares held for fewer than 90 days. The minimum initial investment is $2500 and $100,000. The fund benefits from a rich and well-designed homepage.
Meb Faber Podcast

Meb recently debuted his new podcast about investing with the same casual, refreshing, and insightful perspective we’ve come to respect and appreciate, since first profiling him in May 2014 with The Existential Pleasures of Engineering Beta.
The podcast is definitely worth tuning into. The first five episodes are now on iTunes, available for free. You can subscribe here. They are:
- Global Asset Allocation – Investing 101
- Patrick O’Shaughnessy – An Unexpected Drop-in from Patrick O’Shaughnessy
- Jeff Remsburg – Where Are the Best Global Values Right Now?
- Wes Gray – “Even God Would Get Fired as an Active Investor”
- EJared Dillian – “If You Think 2016 is the Opposite of 1981, then You Should Do the Opposite”
Material referenced during the podcast is nicely provided on Meb’s website, like here from Episode 1.
Funds in Registration
There’s reason for optimism in seeing five really solid funds launched in the past two months: two from Centerstone and Matthews Asia Credit Opportunities, plus the Seafarer and Moerus funds above. That helps buffer the discouragement offered by the exceedingly small and thin pool of new funds in registration this month. We’ll hope it’s just a summer slump.
Manager Changes
In June, 64 funds saw complete or partial manager changes. There are a horde of really interesting moves.
Burnham Capital has been removed as the adviser to all three Burnham Funds.
Thomas Soveiro has been removed, after 11 years, from management of Fidelity Convertible Securities (FCVSX). That move may have more to do with the crumbling of his flagship, Fidelity Leveraged Company Stock (FLVCX), than with any problems at the convertibles fund. FLVCX trails 90% of its peers over the past three years and 80% over the past five and ten year periods. It tends to be a hot money fund, with cash roaring in and out at the rate of hundreds of millions (occasionally billions) a year.
Oaktree Capital Management, Howard Marks near-legendary firm, has been removed as a sub-adviser to Northern Multi-Manager Emerging Markets (NMMEX) even as its own young emerging market fund flounders.
Rudolph-Riad Younes, once an international investing legend with Julius Baer, is no longer managing RSQ International (RSQIX) which he and Richard Pell launched about three years ago.
The Turner Funds appear to be systemically cutting staff while Janus Funds are systematically adding them.
Laura Geritz resigned from Wasatch and from Wasatch Frontier Emerging Small Countries Fund (WAMFX). Since inception she’s crushed her competition.
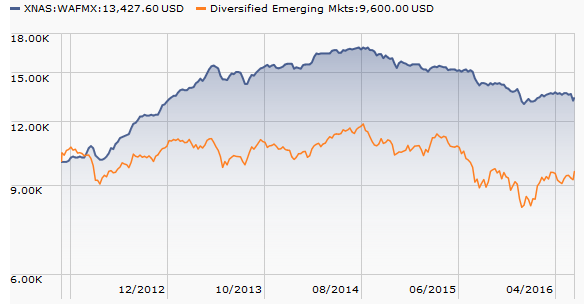
2016 was shaping up to be the only year that the fund faltered badly.
Get out of the water and into the parlour!
I have been approached by a regrettable number of people, none wearing wetsuits, who have offered me “a deep dive” into one issue or another.
Uhh … stop it. It marks you as someone of limited intellect but unlimited ability to snare jargon as it skips by. The term is misused (in a business sense, it was originally applied to a particular group problem-solving technique), unnecessary and hackneyed.
Instead of “let’s take a deep dive into…,” consider “I’d like to give you the opportunity to learn enough about us to make a well-informed judgment.”
Parlour, in the sense of “that room with all the chairs in your grandma’s house” comes from parler, “to talk.” It was a place set aside to receive visitors and to sit and talk with them. Though novel, the idea of sitting down and having a conversation (not a pitch, not a dive but rather a civil exchange of ideas and perspectives) might bring surprising benefits to a screen-addled, jargon-grabbing populace.
Briefly Noted . . .
Marketfield Fund (MFLDX) has decided to close its Investor Class and Class R2 shares as of August 14, 2016. Investor shares will become “A” shares with a $2,500 minimum. The fund, once a bloated underperformer, is now a lean underperformer: its assets are down about 90% from its peak though it still trailed 90% of its peers YTD.
SMALL WINS FOR INVESTORS
AAM/Bahl & Gaynor Income Growth Fund (AFNAX) dropped its total expense ratio by 0.17 basis points.
Likewise, Northern Funds dropped the expense ratios on Large Cap Core, Large Cap Value and Small Cap Core by 15, 30, and 10 basis points, respectively. That places the funds in the 0.45-0.65% range.
Driehaus Select Credit Fund (DRSLX) reopened to new investors in the first week of June, 2016. The Fund has been closed to most new investors since January 31, 2014
FMI Large Cap Fund (FMIHX) and the FMI Common Stock Fund (FMIMX) both re-opened to all investors on June 30, 2016.
Prudential Jennison Mid-Cap Growth Fund (PEEAX) will reopen to new investors on July 15, 2016. It’s been closed since April, 2013.
CLOSINGS (and related inconveniences)
Harding Loevner Emerging Markets (HLEMX) closed to new investors on June 30, 2016.
On July 5, 2016, PNC Small Cap Fund (PPCAX) will also close to most new investors.
OLD WINE, NEW BOTTLES
On June 15, 2016, the Board of Trustees of Aberdeen Funds approved changing the name of Aberdeen Global Fixed Income Fund (CUGAX) to Aberdeen Global Unconstrained Fixed Income, effective August 15, 2016. Being newly unconstrained, “the portfolio management team intends to invest more heavily in corporate bonds and across the credit spectrum, and may invest more heavily in securities rated BBB and lower.” That’s likely to increase portfolio turnover and increase your short-term tax hit.
AI regret? AI U.S. Inflation-Protected Fund (FFIHX) has been renamed, post-haste, the American Independence U.S. Inflation-Protected Fund. As a matter of fact, it appears that all of the AI Funds have returned to their American Independence monikers, which the funds abandoned on January 29, 2016 in favor of the trendy AI designation. That bit of rebranding seems to have failed after just five months.
American Century Fundamental Equity Fund will be renamed Sustainable Equity Fund effective August 10, 2016. The fund added an ESG screen to its investment strategies on June 8, 2016.
As of June 20, 2016, Dreman Contrarian Small Cap Value Fund became Foundry Partners Fundamental Small Cap Value Fund. Same team, same expenses, new label.
DSM Large Cap Growth Fund is becoming Touchstone Large Company Growth Fund with the same investment objective and similar investment strategies
Effective July 18, 2016, Eaton Vance Bond Fund (EDBAX) changes to Eaton Vance Multisector Income Fund
Fidelity Advisor® Electronics Fund (FELAX) becomes Fidelity Advisor® Semiconductors Fund effective October 1, 2016.
Goldman Sachs Limited Maturity Obligations Fund (GPPIX) becomes Goldman Sachs Short-Term Conservative Income Fund on July 29, 2016. The investment objective gets tweaked on August 16: it goes from current income with “an emphasis on preservation” to current income “and secondarily an emphasis on preservation.”
The surviving Northern Multi-Manager Funds (see “the dustbin of history,” below) have become “The Active M Funds!!!!” NMM Emerging Markets Equity (NMMEX) became Active M Emerging Markets Equity and NMM International Equity (NMIEX) is Active M International Equity. There was some shakeup in the management ranks: Oaktree Capital and Pzena were booted from the Emerging Markets lineup. Altrinsic Global Advisors, Earnest Partners, NFJ Investment Group and William Blair were ousted from International while Cambiar, Causeway Victory Capital Management were brought in.
PIMCO Dividend and Income Builder Fund has morphed into PIMCO Dividend and Income Fund (PQIDX) whose new objective will be “to provide current income that exceeds the average yield on global stocks.” The Vanguard FTSE All-World ETF (VWRD) currently yields 2.06% while PQIDX yielded 4% of the past 12 months and is projected to yield 4.9% over the next 12. While a high yield is nice, you need to approach them carefully: if a stock’s price drops but its dividend isn’t cut, the dividend yield rises. The PIMCO fund trails 80% of its rivals over the past three years and has earned one-third as much because the declining value of its stocks have largely wiped out the fund’s extra yield. On the upside, PIMCO cut its advisory fee from 0.49% to 0.20%.
Effective August 1, 2016, a bunch of Ridgeworth Funds get slightly wordier names:
| Current Name |
New Name |
| RidgeWorth Large Cap Value Equity Fund |
RidgeWorth Ceredex Large Cap Value Equity Fund |
| RidgeWorth Mid-Cap Value Equity Fund |
RidgeWorth Ceredex Mid-Cap Value Equity Fund |
| RidgeWorth Small Cap Value Equity Fund |
RidgeWorth Ceredex Small Cap Value Equity Fund |
| RidgeWorth Large Cap Growth Stock Fund |
RidgeWorth Silvant Large Cap Growth Stock Fund |
| RidgeWorth Small Cap Growth Stock Fund |
RidgeWorth Silvant Small Cap Growth Stock Fund |
| RidgeWorth Aggressive Growth Stock Fund |
RidgeWorth Innovative Growth Stock Fund |
OFF TO THE DUSTBIN OF HISTORY
The Board of Trustees met in mid-June to see if they could imagine any way for 1290 Global Equity Managers Fund (TNGAX) to attract “significant assets.” Having concluded that it couldn’t, they authorized liquidation of the fund on July 18, 2016.
Aberdeen Latin American Equity Fund (ALEAX), Aberdeen European Equity Fund (AEUAX), Aberdeen Ultra-Short Duration Bond Fund (AUDAX) will all be liquidated on (or about) August 15, 2016.
Aberdeen Emerging Markets Debt Local Currency Fund (ADLAX) merges into Aberdeen Emerging Markets Debt Fund (AKFAX) on August 15, 2016.
Plan A: Aberdeen Global Natural Resources Fund (GGNAX) will merge into Aberdeen Global Equity Fund (GLLAX). If Plan A, for any reason, doesn’t come on, Plan B calls for “the complete liquidation of all of the assets of the Fund.”
Amundi Smith Breeden Total Return Bond Fund (ATRSX) liquidates on or about June 30, 2016.
On June 23, the Board of the ASTON/Barings International (ABIIX), ASTON/Harrison Street Real Estate (AARIX), ASTON/LMCG Emerging Markets Fund (ALMEX), ASTON/River Road Independent Value (ARIVX) and ASTON/TCH Fixed Income (CHTBX) funds determined that the funds had one month to live. Interment ceremonies are scheduled for July 28, 2016.
In consideration of “current asset size, recent purchase and redemption history and projected expenses,” BPV High Quality Short Duration Income Fund (BPASX ) will liquidate on July 11, 2016. Shortly thereafter, on August 29, 2016, BPV Large Cap Value Fund (BPLAX) and BPV Wealth Preservation Fund (BPAPX) will join it in oblivion.
BlackRock Multi-Asset Real Return Fund (BRRAX) has closed. “On or about July 8, 2016, all of the assets of the Fund will be liquidated completely.”
If you hadn’t noticed, Calvert Global Value Fund (CLVAX) and Calvert Global Equity Income Fund (CEIAX) merged into Calvert Equity Portfolio (CSIEX) at the end of business (literally), June 25, 2016.
Columbia is doing a sort of reverse split. Columbia Large Cap Growth Fund (LEGAX) is absorbing Columbia Large Cap Growth Fund II on August 1, Columbia Large Cap Growth Fund III on August 5 and Columbia Large Cap Growth Fund V on August 11, 2016. “Where,” you ask, “is Columbia Large Cap Growth Fund IV in all this?” It’s already gone into Columbia Large Cap Growth Fund’s cavernous maw, the dirty deed having been done on May 20.
Columbia International Value Fund (NIVLX) was absorbed by Columbia Overseas Value (COAVX) in late June, just in case you were interested.
Deutsche Strategic Equity Long/Short Fund (DSLAX) will terminate and liquidate on August 22, 2016
By the time you read this, Greenleaf Income Growth Fund (GIGFX) will have browned, withered, dried and blown away. As with many small funds, the advisor was continually underwriting the fund’s operation and they determined that the burden was unmanageable given that they didn’t see things getting better.
Hays US Opportunity Fund (HUOAX) closed and, quite promptly, liquidated on June 30, 2016.
The iShares folks are liquidating a series of ETFs: B – Ca Rated Corporate Bond ETF (QLTC), Baa – Ba Rated Corporate Bond ETF (QLTB) and MSCI Emerging Markets Horizon ETF (EMHZ). They’re scheduled to disappear September 2, 2016.
JHancock Core High Yield Fund’s (JYIAX) shareholders are being asked to approve a merge into JHancock Focused High Yield Fund (JVLAX). The vote there is July 22, 2016.
JHancock International Core Fund (GIDEX) has asked its shareholders to approve a merger into John Hancock Disciplined Value International Fund (JDIBX).The vote takes place July 29, 2016.
Pending shareholder approval, LKCM Aquinas Small Cap Fund (AQBLX) and the LKCM Aquinas Growth Fund (AQEGX) will be reorganized into the LKCM Aquinas Value Fund (AQIEX), whereupon that fund will be renamed LKCM Aquinas Catholic Equity Fund. On the upside, the new fund will charge a lower management fee (1.0% rather than 1.5%) and the 12b-1 fee drops from 0.25% to 0.10%.
LongCap Value Fund (LCAPX) will liquidate on July 15, 2016.
Northern Multi-Manager Large Cap Fund (NMMLX), Multi-Manager Small Cap Fund (NMMSX) and Multi-Manager Mid Cap Fund (NMMCX) will each be liquidated and terminated on or about July 22, 2016.
Pathway Advisors Aggressive Growth Fund (PWAGX) and Pathway Advisors Conservative Fund (PWCNX) have closed and will liquidate on July 15, 2016.
PIMCO Balanced Income (PBIAX), PIMCO Global Dividend Fund (PQDAX), PIMCO International Dividend (PVIAX) and PIMCO U.S. Dividend (PVDAX) will go to their eternal rest on August 26, 2016. The funds have negligible asset bases and undistinguished records; in general, they’re under two years old which is probably a sign of PIMCO’s growing anxiety.
Pine Grove Alternative Fund (no ticker) will liquidate on September 30, 2106. It was an odd creature: originally a hedge fund with a 16 year record of illiquid investing, it converted to an interval fund in 2014. That’s an increasingly popular sort of closed-end fund will allows the managers to invest in illiquid securities by restricting the ability of fund investors to sell their shares. If you want out, you typically have one “sell” window each quarter and the managers can limit the number of shares they’re able to redeem at one time; you might well want to sell $10,000 in an interval fund but be limited to $7,000 at the end of next quarter.
Pioneer Long/Short Bond Fund (LSGAX) and Pioneer Long/Short Opportunistic Credit Fund (LRCAX) will begin checking out the grass from underneath, likely on July 29, 2016.
The board and advisors of the Rogé Partners Fund (ROGEX) have “concluded that it is in the best interests of the Rogé Partners Fund and its shareholders that the Fund cease operations.” That will occur on July 22, 2016.
Royce European Small-Cap Fund and Royce Global Value Fund both merged into Royce International Premier Fund (RYIPX).
Snow Capital Market Plus Fund liquidated, on three days’ notice, on June 6, 2016.
SSGA Clarion Real Estate Fund (SSRVX/SSREX) moved to the realm on unreal estate on August 17, 2016.
Stonebridge Small-Cap Growth Fund closed and liquidated on June 27, 2016, in no small part because the investment advisor resigned.
Westport Fund (WPFRX) and Westport Select Cap Fund (WPSCX) are slated to merge into Hennessy Cornerstone Mid Cap 30 Fund (HFMDX).
Worthington Value Line Dynamic Opportunity Fund (WVLEX) is “winding up its affairs” and will liquidate around July 29, 2016.
In Closing . . .
A quick tip of the cap to folks who made tax-deductible contributions to the Observer this month: regular subscribers, Greg and Deb; PayPal contributor, Roberto; and those who preferred to mail checks, Joe, Hjalmar and Richard. We’re grateful to all of you.
We would also like to thank the folks that continue to use our Amazon link. Please do double-check to see if you’ve set it as a bookmark or starting tab in your browser. We try not to be too much of a pesterance on the subject, but the Amazon piece continues as a financial mainstay so it helps to mention it.
If you’re curious about how the Amazon Associates program works, here’s the short version: if you enter Amazon using our link, an invisible little piece of text (roughly: “for the benefit of MFO”) follows you. When you buy something, that tag is attached to your order and we receive an amount equivalent to 6% or so of the value of the stuff ordered. It’s invisible and seamless from your perspective, and costs nothing extra. Sadly, the tag expires after a day, so you’ll have to use the link (or bookmark!) each time you visit Amazon.
We’ll look for you.
As ever,


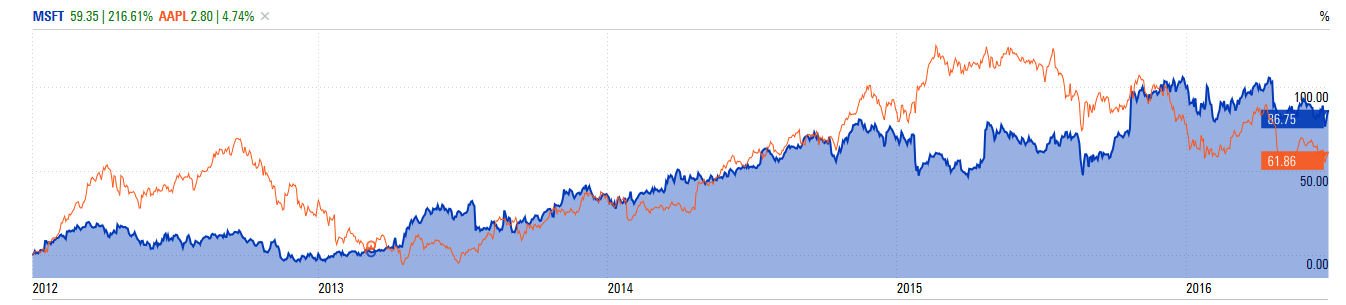

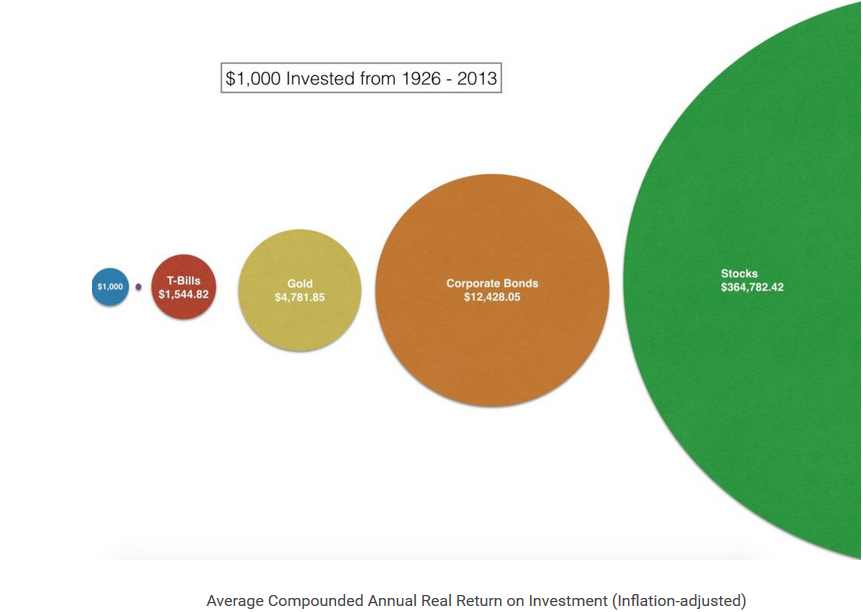
 This is another misconception about not being fully invested. If you have large discounts you can still generate attractive returns without being invested in what I call “fillers.” Just like with processed food, investment fillers are often there just to fill up the portfolio, but often provide little value and in some cases can be hazardous to your health! Open the hood of most fully invested small cap funds and you’ll find plenty of fillers these days, especially in sectors like consumer and health care. The stocks are clearly overvalued but managers think because they’re in lower risk sectors they won’t get destroyed. Good example WD-40 (WDFC) at 30x earnings! Great company but you could lose half your capital if it ever reverted to a more justifiable 7% free cash flow yield.
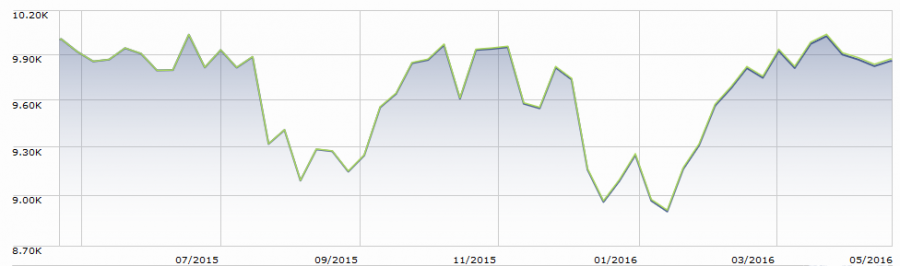


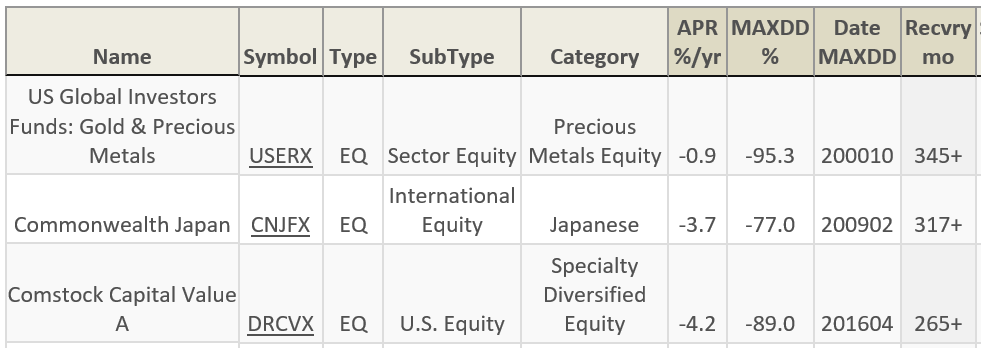
 We were delighted to announce last month that Bob Cochran joined MFO’s Board of Directors. Bob is the lead portfolio manager, Chief Compliance Officer, and a principal of PDS Planning in Columbus, Ohio, and a long-time contributor to the FundAlarm and MFO discussion boards.
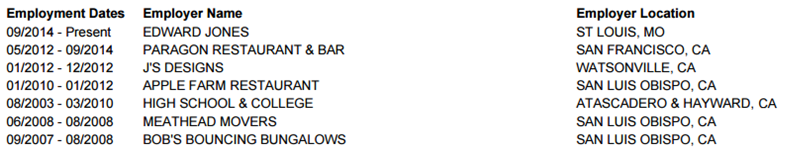
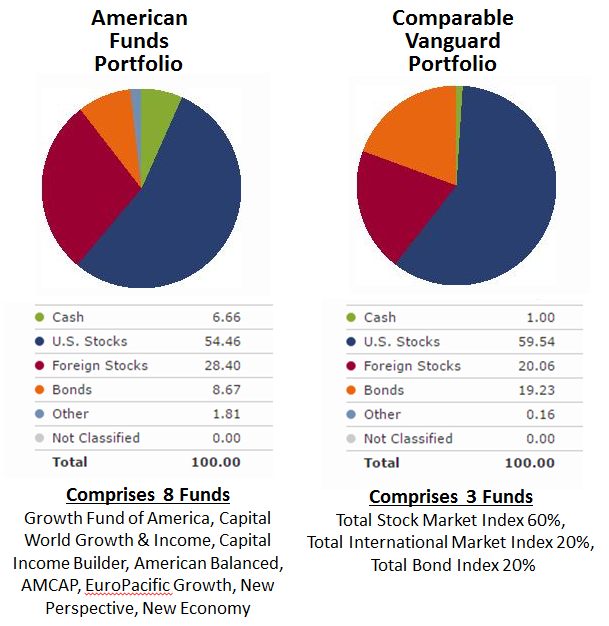
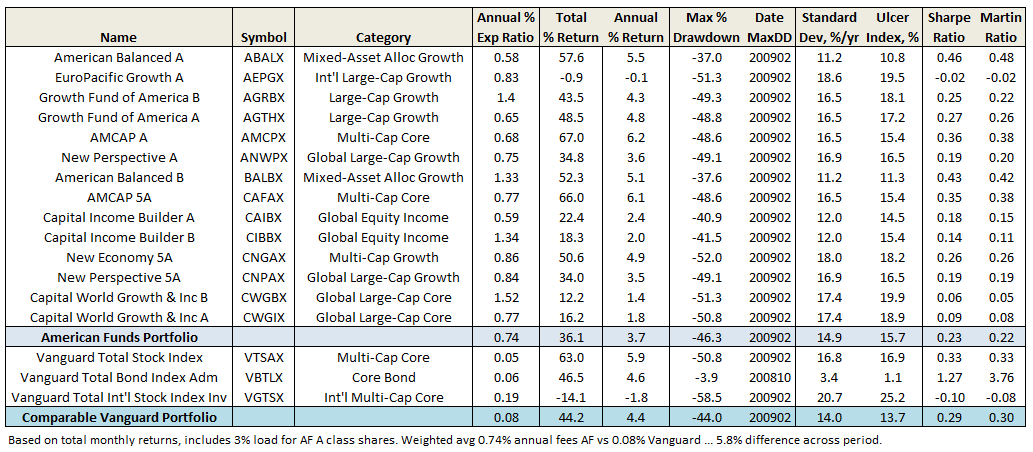
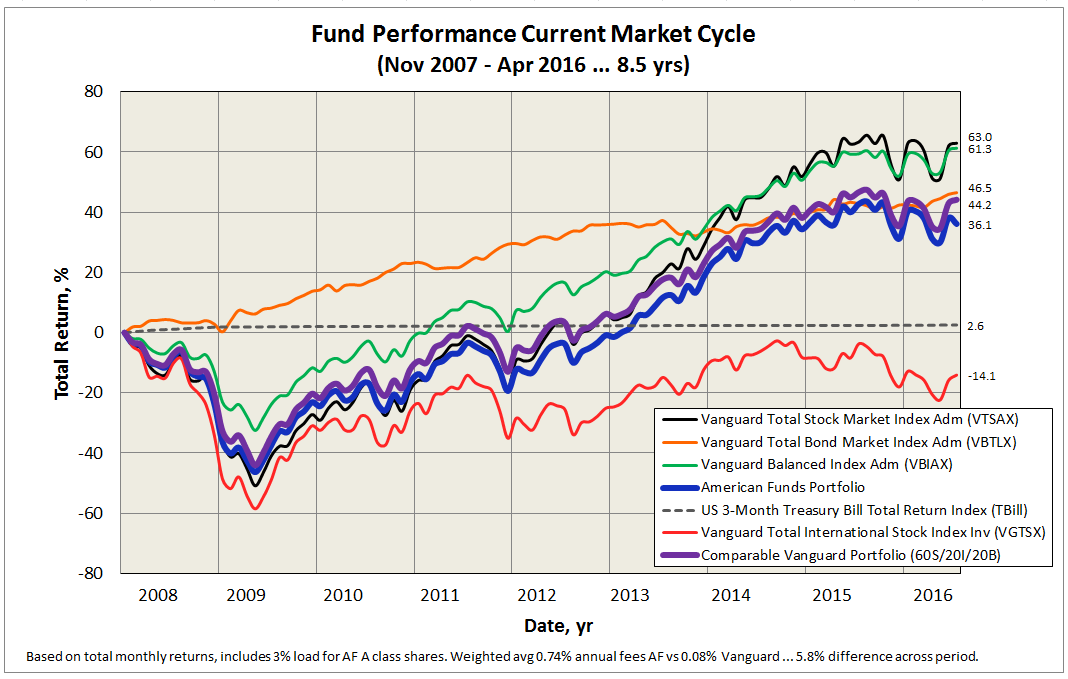
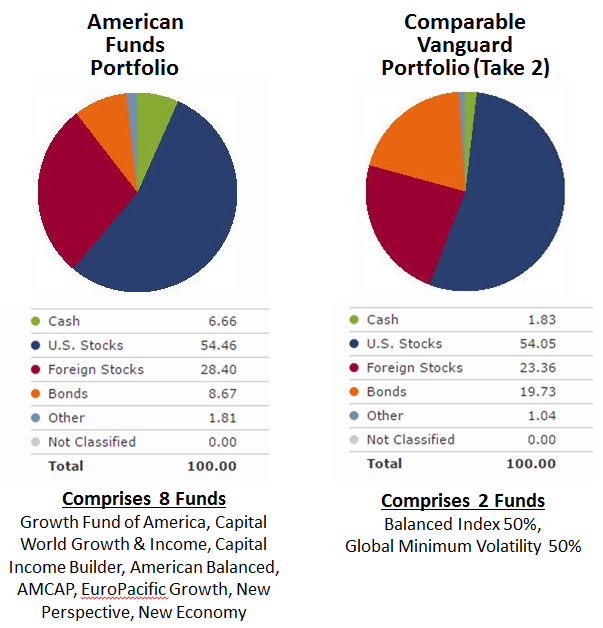
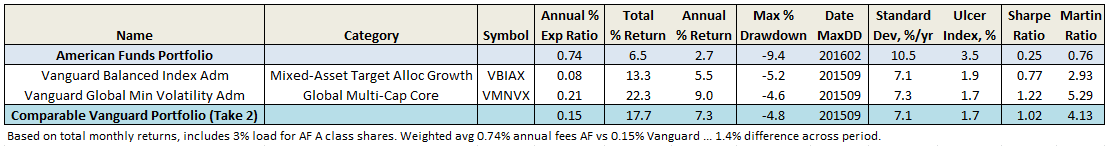
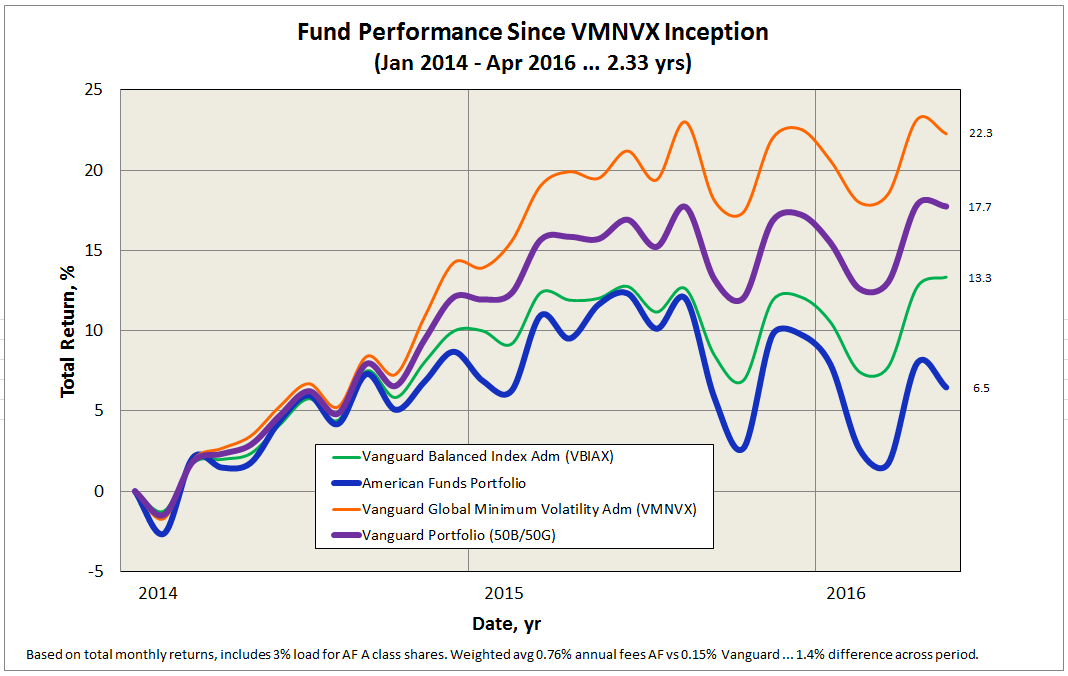
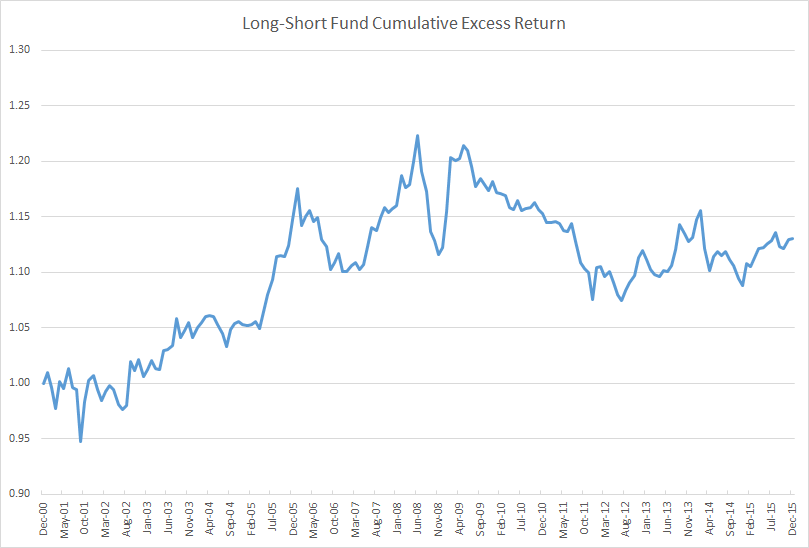
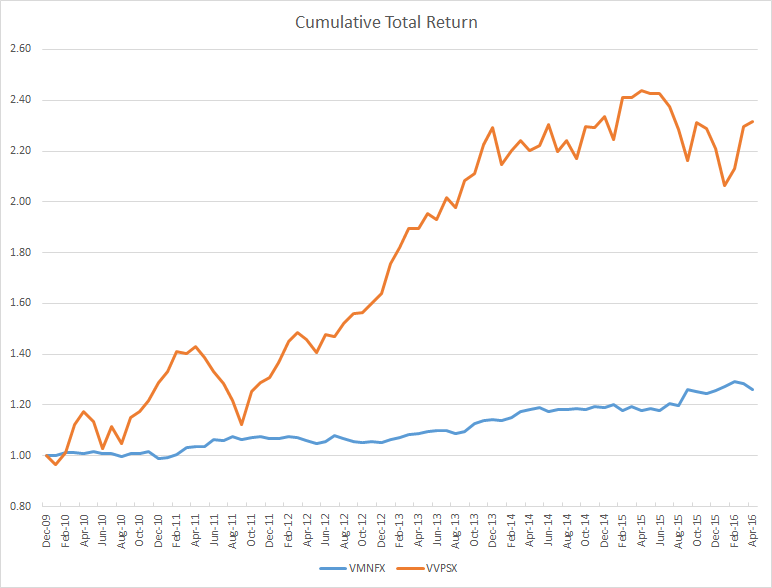
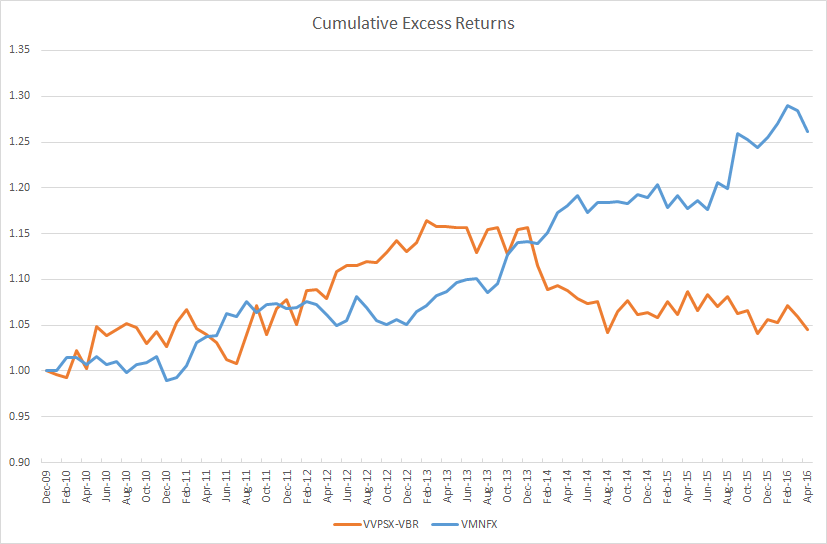
 Sam Lee and
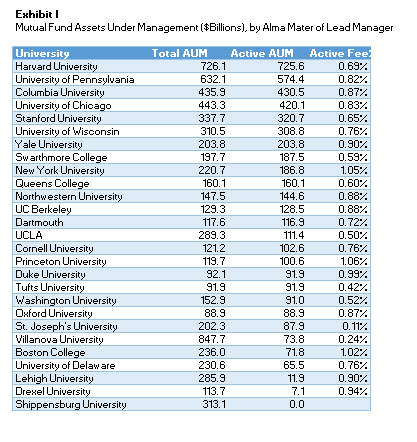
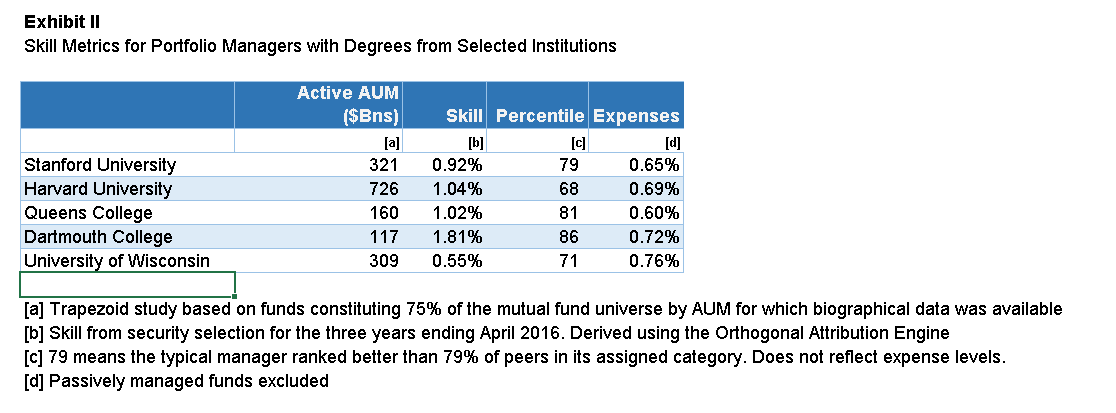
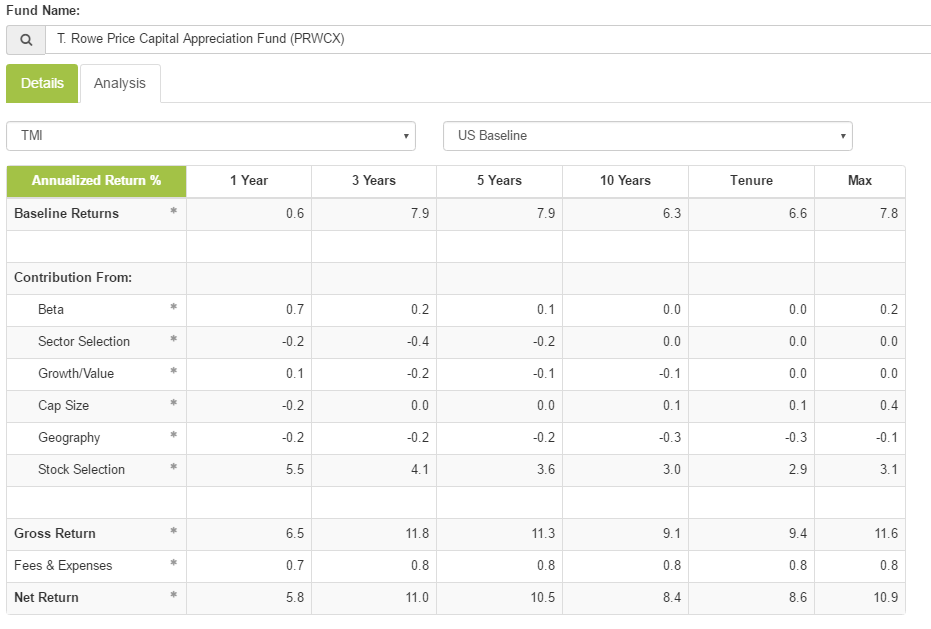
 Since the number of funds we can cover in-depth is smaller than the number of funds worthy of in-depth coverage, we’ve decided to offer one or two managers each month the opportunity to make a 200 word pitch to you. That’s about the number of words a slightly-manic elevator companion could share in a minute and a half. In each case, I’ve promised to offer a quick capsule of the fund and a link back to the fund’s site. Other than that, they’ve got 200 words and precisely as much of your time and attention as you’re willing to share. These aren’t endorsements; they’re opportunities to learn more.
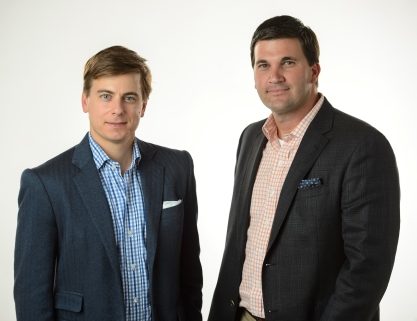 Mr. Thibodeaux founded Goodwood in 2012 after a nine year stint with Maple Leaf LP, a hedge fund that received a “seed” investment from Julian Robertson’s famous Tiger Management, leading to the informal designation of Maple Leaf as a “Tiger Seed.” Maple Leaf, like Goodwood, was a fundamental, value-biased long/short fund. Mr. Pesses joined Goodwood about a year later. Like Mr. Thibodeaux he was at Maple Leaf, served as a Partner and Senior Equity Research Analyst from 2007 to 2012. Their first products at Goodwood were long/short separate accounts which have done remarkably well. From January 1, 2008 – March 31, 2016, their long/short composite returned 8.6% annually after fees. The average Morningstar peer made 0.7%. That seems like a hopeful sign since those same strategies should help buoy GAMAX.
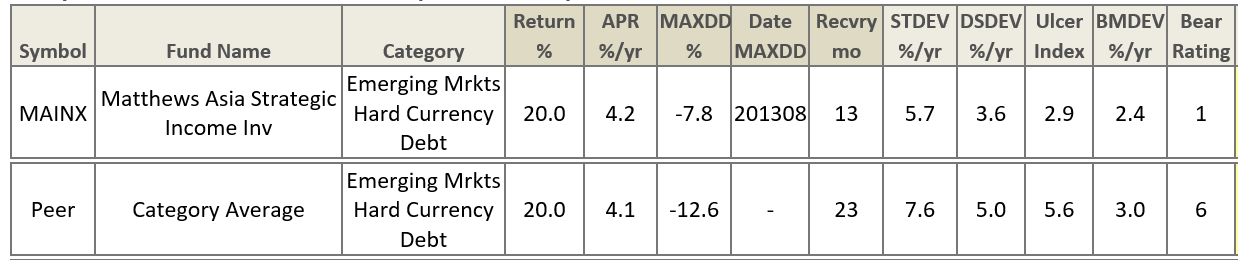
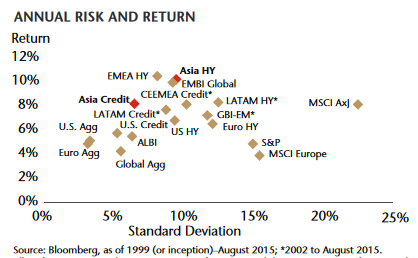
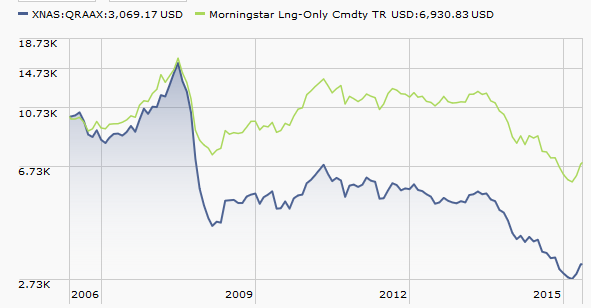
 In the instance above, it would take nearly four times as long to recharge my phone using the cable on the left. Every cable I tested produced a different charge rate, from a low of 300 mA to a high of 1200 mA.
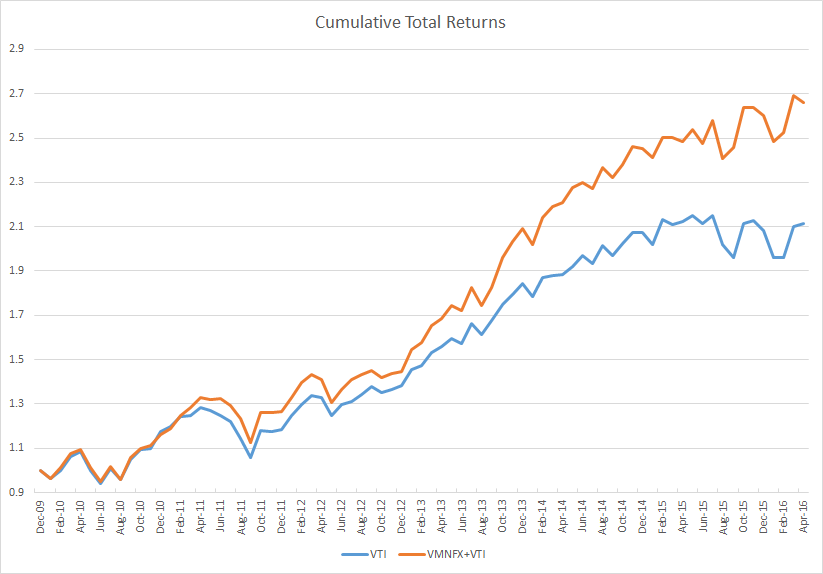
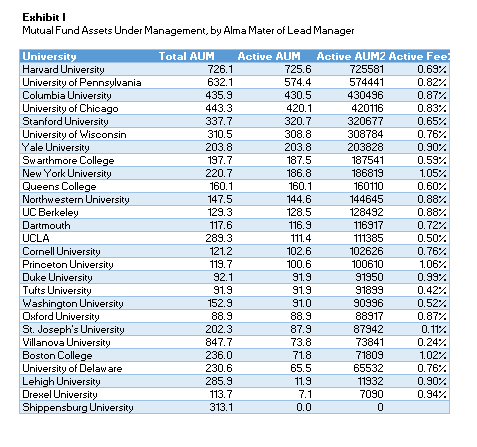 We concede to purists and academics that our study lacks rigor. The mutual fund database does not capture separate accounts, hedge funds, etc. We excluded many funds (comprising 25% of the AUM in our universe) where we lacked biographical data on the manager. Successful active funds rely on a team so it may be unfair to ascribe success to a single individual; in some cases we arbitrarily chose the first named manager. We used the institution associated with the manager’s MBA or highest degree. Some schools are represented by just 1 or 2 graduates. We combined funds from disparate sectors. Active and rules-based funds are sometimes strewn together. And we draw comparisons without testing for statistical validity.
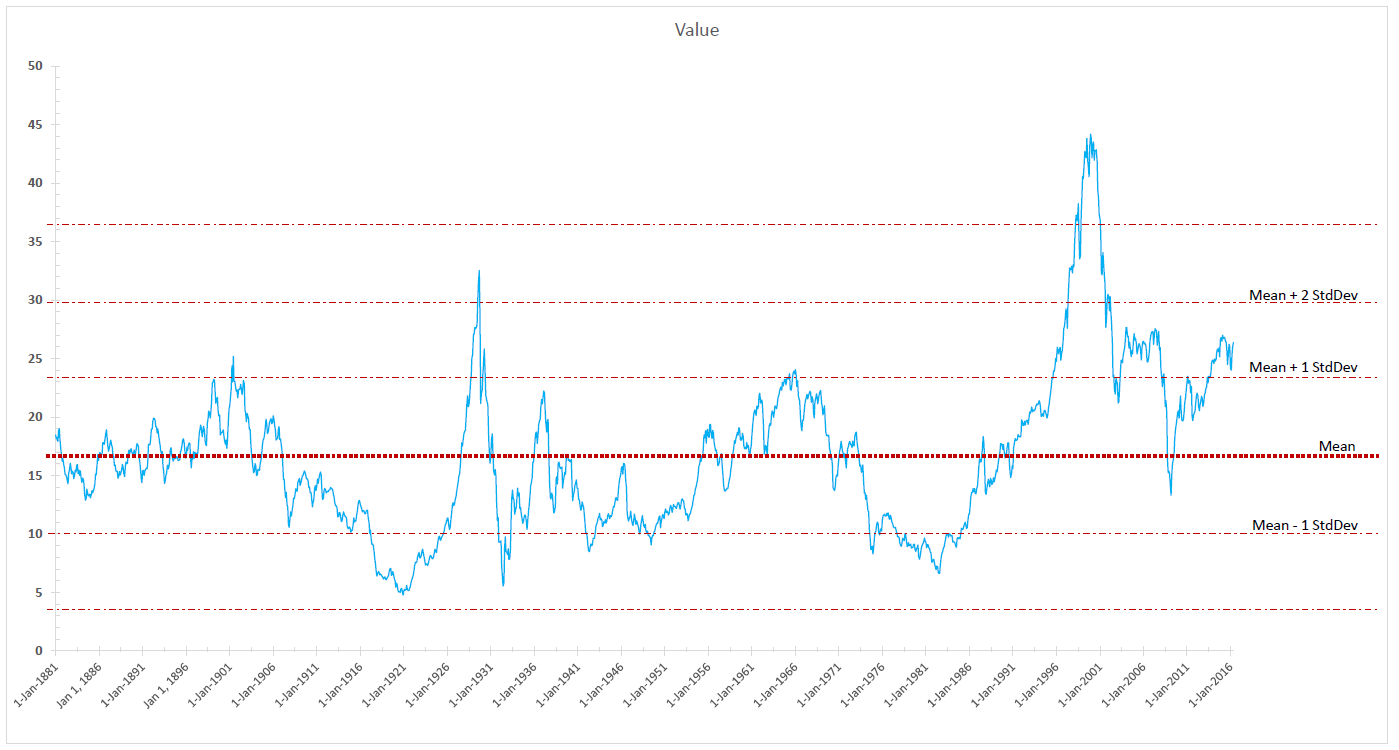
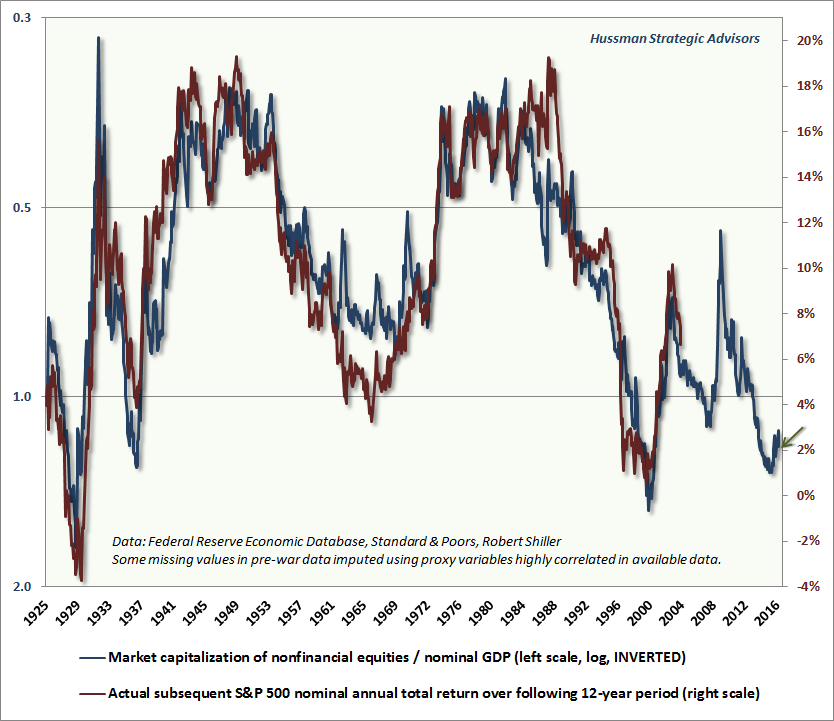
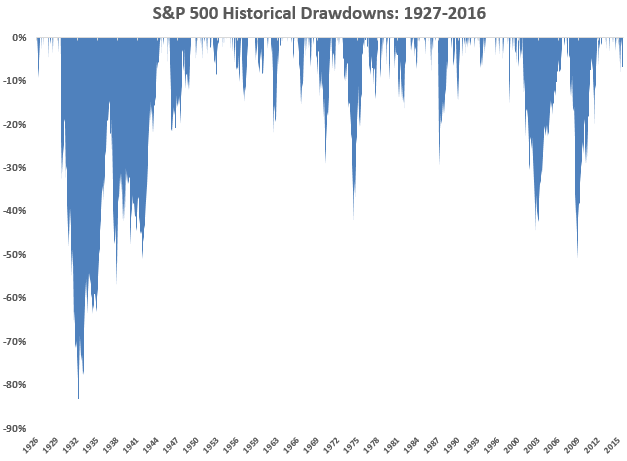 I think of this as “the icicle chart.” Ben Carlson, one of the Ritholtz managers, wrote a really thoughtful essay, rich in visuals, in April. He posted it on his Wealth of Commonsense blog under the name “
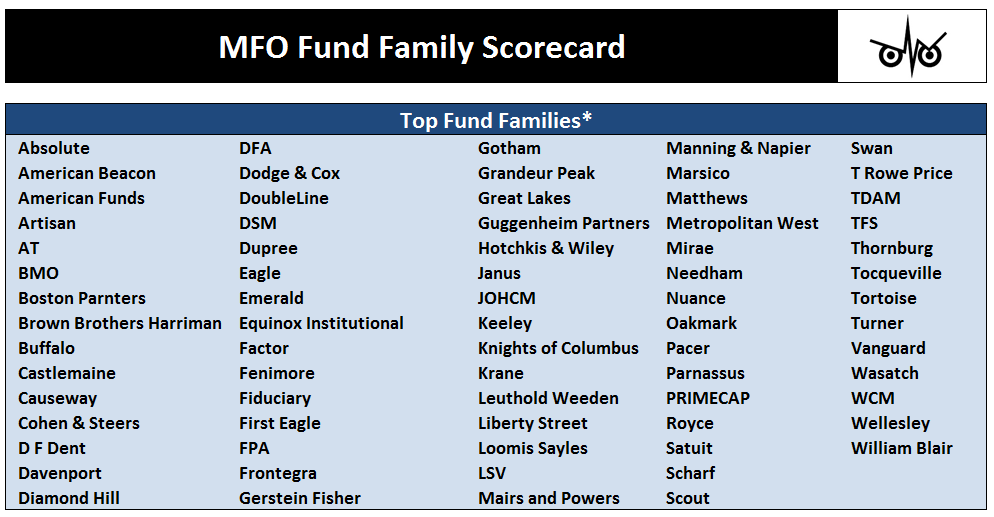
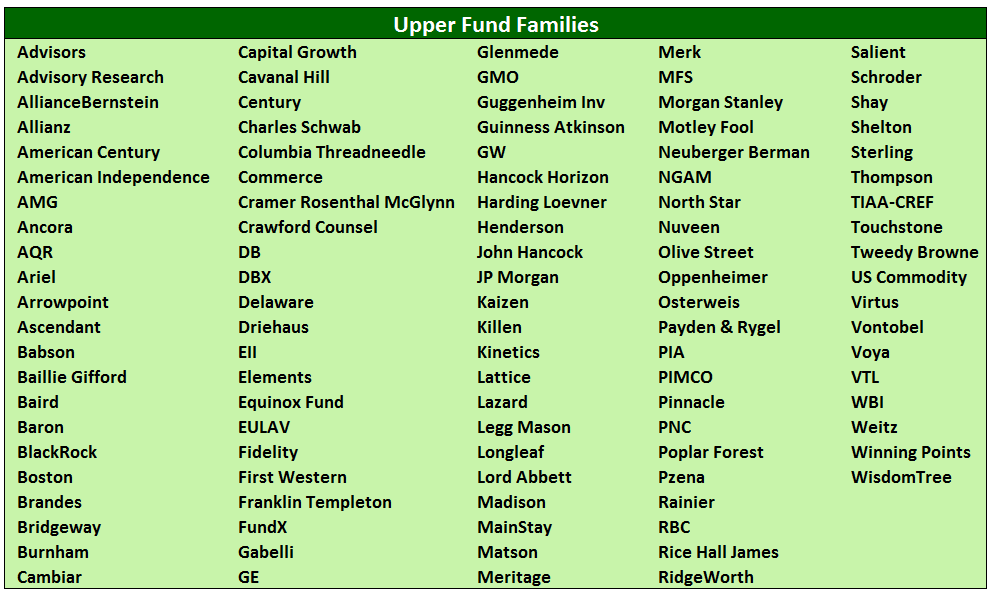
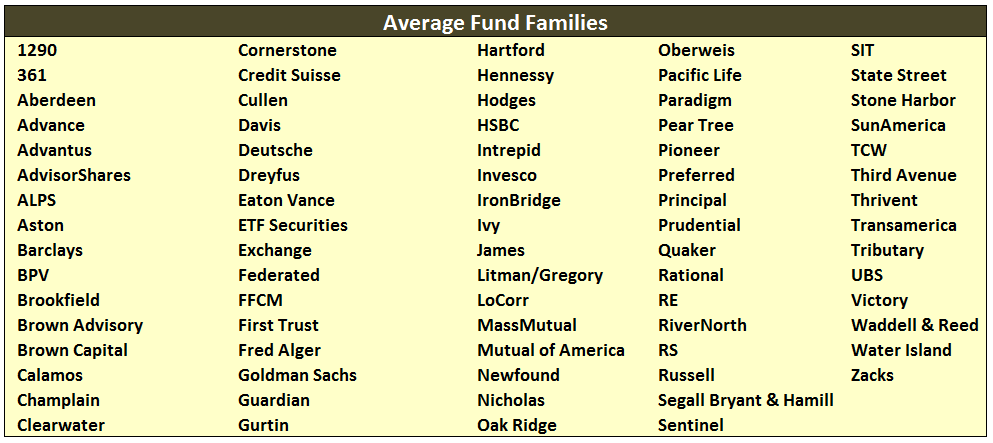
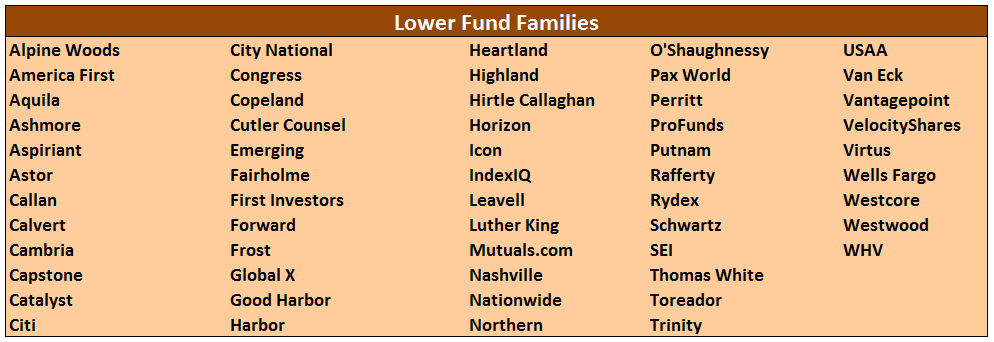
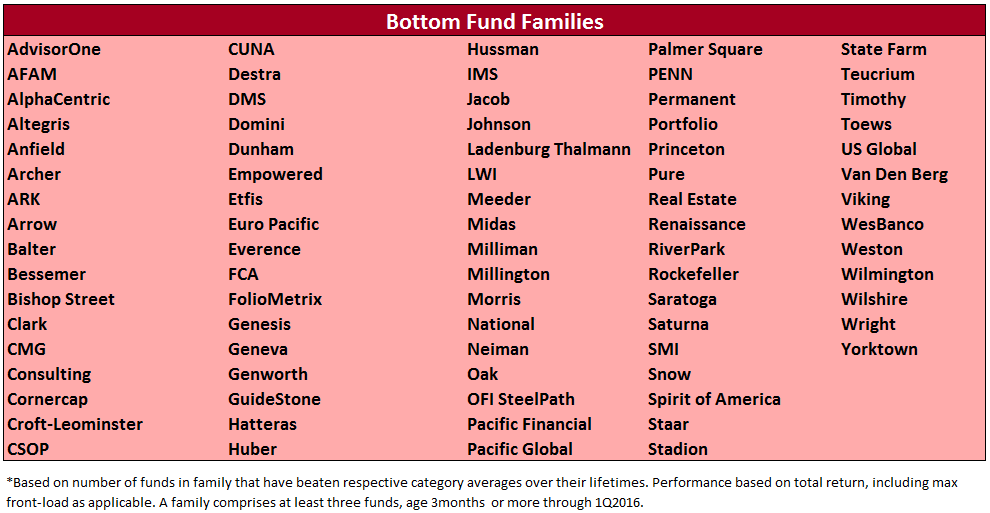
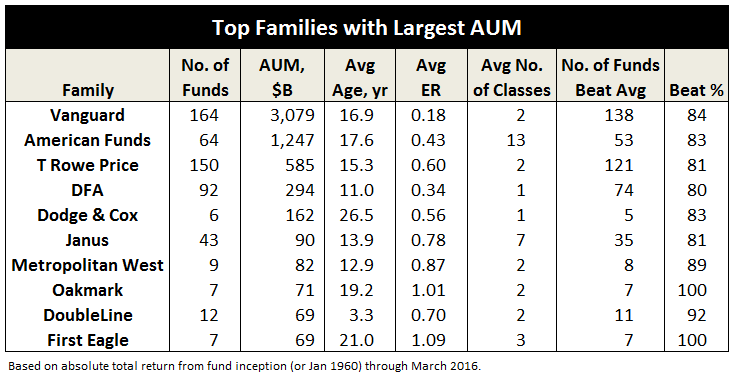
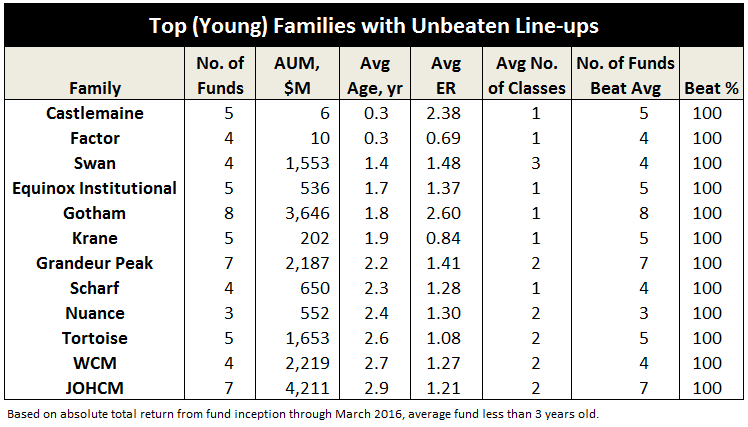
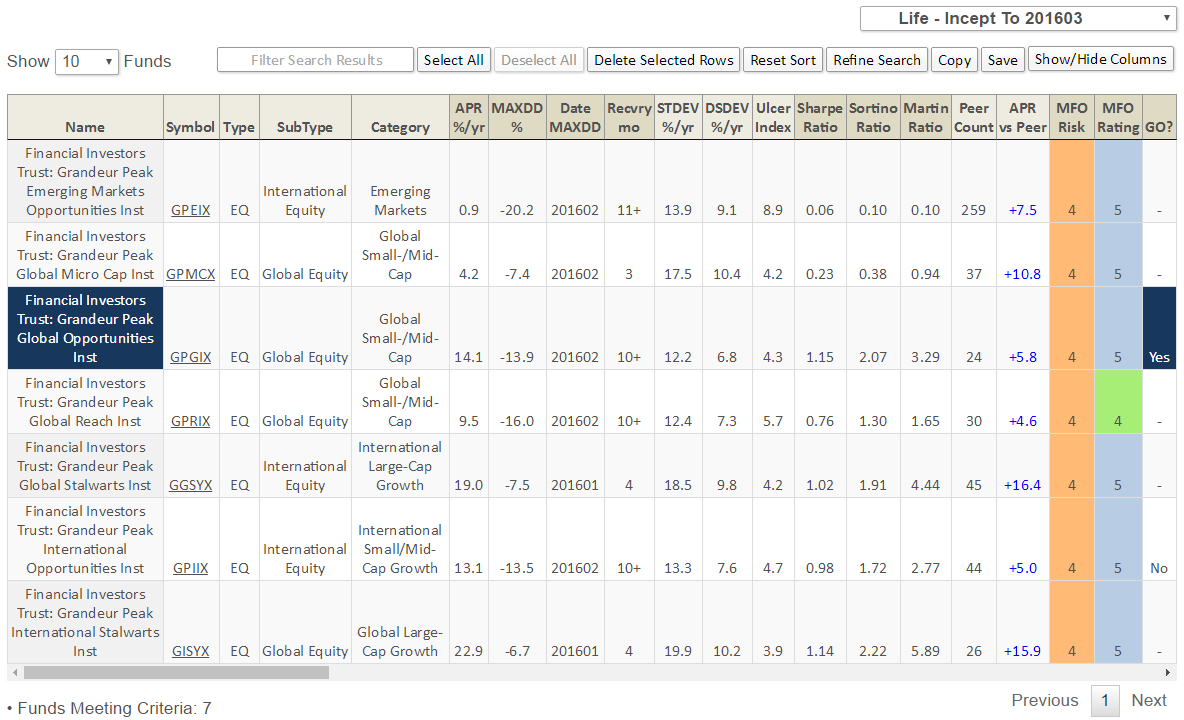
 The best performing asset class in this quarter has been – gold. Actually the best performing asset class has been the gold miners, with silver not too far behind. We have had gold with a mid-teen’s total return. And depending on which previous metals vehicle you have invested in, you may have seen as much as a 60%+ total return (looking at the germane Vanguard fund). Probably the second best area generically has been energy, but again, you had to choose your spots, and also distinguish between levered and unlevered investments, as well as proven reserves versus hopes and prayers.
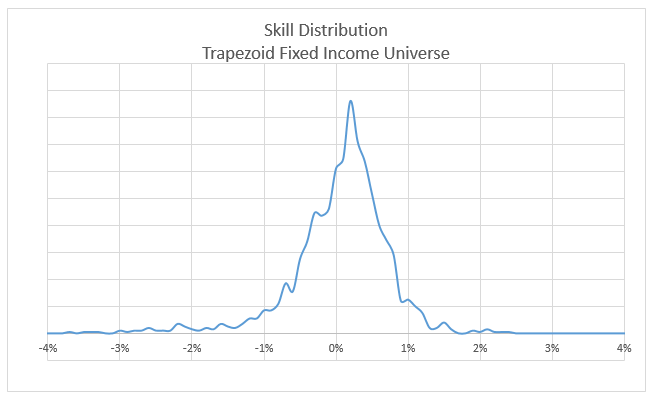
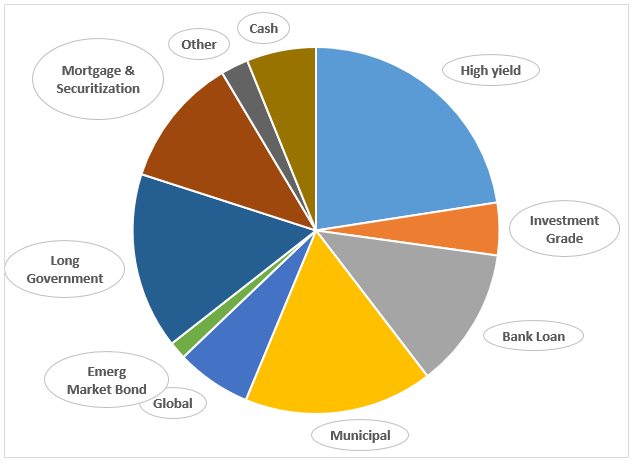
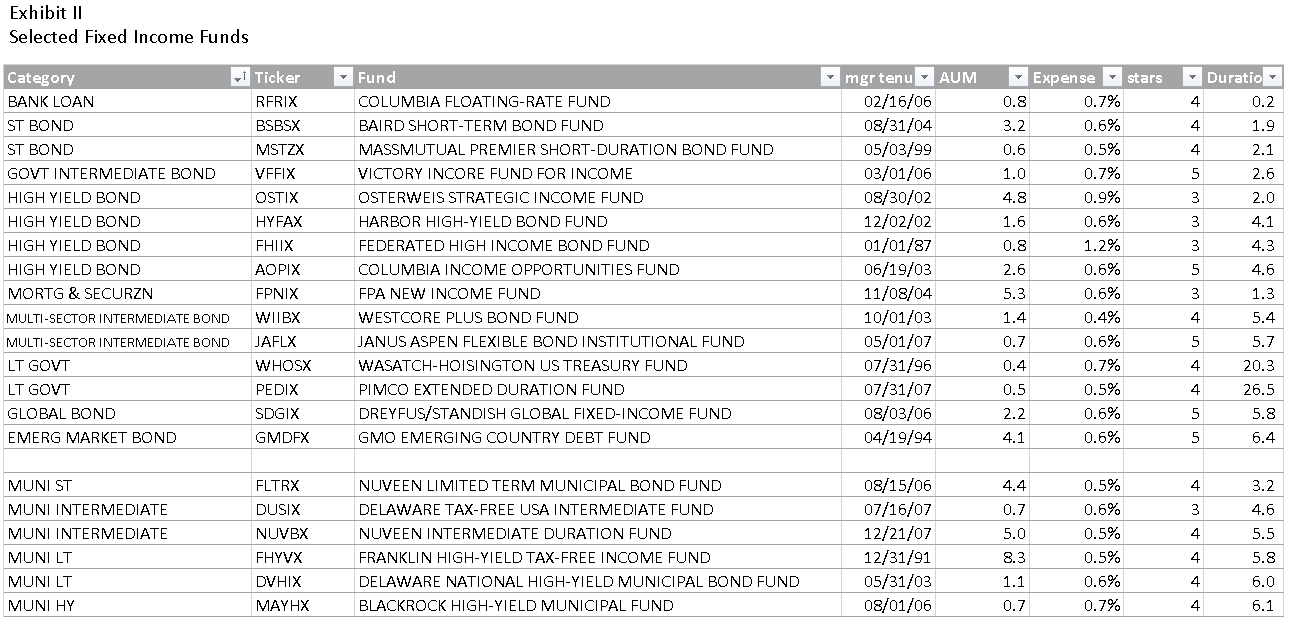
 April has come to a close and another Fed meeting has passed without a rate rise. At the same time, markets have continued to rally with the equity market, as measured by the S&P 500 Index, gaining another 0.39% in April, bringing the 3-month total return to 7.05%. Bonds also rallied as the Barclays U.S. Aggregated Bond Index gained 0.38% in April, and 2.02% over the past 3-months. Not bad for traditional asset classes.
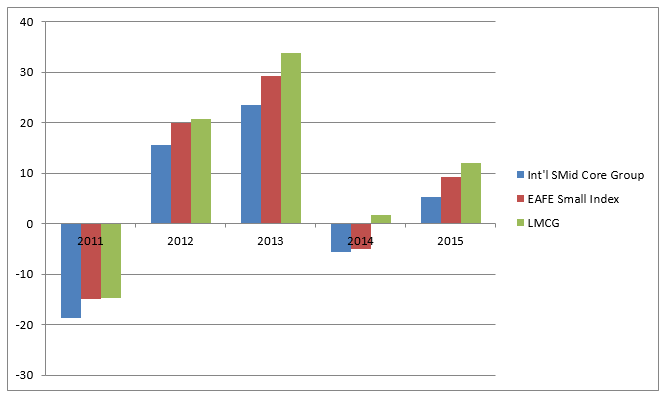
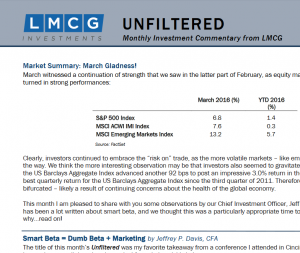 The
The  We’ve been following Bob’s posts for the past 10 or 15 years where, as BobC, he’s been one of the most respected, thoughtful and generous contributors to our discussion board and the FundAlarm’s before that. The Observer aspires to serve two communities: the small, independent managers who are willing to stray from the herd and who are passionate about what they do (rather than about how much they can make) and the individual investors who deserve better than the timid, marketing-driven pap they’re so often fed. As we begin our sixth year, we thought that finding someone who is both active in the industry and broad in mind and spirit would allow us to serve folks better.
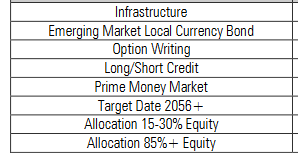
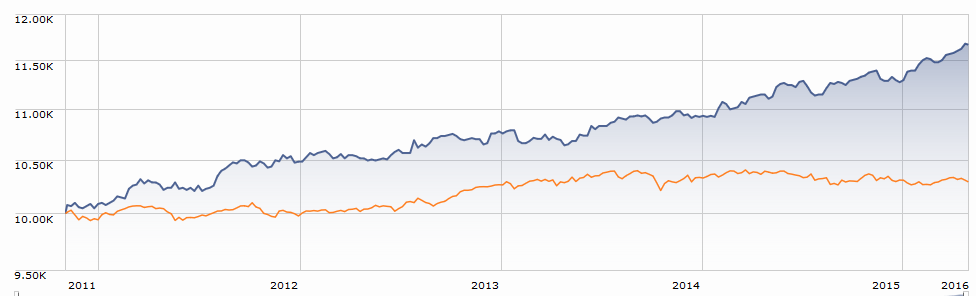
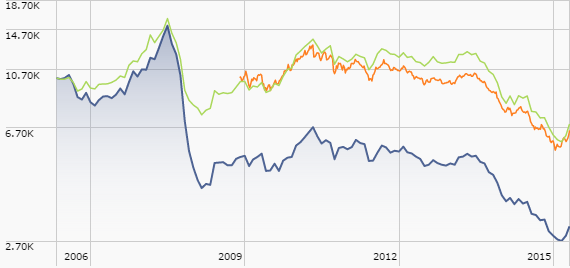
 A queer and wonderful ride. Bernie Klawans – an aerospace engineer – ran it for decades, from 1971-2011, likely out of his garage. One-page website, no 800-number, no reports or newsletters or commentaries. Also an incredibly blurry logo that might well have been run through a mimeograph machine once or twice. Mr. Klawans brought on a successor when he was in his late 80s, worked with him for a couple years, retired in April and passed away within about six months. Then his chosen successor, Craig Arnholt, died unexpectedly within a year. The Board of Trustees actually managed the fund for six months (quite successful – they beat both their LV peers and the S&P) before finding a manager who’d run the fund for a pittance. The new guy was doing fine then … kapow! He lost 22% in September and October of 2014, when the rest of the market was essentially flat. That was a combination of a big stake in Fannie and Freddie – adverse court ruling cut their market value by half in a month – and energy exposure. He’s been staggering toward the cliff ever since.