


Objective and strategy
The managers seek to maximize long-term return on capital. They can invest in firms of any size, but mostly invest in mid- to large-cap US firms and invest through both common stocks and convertibles. They pursue a patient value approach to investing which favors companies which meet at least one of these three criteria:
- records of above-average growth of sales and earnings over the past 5 to 10 year span and are selling at a price which Fenimore believes is at a discount from the true business worth of the company
- become severely depressed in the market because of adverse publicity and are, thus, selling at a deep discount to the perceived future potential value of the company; and
- the capability of achieving accelerated growth of earnings and the current price understates this potential.
In many cases that translates to growth companies temporarily selling at value prices, which helps explain the divergence between Fennimore’s value discipline and Morningstar’s assignment of them to the mid-cap growth group.
In general the managers prefer to remain fully invested though stretched valuations have led them to hold about 8.5% cash currently (12/31/17).
Adviser
Fenimore Asset Management, Inc. Fenimore was founded in 1974 by Thomas Putnam, who still serves as portfolio manager and chairman. The firm is headquartered in Cobleskill, New York, and provides advisory services to individuals, pension and profit sharing plans , corporations, and non-profit organizations throughout the US. The firm has $2.8 billion in assets under management, and offers nine investment platforms including the three FAM funds.
Manager
Thomas O. Putnam, Chairman, John D. Fox, CFA and Andrew P. Wilson, CFA of Fenimore Asset Management, Inc. Mr. Putnam has managed the Fund since the Fund’s inception in 1987. Mr. Fox has co-managed the Fund since 2000. Mr. Wilson has managed the Fund since July 17, 2017. Mr. Putnam co-manages the other two FAM funds while Messrs. Fox and Wilson are responsible only for this one.
Strategy capacity and closure
The advisor did not respond to a request for this information. Assuming that the managers want to maintain the freedom to hold a few small cap positions each of which represent 1-2% of the portfolio, which is where they are now, the strategy could accommodate at least $3 billion.
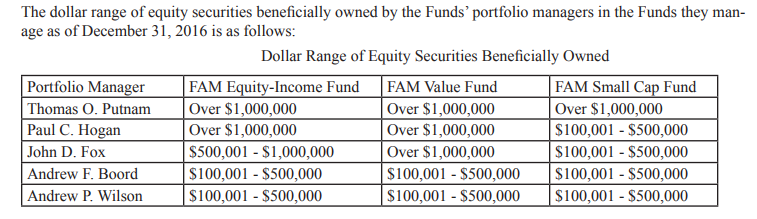
Management’s stake in the fund
Substantial and widespread. Details are below.
Active share
“Active share” measures the extent to which a fund’s portfolio differs from its benchmark or its peers. The general notion, supported by considerable research, is that if your portfolio looks an awful lot like your index’s, then your portfolio is going to act an awful lot like the index’s. Managers earn their keep through their willingness to make independent, contrary, and sometimes wrong, judgments about where to place their investors’ money.
The leading researcher on active share claims, “Research has shown that as a group and over fairly long periods of time:
- funds with low Active Shares have tended to underperform their benchmarks net of costs
- funds with high Active Shares have tended to outperform their benchmarks net of costs, especially among funds that do not trade frequently, among small cap funds and among funds that do not have very large assets under management.”
The subject is controversial (see “Interpreting Active Share”), in part because large funds with low active share push back against being called “closet indexes” and in part because the early research was rather too simplistic.
As a general rule, a large cap fund with an active share above 90% is highly active. FAM Value qualifies as a high active share fund.
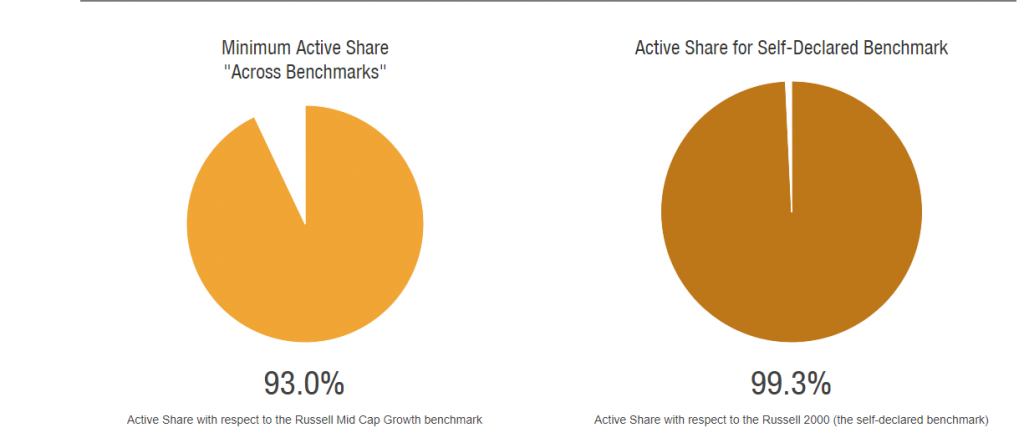
Graph from ActiveShare.info
Graph from ActiveShare.info.
Opening date
January 2, 1987.
Minimum investment
The minimum initial purchase is $500 for a regular account and $100 for an individual retirement account. The minimum subsequent investment is $50.
Expense ratio
1.19% on assets of $1.5 billion, as of July 2023.
Comments
There’s something reassuring here.
Actually, there’s rather a lot reassuring here.
It starts with the clarity and simplicity of their strategy. The statutory prospectus captures the fund in all of three pages; and the principal investment strategy requires fewer than 100 words to explain.
It includes the stability of their team. The newest member of the management team has been on-board for seven years, which the others have 20 and 40 year tenures. The only person to leave the team departed 18 years ago. Four of the five shareholder services folks have been around since 1993, and the fifth since 1999.
It certainly includes unprecedented levels of insider ownership. Most investors know that it’s important for managers to have “skin in the game.” Funds with the highest levels of manager ownership outperform their peers in about two-thirds of rolling five and ten year periods. Sadly, about half of equity funds have zero manager ownership. Fenimore is an outstanding exception to that rule; every manager is substantially invested in every FAM fund, including ones they don’t manage.
What’s less well known is that ownership by the fund’s trustees is also important. When a fund’s trustees have their own money at risk, they tend to be a lot more vigilant, expect far more thoughtful risk management and are far likelier to push for change when a fund under-performs. Sadly, industry-wide, it’s even more rare than manager ownership. Except at FAM. Every independent trustee is substantially invested in every FAM fund.
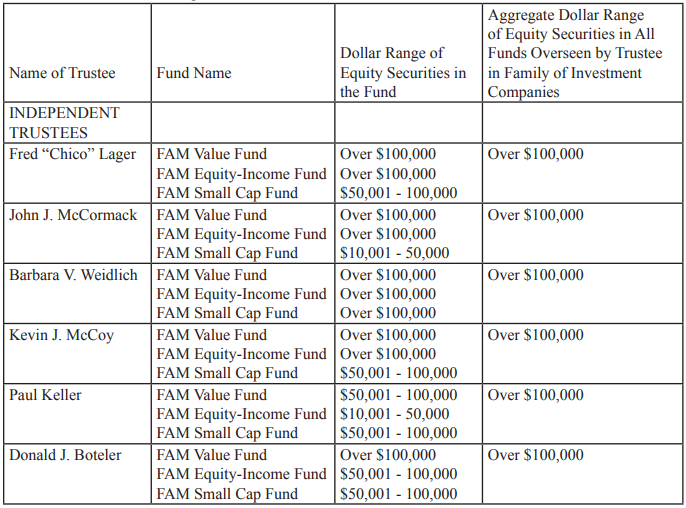
That’s all the more striking because Fenimore’s trustees make just under $20,000 for their service.
Finally, it ends with consistently excellent performance.
Lipper categorizes FAMVX as a multi-cap core fund, which strikes us as more accurate than Morningstar’s assignment of it to the mid-cap growth category. Why? In part because only 27% of the portfolio is invested in mid-cap growth stocks while the remainder of the portfolio is scattered across all nine style-boxes.
Below is the record of FAMVX’s performance against its multi-cap core peer group over each period we track. In any cell with the words “FAM win,” the performance of the fund was superior to that of its peers: absolute returns were higher, volatility was lower, and the risk-return balance was better.
| 3 years | 5 years | 10 years | 20 years | Since inception | |
| Total returns | FAM wins | FAM wins | FAM wins | FAM wins | FAM wins |
| Maximum drawdown | FAM wins | FAM wins | FAM wins | FAM wins | FAM wins |
| Standard deviation | FAM wins | FAM wins | FAM wins | FAM wins | FAM wins |
| Downside deviation | FAM wins | FAM wins | FAM wins | FAM wins | FAM wins |
| Bear market deviation | FAM wins | FAM wins | FAM wins | FAM wins | FAM wins |
| Sharpe ratio | FAM wins | FAM wins | FAM wins | FAM wins | FAM wins |
MFO’s designation for the funds with the most compelling risk-return profile is “Great Owls,” a modest play on the Great Horned Owl which inspired our logo. “Great Owl” funds have delivered top quintile (that is, top 20%) risk-adjusted returns, based on Martin Ratio, in its category. The Martin Ratio, like the better known Sharpe and Sortino ratios, attempts to create a risk-return snapshot. The difference between Martin and the others is that Martin is more sensitive to mitigating deep losses. Our colleague (and impresario of MFO Premium) Charles Boccadoro writes, “After the 2000 tech bubble and 2008 financial crisis, which together resulted in a ‘lost decade’ for stocks, investors have grown very sensitive to drawdowns. Martin excels at identifying funds that have delivered superior returns while mitigating drawdowns.”
Of the 78 multi-cap core funds with records over 20 years or more, only two have earned Great Owl designations for the past three year, five year, 10 year and 20 year periods: FAM Value and Principal Capital Appreciation (CMNWX), a load-bearing fund.
Which is to say, FAM has a virtually unmatched record of consistency in serving its investors.
We find that reassuring.
Morningstar, which suspended coverage of the fund exactly five years ago, seemed to agree. Here are the titles from their last 17 reviews (starting with 2013 and going back to 2005) before they lost interest:
- A rough patch doesn’t diminish this fund’s appeal.
- This fund has been consistent.
- This fund knows what it knows.
- This fund has a proven formula.
- This mutual fund channels Warren Buffet (sic).
- This mutual fund is a fine core holding.
- This mutual fund provides the best of both worlds.
- This mutual fund is demonstrating its worth.
- This is still a solid mutual fund.
- This mutual fund is sensible.
- This mutual fund is good at what it does.
- It takes a specific mindset to own this mutual fund. (The mindset is “patient and long-term focused,” by the way.)
- This mutual fund is a smart diversifier for a growthy portfolio.
- We like this mutual fund’s disciplined approach.
- This mutual fund would be a good diversifier.
- This mutual fund is a strong mid-cap option.
- This mutual fund’s approach isn’t conventional, but we find it compelling.
The “rough patch” mentioned in the last analyst review refers to the fact that the fund’s 11.3% return in 2012 trailed 75% of its peers.
Are there reasons for caution? Two come to mind. First, Mr. Putnam is closer to the end of his career than to its beginning. He’s been guiding the fund, and the firm, for 43 years and he’s around 73 years old. One might have reasonable concern about his changing role at the firm and with the firm’s succession planning. Second, the fund goes its own way without regard for the behavior of indexes or peers. Of necessity, that means that it can suffer stretches of relative and absolute underperformance. Relative to its Morningstar peer group, for example, if underperforms once every couple years. When MFO calculated the fund’s five-year rolling average for the past 20 years, the range of returns of (-5.6) to 20.9 with an average return of 8.3%. What does that mean? It means that there was one five-year stretch in the past 20 years that saw an average annual loss of 5.6%, though the average annual return for someone holding the fund for five years during that period was 8.3%. To be clear, that’s a much smaller loss and a much higher average gain than an investor in a broad-based index fund would have seen in the same period, but it is a loss nonetheless.
Bottom Line
At $1.2 billion, FAM Value is neither unknown nor unmanageable. It deserves to be better known, most especially by equity investors looking for a committed team, a value-sensitive strategy and a long, consistent record.
Fund website
FAM Value. The information on-site is pretty rich but it’s mostly in the form of periodic letters to shareholders. The thing most folks call a fact sheet is under the tab called “FAM Graph.”