


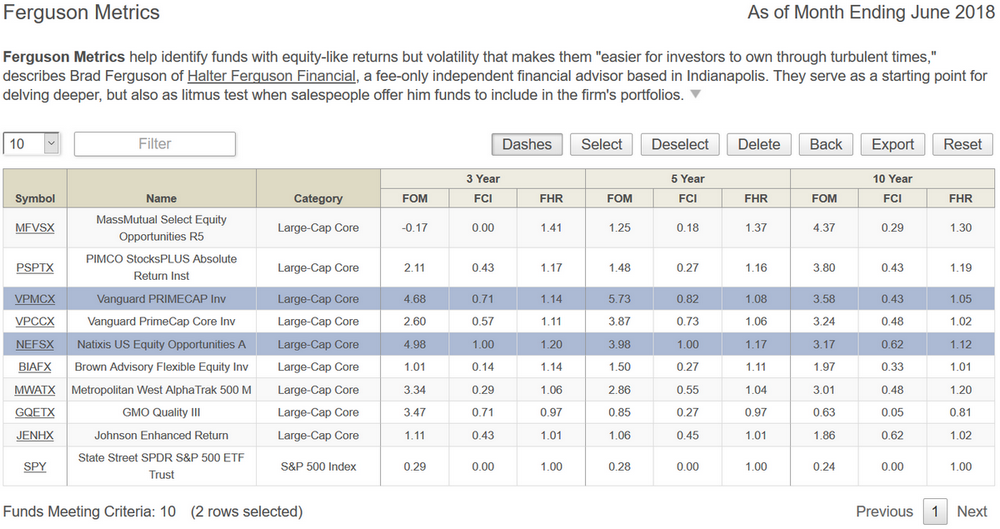
Ferguson Metrics help identify funds with equity-like returns but volatility that makes them “easier for investors to own through turbulent times,” describes Brad Ferguson of Halter Ferguson Financial, a fee-only independent financial advisor based in Indianapolis. They serve as a starting point for delving deeper, but also as litmus test when salespeople offer him funds to include in the firm’s portfolios.
There are three main metrics in Brad’s methodology:
- Outperformance Metric (FOM) – Measures fund outperformance based on annualized absolute return versus peers for the past 3, 5, and 10 calendar years, plus any year-to-date partial year. FOM is in units of percentage per year, %/yr.
- Consistency Index (FCI) – Measures fund consistency based on how a fund performs each calendar year relative to its peers and hurdle rate. If a fund’s absolute return beats its peers by its hurdle rate, the fund scores a win. If it underperforms by its hurdle rate, it scores a loss. Anything in-between is a push. An FCI of 1.00 is the best possible value and means the fund beat its peers by at least its hurdle rate each calendar year across the evaluation period, while an FCI of -1.00 is the worst possible value.
- Hurdle Rate (FHR) – Sets the absolute return percentage that a fund must beat its peers to score a win or loss in a calendar year. For funds that track to SP500 volatility, this value is (or close to) 1.00 %/yr. FHR is higher or lower based simply on the ratio of annualized standard deviation of the fund to that of the SP500 over the same evaluation window. FHR is effectively in units of percentage per year, %/yr.
Brad prefers calendar year performance versus say fixed or rolling periods simply because “that’s what my clients monitor … it’s what influences behavior.” He believes FCI especially helps set expectations, enabling he and his clients to be more patient during periods of underperformance.
Nine large cap core funds in Lipper’s Global Data Feed through June have beaten their peers by 2% per year over the past 10 years, as shown in the MFO Premium table below, which includes SPY for reference.
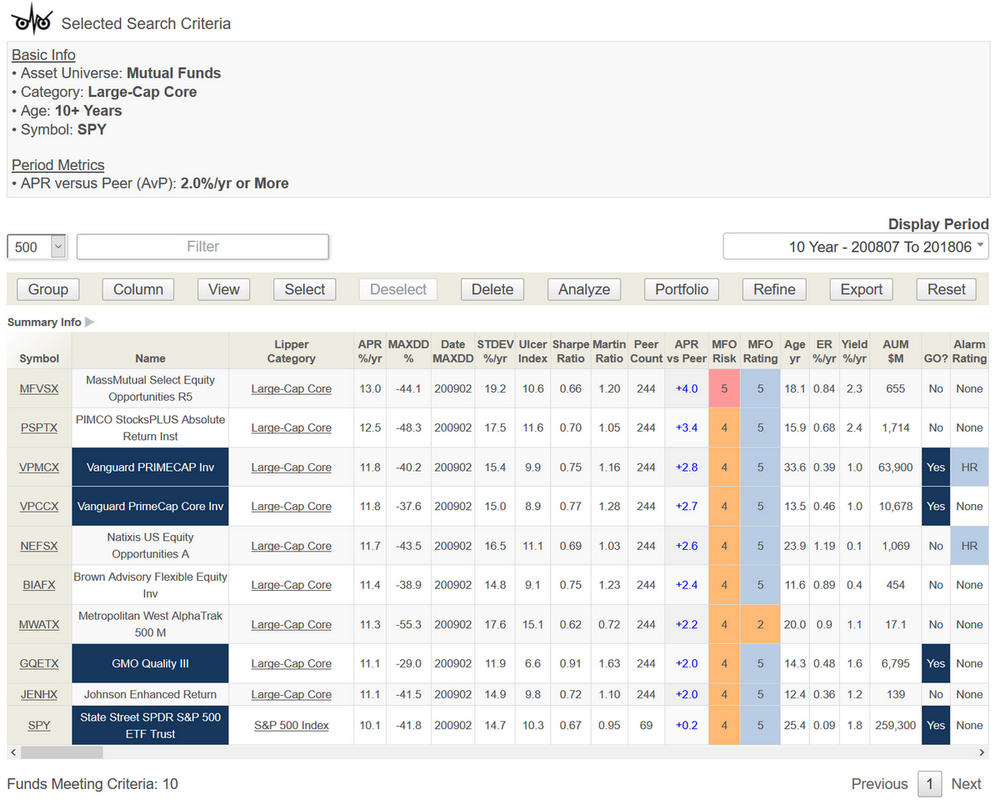 They include three MFO Great Owl funds, including Vanguard’s PRIMECAP (VPMCX), which is also an Honor Roll fund.
While MassMutual’s Select Equity Opportunities (MFVSX) may have offered the highest absolute outperformance, PRIMECAP and Natixis US Equity Opportunities (NEFSX) may in fact have been easiest to own since the Great Recession based on FCI.
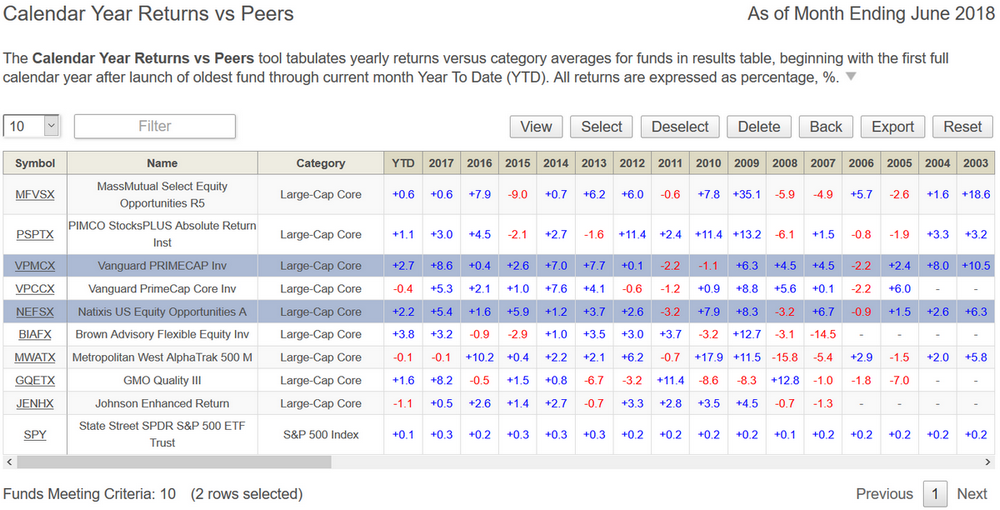
 Looking at the calendar year outperformance reveals why … consistent outperformance each calendar year.
 Aided by Ferguson Metrics, Brad maintains a list of about 200 mutual funds on his radar scope. In the months ahead, Brad has offered to share more about his methodology, which we plan to post on MFO’s Premium site.