Monthly Archives: August 2018

August 5, 2018

By David Snowball

Dear friends,

Thanks for your patience. The end of July and beginning of August brought a bunch of challenges.

This month’s issue has a lot of interesting content; just not quite so much as we’d planned. With luck, we’ll shift the vast bulk of it to September.

Zoom in to Charles and the MFO Premium walk-through

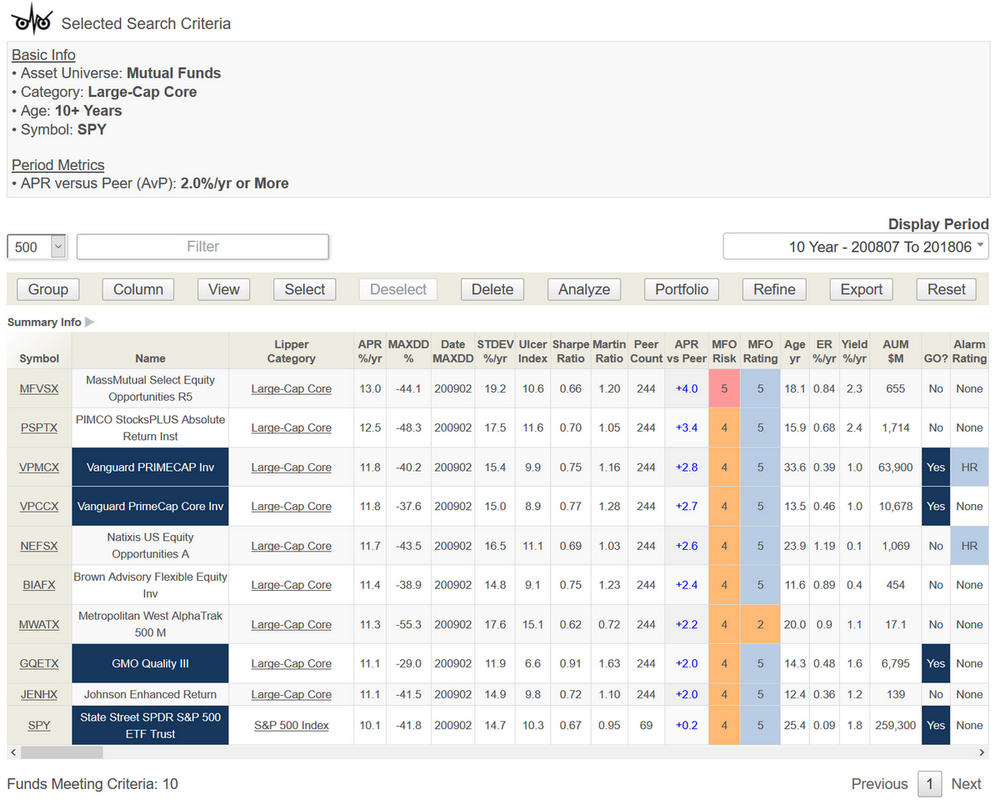
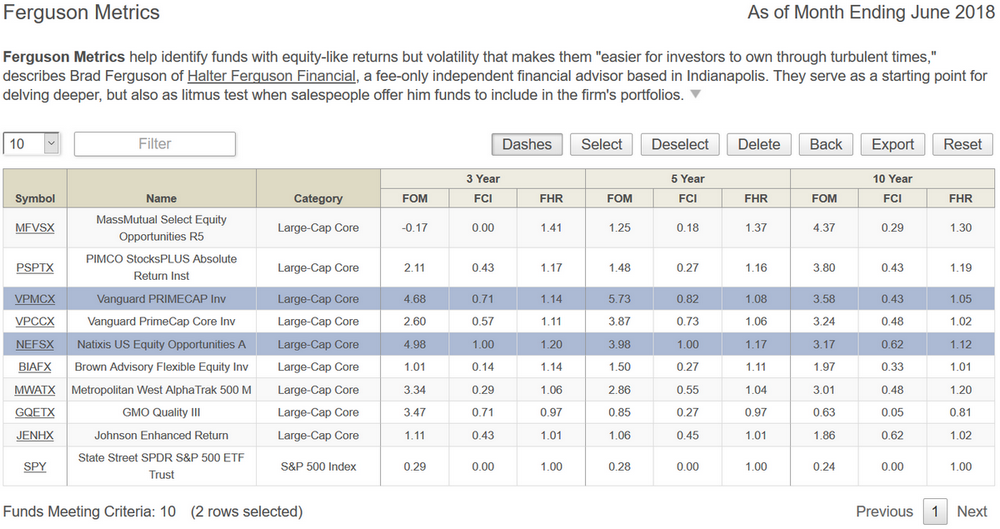
MFO Premium offers a ridiculous wealth of information for a pittance. I am always in awe of Charles’s energy and his drive to adapt the site to the needs and interests of its readers. This month he’s introducing a new analytic tool, the Ferguson Metrics. They’re a fund evaluation tool used by Brad Ferguson of Halter Ferguson Financial in Indianapolis. Brad reached out to us to discuss adding them to the MFO screener suite; Charles was intrigued and, voila, he adapted the Premium site to accommodate them.  

That’s precisely how a lot of capabilities – from correlation matrixes to rolling averages – have come to be included: readers identified a sensible addition and Charles took their suggestions to heart. Thanks to him and you both for your roles in making Premium premium. 

For folks interested in learning more about the site and, in particular, learning how to use the tools to their greatest advantage, should plan on joining us for a free, lively, interactive webinar.  

Two sessions planned, one hour each nominally, on Tuesday 7 August 2018 at 2pm and 5pm Eastern … 11am and 2 pm Pacific. 
 
Like last time, we will employ easy-to-use Zoom. 
 
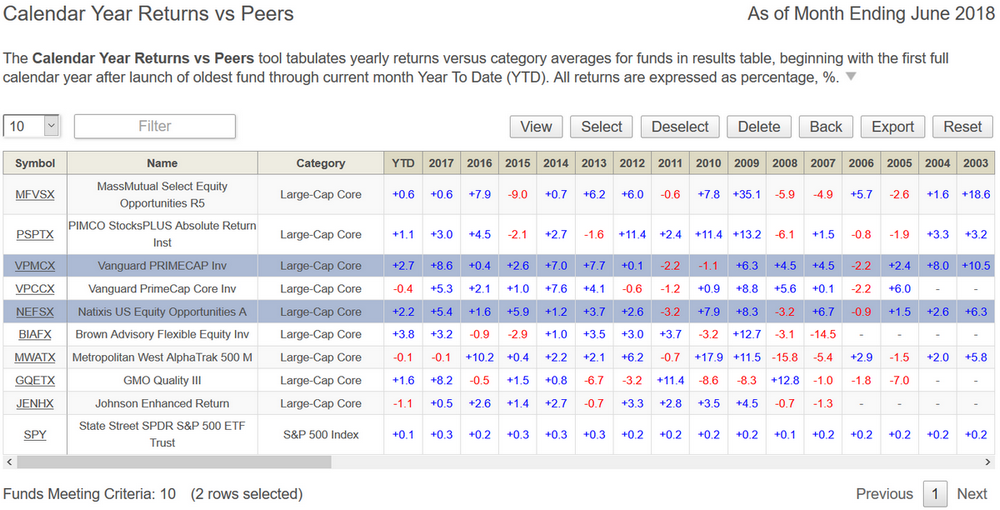
Charles reports: “We plan to illustrate numerous upgrades since our last webinar, including calendar year and period performance analysis, batting averages, Ferguson metrics, upside and downside capture, MultiSearch column organization and control, and the new Lipper Global Data Feed.” 
 
Please register here for first session: 
 
https://zoom.us/meeting/register/6836e49b19b99183d746f627e8486654 

Or, here for second session: 
 
https://zoom.us/meeting/register/704989d8e7a8820ecde7dc3c8da9331e 

Regrets for a minor software hiccup … Fixed!

Update 21 August 18 …

Just migrated MFO Premium to DreamHost from SiteGround, which has hosted the site since launch in November 2015. The reason for the change is that Paypal recently started enforcing more up-to-date versions of TLS (Transport Layer Security) than were available on SiteGround’s server, so it stopped handshaking with our subscriber management software, called UserBase. That meant we had to manually approve subscribers after they paid on PayPal.

We apologize for any hassle! That issue should be fixed now.

The site appears fully functional and the transition should be transparent, but if you see anything amiss (for example, missing newer WatchLists), please email ([email protected]) and we will address soonest.

———

If you’ve signed up for MFO Premium, your site access may have been affected by a danged annoying software glitch. At base, when you choose to make a contribution and gain Premium access, the PayPal software has to pass a thumbs-up to the UserBase software. A recent update to the program has goofed up that link, so new Premium members might not be getting immediate access. We’re working with the programmers behind UserBase to get that straightened out. 

If you’ve contributed $100 or more in support of MFO through the MFO Premium signup link, you should get a confirmation email and almost immediate site access. If you’ve contributed (bless you!) and haven’t been able to get in quickly, write Chip or Charles and they’ll manually create an account for you, pronto.

Many apologies for the inconvenience, many thanks for the support. 

Thanks, as always 

Thanks so much to Brad from Indiana and William from San Clemente. Your donations help more than you might know. As ever, thanks to our faithful subscribers, Greg and Deb. We appreciate you!

Here are some quick snippets, rather longer than Briefly Noted pieces (Briefly Noted is, by the way, my favorite feature each month; it’s where I hide some of the Easter eggs), but noticeably shorter than stories. 

When bad things happen to good funds 

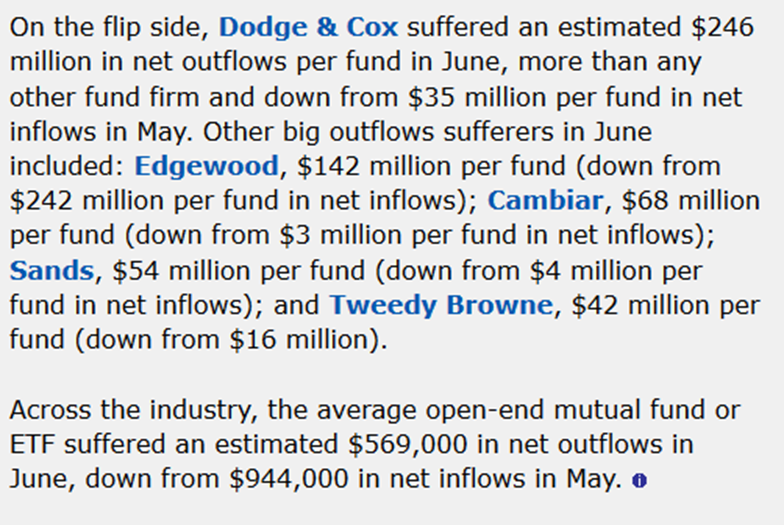
The folks at MFWire ran a couple stories in July based on analyses of fund flow data. “A Value Equity Shop Leads This Pack” (07/09/2018) highlights LSV as the small firm with the greatest inflows. JOHCM and AlphaCentric. Interested parties might check our recent pieces on LSV , JOHCM Global Income Builder and AlphaCentric Income Opportunities. 

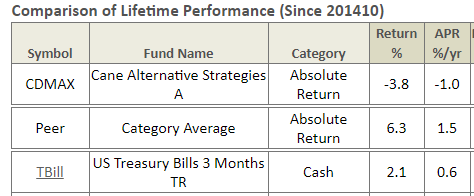
On the flip side, people (I’m hopeful that it’s “people who don’t read MFO”) yanked a quarter billion out of Seafarer Overseas Growth & Income, as well as smaller but still substantial amounts from Leuthold, Hennessey, Wasatch and Homestead. By and large, those are investors surrendering to the temptation to let short-term performance drive their long-term decisions. Seafarer, for example, returned 26% to its investors last year which put it near the back of the EM pack. I nod: Seafarer’s strength is that it produces strong absolute returns in frothy markets though its relative returns lag because it refuses to toss shareholder money into the froth. In general, when the markets turn down, Seafarer’s caution repays its investors and sets them up for the next upturn. So, 2017, no problem for me. It trailed its peers by about 300 bps in the first four months of the year, at which point two things happened: (1) shareholders fled and (2) the fund began solidly outperforming its peers again. 

In general, if your long-term plan hasn’t been revised and your managers continue to maintain their discipline, you’ll find it more profitable to maintain your discipline.  

Columbia Contra-Contrarian  

Brad Ferguson wrote to offer his nominee for most ironic mutual fund name ever, Columbia Contrarian Core (LCCAX). The irony is embodied in this list of the fund’s top six holdings: 

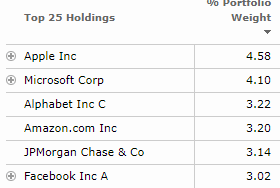
Hmmm … well, they don’t own Netflix. Maybe Columbia Go With The Mo was taken? 

LCCAX strikes me as a perfectly fine fund but only modestly “contrarian.” Morningstar shows it has a 95-96% correlation to the S&P 500 depending on which time period you test. MFO Premium shows it with a 98% correlation in the current market cycle with a 99% correlation during the market crisis of 2007-09. 

Morningstar’s valuations 

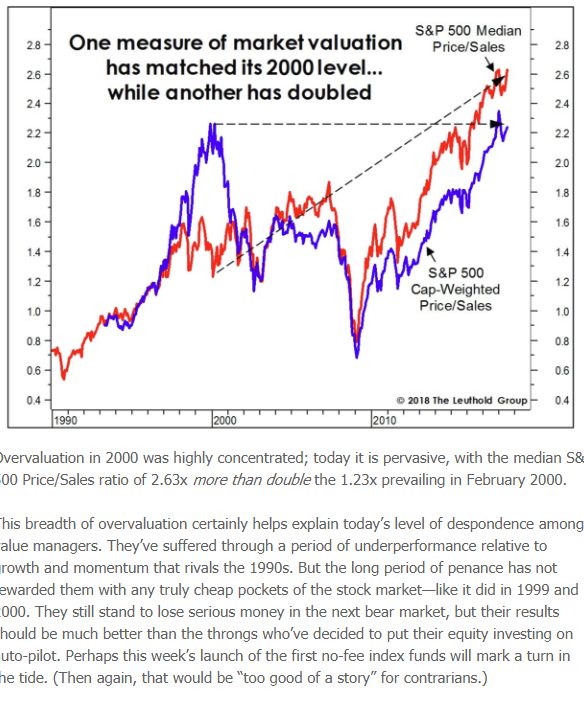
It takes exceptional mental gymnastics to conclude that the U.S. stock market is not broadly and substantially expensive. (Congrats to those who’ve convinced themselves of it; your returns over the past five years have been exceptional!) The evidence presented by the Leuthold Group and others is that overvaluation now is worse than it was before the 2000 crash, because it’s broader now than it was then. Value investors flourished in 2000-01 because the late 1990s bubble led investors to ignore rock-solid companies and their stocks remained undervalued. Leuthold argues that’s no longer the case: the race to the top infected middling companies as well as market darlings. 

That’s back to a fascinating bit of news. A Marketwatch story quoted the head of Morningstar Europe as saying that, based on valuations alone, the US stock market is poised to return zero for the next decade: 

“Our expectation at the moment is that you won’t have any real return from U.S. equities over the next 10 years,” said Dan Kemp, chief investment officer for Europe, the Middle East and Africa, at a company event Wednesday in London. In the chart he shared below, the black line is pretty close to zero for American stocks. (“Brace for a lost decade for U.S. stocks, warn Morningstar strategists,” 07/05/2018) 

That forecast is based on a top-down analysis of “the market” rather than an analysis of each individual firm and it assumes that valuations drive returns over the long-term. The accompanying chart is a little less dour than GMO’s monthly projections, but not much: 

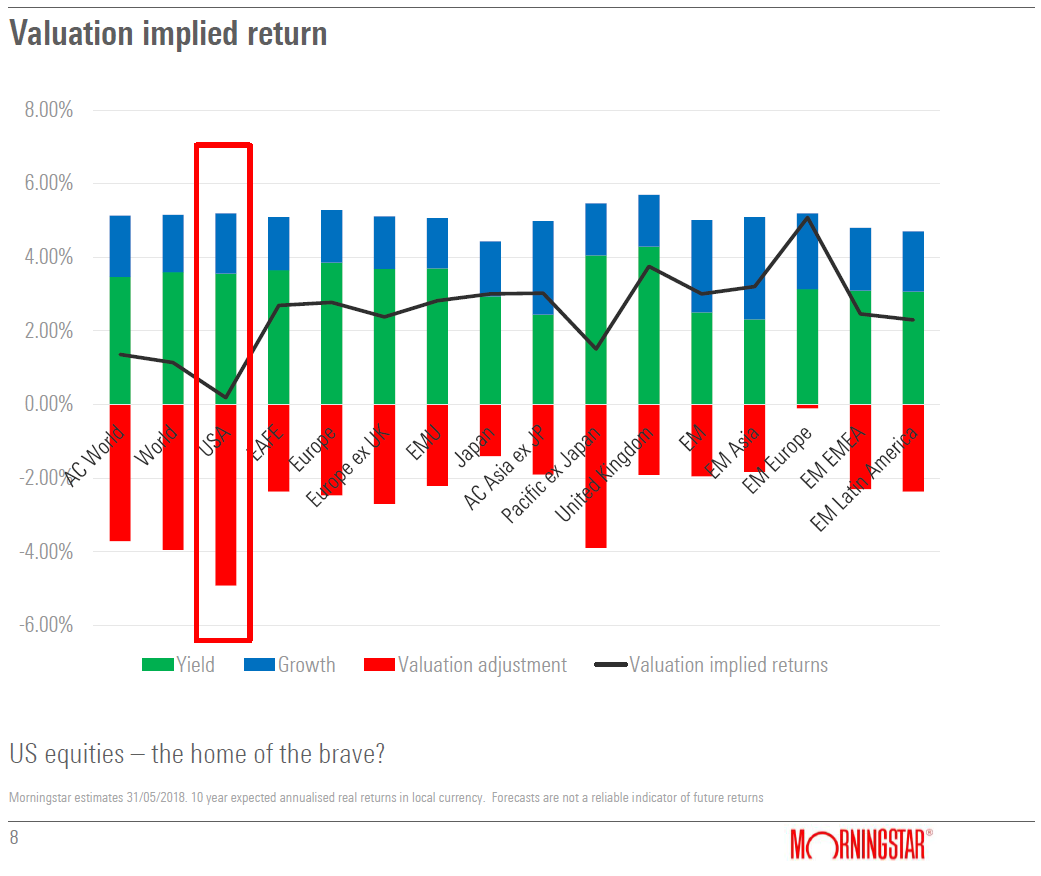
A rough translation is that there’s enough economic value to support market returns – worldwide – of about 5% (that’s the top of the blue line) but investors have so egregiously overpaid for some stocks that their prices will inevitably come back to earth (that’s the bottom of the red line). So if you reduce possible gains to account for overpaying, you end up at the black line. US – zero, emerging Europe – up 5%. 

That implies that the US market is the world’s most overpriced. On the same day that the head of Morningstar Europe made that announcement, Morningstar US estimated that the broad US market was undervalued by 2%. I asked the folks at Morningstar about the difference; they reached out to Mr. Kemp on our behalf and he attributed it to “a slightly different valuation methodology” and the difference between top-down and bottom-up valuation calculations. 

Because those are dramatically different conclusions, I followed-up by asking for “Any thoughts on how to reconcile the two conflicting messages: the market’s undervalued, we’re fine versus the market’s so overvalued that we’re toast for the next decade?” 

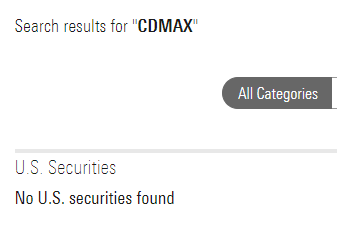
The folks at Morningstar haven’t responded yet to that question but they have removed their fair market calculations from the Morningstar.com website: 

It’s good to conscientiously test, review and refine your methodologies. I’ll be curious to see whether the new methodology materially changes the old conclusion. More to come! 

And then there’s Tamiflu… 

A note in closing that, I know, affects very few of you directly. It appears that something like 9% of East Asians have a genetic mutation that causes one of their brain proteins to look a bit like a flu virus. Some researchers believe that Tamiflu mistakes the brains of such folks for the enemy and attacks it. The result can include “side effects, ranging from neuropsychiatric, gastrointestinal, to hyperthermia and skin problems.” In Japan, for instance, there were a disturbing number of suicides – especially among teens – in Tamiflu users which led the government in 2007 to ban use of Tamiflu for children between 10 and 19. That ban is now under review. Folks at the Mayo Clinic agree that the risk is not widely perceived in the US, likely because the average practitioner sees too few teenaged East Asians to recognize a pattern of problems. 

If you’re the parent of a child of East Asian ancestry, you might want to talk with your health care provider before agreeing to the drug. For other groups, the consensus seems to be that serious side effects are rare enough that the benefits of Tamiflu might outweigh the risks. I’m not competent to judge those claims. 

Will’s off to college, beginning August 29th. Pray for the good folks at the University of St. Thomas and for the unsuspecting citizens of the Twin Cities in general. My child’s about to descend on them. 

Wishing you a grand end of summer, 

david's signature

Dotcom 2018 – This Time It’s Different?

By Edward A. Studzinski

“If you attack stupidity you attack an entrenched interest with friends in government and every walk of public life, and you will make small progress against it.”

     Samuel Marchbanks

Those of us who were value investors and running money back at the beginning of 2000, remember what a horrible time it was. For some years value had been lagging growth in performance. We were routinely told, either in emails or other communications from our investors, that our style of investing was never coming back, that we were dinosaurs who hadn’t recognized that we were extinct, and that technology stocks were the place to be as they represented the new economy. Then we got to March of 2000.

From March of 2000 through October of 2002, the NASDAQ Composite lost 78% of its value. Looking back afterwards, it was easy to see the signs of excess which had been cavalierly ignored. In 1999 there were 457 initial public offerings of new companies, and 117 of those doubled on the first day of trading.

By 2001, the number of initial public offerings had shrunk to 76, and none of those doubled on their first day of trading. It became increasingly clear that many of the companies that had raised capital consisted of little but a back of the envelope idea, and no business plan. In many respects, those companies were nothing more than bold grabs of capital from those only too willing to roll the dice in hopes of catching the next Microsoft. The result was the destruction of billions of dollars of investment capital. Concurrently, there was a setback to the willingness of venture capitalists to invest in new technology ideas that would come from either Silicon Valley or the Boston Route 128 Beltway.

Fast forward to July of 2018, and what do we find? Well, again value is lagging growth stock investing.

And this time it is different, because the companies that have been driving the markets, the so-called FAANG (Facebook, Amazon, Apple, Netflix, Google) stocks, are real businesses. And we would never be fooled into thinking that the growth rates of these companies are not sustainable.  And then July 25, 2018 happened. Facebook announced slowing growth numbers and missed its earnings estimates. Approximately $120B of investor capital was wiped out as the stock fell more than 19%, in the largest one-day loss for a company ever, on the U.S. exchanges.

That this sort of tumble was coming should not have been unexpected. In recent months, more and more value investors were choosing job or franchise security over any sense of responsibility to their investors and throwing in the towel to purchase in the so-called FAANG group or in other areas of technology. The rationale was that this time, these real businesses had strong balance sheets, and real earnings. And if the valuations were at extremes? If GAAP accounting did not properly represent the correct valuation multiples for these asset-light (not requiring a lot of money going into capital expenditures to replace or maintain plant and equipment) businesses? Well, another methodology would. And on we moved to new highs on the indices, but with a clearly very narrow breadth.

Which is where we sit now.  One suspects that we are engaged in one of those games of musical chairs that regularly takes hold of the markets. Participants try and figure out how long they can continue to hold on to an investment when the valuation is in never-never land. On the one hand, selling too soon may be a threat to job security. And on the other hand, not selling may also be a threat to job security. And to compound the problem, never owning the FAANG stocks may also be a threat to job security. No matter of course, if it is other people’s money that we are talking about.

A portfolio manager friend who used to run a small cap value fund for Taft Hartley money in Chicago before she fled to the warmer climate of Texas was recently updating me on money management firms in Chicago. Many have been seeing assets running out the door for all the usual reasons – performance, style, etc. Some of the smaller ones, lacking scale and diversity in their product offerings, have been closing their doors. And while the move into passive funds seems to have slowed, there has not been a wholesale reversion to active managers. Overall, the investment community seems to be in a state of flux. This coincides with what I have been hearing from other parts of the country.

Amongst the larger firms, it has been business as usual, but for the fact that stylistic differences notwithstanding, there is a tremendous amount of overlap of security ownership in both growth and value portfolios. That coupled, with the large amounts of moneys that have gone into S&P 500 index products means that any shift to sustained selling will result in a tsunami to the downside. We recommend again, as we have before, that investors reassess their risk tolerances and time horizons. If one is looking at college tuition bills or retirement within the next twelve to eighteen months, now is not the time to enter into a game of “silly buggers” with the markets.

Which brings us to the age-old question of “Who will watch the watchmen?”  Some thirty years ago, the professions such as law, medicine, and yes, investment counseling, were filled with Renaissance men and women, generally with strong liberal arts educations undertaken before their specialty training in law, medical, or business school. They had interests and hobbies, priding themselves on being familiar with subjects outside of their business areas. This tendency had come over from Great Britain, where the concept of the gifted amateur existed then and continues to exist today. It was not unusual to find for instance an attorney who collected art, might know as much about Qing Dynasty landscapes as a full-time museum curator or art dealer.

Sadly we have moved away from that model, exemplified by the average hedge fund or private equity manager, best categorized as “barbarian with money” who is now led around by the new Mandarin class of “consultants.” Hence we have those who label themselves as collectors, whose collections are replete with items purchased, not because the individual liked the art, but rather because in ark-like fashion a “consultant” had suggested that he or she must have one of the specified items, which would of course double or triple in value in a very short time.

We now see the same thing in the investment world, where the clients, especially endowments, now hire consultants to tell them how to allocate their investments to outperform some artificially constructed benchmark. The problem comes when the advice of the consultant is used to avoid taking ownership of the decision-making process. Common sense gets checked at the door. Part of the problem is the American tendency to try and reduce everything to a science rather than recognize that sometimes an art is involved, even if it is relegated to the selection and application of the right mental models. Sometimes however we get lazy about the process. And that leads to an effort to avoid taking responsibility for the decisions made, because not everything can be reduced to a decision tree.

The same thing applies to individuals. At the end of the day, what the broker or financial professional recommends to you is just that, a recommendation. You, as the client, need to participate in the process, and recognize that you need to take ownership of the decisions made. And you need to make sure you are not fooling yourself about your own risk tolerances and patience.

Introducing Ferguson Metrics

By Charles Boccadoro

Ferguson Metrics help identify funds with equity-like returns but volatility that makes them “easier for investors to own through turbulent times,” describes Brad Ferguson of Halter Ferguson Financial, a fee-only independent financial advisor based in Indianapolis. They serve as a starting point for delving deeper, but also as litmus test when salespeople offer him funds to include in the firm’s portfolios.

There are three main metrics in Brad’s methodology:

  • Outperformance Metric (FOM) – Measures fund outperformance based on annualized absolute return versus peers for the past 3, 5, and 10 calendar years, plus any year-to-date partial year. FOM is in units of percentage per year, %/yr.
  • Consistency Index (FCI) – Measures fund consistency based on how a fund performs each calendar year relative to its peers and hurdle rate. If a fund’s absolute return beats its peers by its hurdle rate, the fund scores a win. If it underperforms by its hurdle rate, it scores a loss. Anything in-between is a push. An FCI of 1.00 is the best possible value and means the fund beat its peers by at least its hurdle rate each calendar year across the evaluation period, while an FCI of -1.00 is the worst possible value.
  • Hurdle Rate (FHR) – Sets the absolute return percentage that a fund must beat its peers to score a win or loss in a calendar year. For funds that track to SP500 volatility, this value is (or close to) 1.00 %/yr. FHR is higher or lower based simply on the ratio of annualized standard deviation of the fund to that of the SP500 over the same evaluation window. FHR is effectively in units of percentage per year, %/yr.

Brad prefers calendar year performance versus say fixed or rolling periods simply because “that’s what my clients monitor … it’s what influences behavior.” He believes FCI especially helps set expectations, enabling he and his clients to be more patient during periods of underperformance.

Nine large cap core funds in Lipper’s Global Data Feed through June have beaten their peers by 2% per year over the past 10 years, as shown in the MFO Premium table below, which includes SPY for reference.

They include three MFO Great Owl funds, including Vanguard’s PRIMECAP (VPMCX), which is also an Honor Roll fund.

While MassMutual’s Select Equity Opportunities (MFVSX) may have offered the highest absolute outperformance, PRIMECAP and Natixis US Equity Opportunities (NEFSX) may in fact have been easiest to own since the Great Recession based on FCI.

Looking at the calendar year outperformance reveals why … consistent outperformance each calendar year.

Aided by Ferguson Metrics, Brad maintains a list of about 200 mutual funds on his radar scope. In the months ahead, Brad has offered to share more about his methodology, which we plan to post on MFO’s Premium site.

Launch Alert: AMG TimesSquare Global Small Cap

By David Snowball

On May 30, 2018, AMG launched AMG TimesSquare Global Small Cap (TSYNX / TSYIX), the fifth AMG fund sub-advised by TimesSquare Capital Management. TimesSquare is a growth-equity firm that works primarily with institutional clients. They manage about $18 billion in assets.

The fund is managed by a team of three, Magnus Larsson, Grant Babyak and Ian Rosenthal. Mr. Larsson also co-manages AMG TimesSquare International Small Cap (TCMPX) with Robert Madsen while Grant Babyak co-manages AMG TimesSquare Small Cap Growth (TSCPX, closed to new investors) with Kenneth Duca. Together Messrs. Babyak and Rosenthal manage AMG TimesSquare Mid Cap Growth (TMDPX).

Global Small Cap will use the same investing discipline as the other TimesSquare funds.  They are, in general, research-intensive, bottom-up fundamental investors. They describe it this way:

TimesSquare uses a bottom-up investment process driven by fundamental research conducted by its investment analysts. TimesSquare also applies a macro overlay to monitor and mitigate country risks through active management. Under normal circumstances, the Subadviser seeks to maintain a growth oriented focus …

In broader terms, it anticipates investing in stocks with market caps comparable to those of the MSCI World Small Cap Index (currently, $1.4 million – yikes! – to $13 billion) and keeping at least 35% outside of the US. The portfolio currently contains about 100 names, which is consistent with the 80-100 stock portfolios maintained by its siblings.

Two reasons to begin tracking the fund:

  1. TimesSquare does good work. The record of all three of its older siblings is solid and consistent. All three are rated as four star funds by Morningstar (as of 7/27/2018), their “machine learning” algorithms designate both Small Cap and Mid Cap as Silver medalists, and International Small Cap is rated as a Great Owl by MFO for its top tier risk-adjusted performance. All three funds have offered exceptional downside protection, with downside capture ratios in the 80s and betas between 80-90.

    Using standard measures, here’s a snapshot of the funds’ five-year performance records against their respective Lipper peer groups. Green cells represent places where TimesSquare substantially outperformed their peers, yellow cells are valued comparable to their peers which generally means “within 100 bps, either way.”

      Annualized Return Max Drawdown Standard Deviation Downside Deviation Bear Month Deviation Ulcer Index Sharpe Ratio
    Small Cap Growth 12.1% 16.6 12.7 7.8 5.7 5.5 0.93
    International Small Cap 13.3% 7.6% 11.5 6.0 3.9 3.0 1.12
    Mid Cap Growth 11.7 12.9 10.6 5.8 4.5 3.4 1.06

    In summary: perfectly respectable returns for consistently below-average volatility in both “normal” markets and choppy ones.

  2. There aren’t a lot of good global small cap options. At least for folks looking for no-load, retail options. Grandeur Peak has an outstanding collection, but they’re all closed except for Global Stalwarts (GGSYX) which has only 20% of its portfolio in small caps. Similarly, Vanguard Global Minimum Volatility (VMVFX) is categorized as “global small/mid” but has only 7% in small caps. Wasatch Global (WAGOX), once run by the folks now at Grandeur Peak, has been only “okay” over the past five years.

On whole, this will be one worth watching for folks looking to find global growth stocks in a tested, risk-sensitive strategy.

$2,000 minimum for “N” shares, reduced to $1,000 for tax-advantaged accounts. “N” shares have a 1.40% e.r. after waivers. There are also two institutional share classes.

The fund’s homepage contains the curious announcement that the fund’s for sale in only nine states (New York, New Jersey, Connecticut, California, Pennsylvania, Colorado, Indiana, Georgia, Wyoming) … and Guam.  A representative explains, “Since the Fund was recently launched, AMG Funds limited the Fund’s availability as the Fund gains a track record. The limited availability is intended to reduce the Fund’s operational expenses in its early life. Some states, including Guam, have low/no operational costs, so they are already available for investment. The availability will be expanded as more shareholders enter the Fund.” The TimesSquare global small cap strategy has about $216 million in assets, including $2 million in the AMG fund.

Launch Alert: Fidelity ZERO Total Market Index Fund (FZROX) and Fidelity ZERO International Index Fund (FZLIX) 

By David Snowball

We’ve got Coke Zero. We’ve got Pepsi Zero. I guess it’s reasonable to wonder, why not Fidelity Zero?

Wait, we don’t have Coke Zero or Pepsi Zero. They both failed in the marketplace and had to be reformulated, renamed and relaunched.

But we do have Fido Zero.

On August 3, 2018, Fidelity launched two zero/zero index funds sporting zero expense ratios and zero minimum initial investments. Purchase is limited to “individual retail investors who purchase their shares through a Fidelity brokerage account, including retail non-retirement accounts, retail retirement accounts (traditional, Roth and SEP Individual Retirement Accounts (IRAs)), health savings accounts (HSAs), and stock plan services accounts.” They added some subtle graphics to their homepage to help introduce the concept.

Offering two loss leader funds is a nice marketing gimmick, akin to a supermarket’s decision to offer blueberries at $0.99 per pint that they’ll inspire you to grab some organic quinoa or King Crab legs while you’re there. It might even be economically sustainable.

  1. Fidelity isn’t giving up much money. Passive investing accounts for just 16% of Fidelity’s fund business, about $400 billion, a far smaller fraction than many of its competitors. With many broad market cap weighted funds charging 10 bps or less, Fidelity loses $1 million in income for every billion that migrates from a “regular” index to a zero cost index. If these funds attract $40 billion, Fido loses $40 million. It is, meanwhile, pressuring competitors more dependent on index funds to give up more of their corporate income.
  2. Fidelity can make money by lending the funds’ securities to other investors. Professors William A. Birdthistle and Daniel J. Hemel of the University of Chicago College of Law argue that

mutual funds are increasingly finding that they can generate income from non-fee sources. In fiscal 2017, the Vanguard Total Stock Market Index Fund earned more than 63% of its expenses by lending securities. The demand for securities loans has limits, but growth in that market will allow an increasing number of funds to offset some or all of their expenses through loan income. (“Next Stop for Mutual-Fund Fees: Zero,” Wall Street Journal, 6/10/2018).

  1. Fidelity, like your grocery, can bank on the fact that you’ll end up buying some high-margin products once they’ve got you in the door. Birdthistle and Hemel predict that “Wise financial institutions will realize that offering a free mutual fund can attract customers to whom they can cross-sell other products, like life insurance and annuities.” Morningstar’s Russel Kinnel pretty much agrees, “Fidelity has lots of ways to make money from customers once they are in the door.”

Fidelity simultaneously launched initiatives to reduce their other funds’ investment minimums to zero and to reduce account- and portfolio-level fees. Kathleen Murphy, president of Fidelity Investments’ personal investing business, in a released comment. “The ground-breaking zero expense ratio index funds combined with industry-leading zero minimums for account opening, zero investment minimums, zero account fees, zero domestic money movement fees and significantly reduced index pricing are unmatched by any other financial services company.”

The shares of other publically-traded asset management firms quickly sold off in response.

Fidelity ZERO Total International Index Fund (FZROX) will attempt to match “the total return of foreign developed and emerging stock markets.” They’re using the proprietary Fidelity Global ex U.S. Index as a surrogate for all the world’s stocks. There’s a badly written sentence in the prospectus (“The fund’s Board of Trustees and sole shareholder approved an agreement and plan of reorganization between the fund and Fidelity ZERO International Index Fund (the “acquiring fund”), a fund of Fidelity Concord Street Trust, pursuant to which the fund would be reorganized on a tax-free basis into the acquiring fund.”) that leads me to conclude that they’re repurposing the existing three-star Fidelity Global ex US Index Fund (FSGDX) as the new Zero fund. If so, the fund will offer negligible exposure to international small caps but will have an substantial stake – currently 18% – in emerging markets. Over the past five years, FSGDX has outpaced its average for its foreign large blend peer group by nine bps. The fund will be managed by Louis Bottari with co-manager Robert Regan.

Fidelity ZERO Total Market Index Fund (FZROX) will seek to match “the total return of a broad range of U.S. stocks.” It will track the Fidelity U.S. Total Investable Market Index. The prospectus contains the same “adoption” language, but it’s not clear to me what fund is being converted here. Messrs. Bottari and Regan will manage this offering as well.

The prospectus is on file with the SEC. There’s a lively discussion of the new funds at the Boglehead’s forum

Bottom line: the new funds are a marketing gimmick. That doesn’t mean they’re bad, but they are part of a larger plan to increase Fidelity’s profits by controlling more of your portfolio. The funds themselves are not magic, not state-of-the-art, not special. They have a microscopic price advantage over their competitors, and any gain occasioned by the lower expenses can be easily offset by differences in index construction or by ill-timed portfolio moves on your part. If you have, or have wanted to have, a Fidelity brokerage account and have, or have wanted to have, a total equity index in your portfolio, by all means sign on. But if Fidelity’s other funds and services weren’t compelling to you or you weren’t looking to add a market-cap weighted index in an overpriced market, then you should mostly nod and move on.

Advice not to follow: Inverse ETFs as a hedge

By David Snowball

It’s sensible to think, in advance, about the best responses to a market that is expensive, increasingly volatile and beset by external shocks, from tariffs to rising interest rates and policy instability.

An unauthored piece in ETF Trends recently weighed in with this advice: look at buying inverse or levered inverse ETFs.

With the heightened uncertainties gripping the markets, investors may look to inverse or short stock ETF strategies to hedge potential risks ahead … investors can hedge against dips in the Nasdaq through bearish plays. For instance, the ProShares Short QQQ ETF (PSQ) takes the inverse or -100% daily performance of the Nasdaq-100 Index. For the aggressive trader, the ProShares UltraShort QQQ ETF (QID) tracks the double inverse or -200% performance of the Nasdaq-100, and the ProShares UltraPro Short QQQ ETF (SQQQ) reflects the triple inverse or -300% of the Nasdaq-100. (10 inverse ETFs to hedge against further stock market risks)

We couldn’t reach internal agreement on how best to respond, so instead here are four equally valid responses from MFO insiders.

In a word: no.

In two words: not ever.

In three: are you kidding?

In New Jersey: fuhgedaboudit!

Inverse funds and ETFs are not buy-and-hold investments; they were created for the benefit of traders whose holding period might be measured in minutes. Most, which target the inverse of an index’s daily movement, are designed to be held in portfolios which are adjusted daily. ProShares, with a suite of inverse and leveraged funds, warns you, “Investors should monitor holdings as frequently as daily.” Rydex, one of the first firms to target this slice of the market, flags the special risk of leveraged funds: “The effect of leverage on a Fund will generally cause the Fund’s performance to not match the performance of the Fund’s benchmark over a period of time greater than one day.” Rydex competitor Direxion, which offers highly leveraged inverse ETFs among its suite of products, notes: “The funds should not be expected to provide three times or negative three times the return of the benchmark’s cumulative return for periods greater than a day.”

In March 2018, Vanguard’s Emerging Markets ETF (VWO) declined by 0.22%. If you’d had the wisdom to hedge your portfolio by buying Direxion Daily MSCI Emerging Markets Bear 3X Shares (EDZ), which rise by three times the daily fall of the emerging markets, what would your monthly return have been?

  1. I lost 0.66%
  2. I gained 0.66%
  3. I gained 6.66% (I’m such a devil)
  4. I lost 3.66%.

The correct answer is “4.” The market lost money, but your hedge lost 18 times as much money. If you’d bought the same hedge on January 1st, your year-to-date return would up about 6% while the EM ETF fell three. Nice, you made money but … you did not make three times the loss of the index and, more importantly, your fund would have risen by double digit amounts in two of the first seven months of the year and would have fallen by double digit amounts in two of the first seven months.

The likelihood of catastrophic failure with such funds is greatest just when you need them the most. Morningstar’s Paul Justice reviewed a whole series of studies of the performance of leveraged inverse ETFs during the 2007-2008 market crisis and concluded they were mostly tools for multiplying your losses. “Leveraged and inverse ETFs,” he warned, “kill portfolios.”

Bottom line: avoid these unless you’re a sophisticated trader whose life has been entirely surrendered to the constant, hypnotic pulsing of red and green movement trackers.

For the rest of us, the best move starts by asking whether you’re comfortable with the prospect of losing 15 t0 50 per cent? If not, consider two strategies for reducing your downside. First, invest some or all of your portfolio with managers who aren’t afraid to hold cash when the markets are high and deploy cash when the markets are crashing.  Such folks (Aegis, Cook & Bynum, FMI, FPA, Intrepid, Provident Trust, Tilson and others) typically look worst just before a market peaks.

Second, consider reducing your equity exposure. Your returns are effected by your portfolio’s exposure to equities, more than by any other factor. Greater equity exposure can increase your returns by a percent or two annually (which is important if you’re thinking in terms of decades) but will also vastly increase your losses in a bear market (which is important if you’re thinking in terms shorter than decades).  The performance over the current market cycle (October 2007-present) of Fidelity’s Asset Manager series offers a preview of the effect of asset allocation on portfolio risk. The funds have the same managers, comparable expenses, and own the same equities, just in different proportions. Here’s the picture:

So, a portfolio with 20% equities has returned 3.8% annually. It suffered a 16.8% decline in the worst of the market crash, and took 24 months to recover from the decline. A portfolio that was almost fully invested in stocks, FAMRX, has returned 2% more annually … but suffered a loss three times as great and took almost a year-and-a-half longer to recover.

Choose well!

Advice not to follow, #2: Avoid ESG funds, they’re losers

By David Snowball

The most consistently strong analyses of US and world markets come from a shrinking handful of sources, The Financial Times and The Wall Street Journal prominent among them. MFO maintains a paid subscription to each.

Nonetheless, even they produce the occasional bewildering piece. In “If you want to do good, expect to do badly” (6/29/2018), the Journal’s James Mackintosh revives an old canard. “Investors are increasingly convinced that they can buy companies that behave better than the rest and make just as much money. They are wrong.”

It’s an argument in two parts: (1) there’s no uniform agreement on what values to screen for and (2) even spectacularly evil corporations, if such things exist, can make tons of money.

That strikes me as interesting but irrelevant. The fact that there are different ways to define “responsible behavior” does not mean that portfolios seeking responsible corporations, variously defined, will underperform.  And the fact that bad guys can make money does not impair the ability of good guys to make at least as much.

Virtually all academic research agrees with us. There have been over 2000 studies in developed and developing markets which have examined this very question. Some studies find in one direction, some in the other but when scholars begin screening out poorly designed studies and combining the data from the remainder, they tend to support ESG investing.

Technically we refer to the procedure of identifying, vetting and combining as a meta-analysis. The procedure used in many disciplines to increase the clarity of results by treating many small, well-designed experiments as if they were part of one large, well-designed experiment. An introduction to meta-analysis published in the medical journal Hippokratia notes “Outcomes from a meta-analysis may include a more precise estimate of the effect of treatment or risk factor for disease, or other outcomes, than any individual study contributing to the pooled analysis …The benefits of meta-analysis include a consolidated and quantitative review of a large, and often complex, sometimes apparently conflicting, body of literature.” (A.B. Haidich, “Meta-analysis in medical research,” 12/2010). If you’re interested but not so geeky, there’s also a Wikipedia entry on the topic.

So here’s the evidence from a review of over 2000 published academic studies:

The search for a relation between environmental, social, and governance (ESG) criteria and corporate financial performance (CFP) can be traced back to the beginning of the 1970s. Scholars and investors have published more than 2000 empirical studies and several review studies on this relation since then. The largest previous review study analyzes just a fraction of existing primary studies, making findings difficult to generalize. Thus, knowledge on the financial effects of ESG criteria remains fragmented. To overcome this shortcoming, this study extracts all provided primary and secondary data of previous academic review studies. Through doing this, the study combines the findings of about 2200 individual studies. Hence, this study is by far the most exhaustive overview of academic research on this topic and allows for generalizable statements. The results show that the business case for ESG investing is empirically very well founded. Roughly 90% of studies find a nonnegative ESG–CFP relation. More importantly, the large majority of studies reports positive findings. We highlight that the positive ESG impact on CFP appears stable over time. Promising results are obtained when differentiating for portfolio and nonportfolio studies, regions, and young asset classes for ESG investing such as emerging markets, corporate bonds, and green real estate. (Friede, Busch and Bassen, “ESG and financial performance: aggregated evidence from more than 2000 empirical studies,” Journal of Sustainable Finance and Investment, 2015)

Okay let’s review the highlights of that long paragraph:

  1. It’s based on 2200 published studies
  2. It’s the most exhaustive review ever
  3. 90% of those studies find a “non-negative relation,” that is, 90% say you lose nothing by ESG investing
  4. A “large majority” say it’s a net gain for your portfolio, and,
  5. It’s true across across time periods, markets and asset classes. It’s even true for “young” asset classes such as emerging markets and green real estate.

More recent studies corroborate those sorts of findings. A 2018 study of emerging markets found “significant outperformance based on ESG integration” into the portfolio (Sherwood & Pollard, “The risk-adjusted return potential of integrating ESG strategies into emerging markets equities,” Journal of Sustainable Finance & Investment, “2018) and another 2018 study of low-carbon portfolios found that they “typically earns a slightly higher rate of return than the overall market” (Halcoussis & Lowenberg, “The effects of the fossil fuel divestment campaign on stock returns,” North American Journal of Economics and Finance, 2018).

ESG-screened indexes slightly outperform their unscreened versions. Here, for example, is a decade-long comparison of the S&P 500 and its ESG-screened sub-set.

Standard & Poor’s formally launched their ESG screened index in 2015, so older results were obtained by applying their screening criteria retroactively. It’s a form of data-mining and it can be misused, especially by marketers. For now, I’ll give Standard & Poor’s the benefit of the doubt and assume they didn’t consciously rig the results. Assuming that, over both five- and ten-year periods, the S&P ESG modestly outperformed the S&P 500.

Morningstar makes the same point about fossil fuel free portfolios. Jeremy Grantham, in a June 2018 keynote address at the Morningstar conference, makes the argument – and makes it well – that we’re in a race for our lives. The confluence of global warming, with its attendant rise in extreme weather and fall in agricultural productivity, and African population rise may, sooner rather than later, rip apart the comfortable existence enjoyed by many of us in the Northern Hemisphere. He doesn’t believe that investors, on their own, can make enough impact to save us … but he does believe that we should take all of the steps available to us, including a switch to fossil fuel free portfolios.

Morningstar looked at the investment consequences of such a switch, and found that the downside – if any – was negligible.

In the worst case, investors lost 5 basis points. Since the rise of tech is a global driver, investors would have gained 3 basis points by avoiding the energy sector.

That difference might rise: as more and more investors value responsible corporations, such stocks are likely to see an emergent price premium.

It is entirely possible to produce terrible results in an ESG-screened fund. Some ESG-screened funds suck. They’re expensive. They’re undisciplined. They’re run by clueless opportunists looking to ride a marketing wave. They’re execrable.

Got it.

But they’re not execrable because they’re ESG-screened. They’re execrable because they’re plagued by a dozen other problems. The same can be said for every other category of fund.

Bottom line: Here is MFO’s recommendation: don’t buy crappy funds. Look for managers who have a long record of getting it right, who communicate clearly and forthrightly, whose interests (read: money) are aligned with yours, whose fees are reasonable given the services provided and who have strong risk-management disciplines.

Mr. Macintosh’s article ends where, I think, is should have begun: “For some of the world’s biggest, most long-term investors, the true aim is to avoid risks that could break capitalism, whether because of social or environmental catastrophe. [Quoting the manager of Japan’s $1.5 trillion pension fund] ‘we need to avoid systemic failure of the capital markets.’”

Global catastrophe is not in your best interests, nor in your children’s nor in your portfolio’s. The seeds of such a catastrophe were planted more than a century ago and it is, bit by bit, coming upon us today. You may choose, as many have done, to pretend in the face of overwhelming evidence that it is otherwise. We baby boomers will pass, soon enough, from this earth. I wonder if we will, soon enough, be reviled as “the generation that just stood and let it happen”?

Elevator Talk: Jim Callinan, Osterweis Emerging Opportunity (OSTGX)

By David Snowball

Since the number of funds we can cover in-depth is smaller than the number of funds worthy of in-depth coverage, we’ve decided to offer one or two managers each month the opportunity to make a 200 word pitch to you. That’s about the number of words a slightly-manic elevator companion could share in a minute and a half. In each case, I’ve promised to offer a quick capsule of the fund and a link back to the fund’s site. Other than that, they’ve got 200 words and precisely as much of your time and attention as you’re willing to share. These aren’t endorsements; they’re opportunities to learn more. 

People love fireworks, those happy confections of explosive powder, toxic chemicals and human ingenuity. Our attraction to them long predates the invention of gunpowder; the earliest firecrackers (pao chuk) were short segments of bamboo that were simply tossed in a fire. The heat generated steam inside the sealed sections, and the steam eventually triggered an explosion, a loud report and flying shards. The addition of gunpowder to the mix didn’t occur for 800 years.

The ancient Chinese obsession with firecrackers tells us something about our own interest in them, and in small cap growth stocks as well. The Chinese weren’t drawn to firecrackers despite the fact that they were scary; they used them precisely because they were scary, most of all to nearby evil spirits who they sought to drive off. Evil spirits don’t explain Americans’ 250 million pound a year fireworks habit, but fear does. Daniel Glaser, a neuroscientist at King’s College London, explains that the initial “bang” triggers two reactions: terror and paralysis; when the initial threat is followed by a cascade of colors rather than, say, dismemberment, our brain responds by releasing a cascade of the pleasure chemical dopamine. The danger inherent in fireworks (11,000 E.R. visits last year!) is central to their appeal.

Small growth stocks likewise. Bill Bernstein described small growth as “a miserable asset class,” and advised investors to avoid it. But they don’t. It’s the firecracker problem: in our analysis of 353 rolling 20 year periods, the best small growth fund has posted annual returns as high as 20%; that is, it averaged 20% per year returns over a 20 year stretch. Nonetheless, average returns over the long-term are no better than you find in larger, more stable stocks. Why? Because if you’re not exceptionally careful, skilled, seasoned and disciplined, you can lose a lot by mishandling firecrackers; the average small growth fund has posted drawdowns of 40-60% in each of the past five market cycles, dating back to the early 1960s. A manager who made hundreds of millions by posting 290% returns in one year could lose billions by losing 93% in the succeeding three years.

And still the allure of “story stocks” and “ten baggers” is impossible to ignore.

Our advice: if you’re going to go there at all, you’d damn well better go with the best professional guide you can find.

Which brings us, at long last, to Jim Callinan, manager of Osterweis Emerging Opportunity (OSTGX). Mr. Callinan has one of the longest and most distinguished records of any active small growth manager. He was a cover-story manager when he was at Putnam OTC Emerging Growth Fund (1994-96), then Morningstar domestic equity Manager of the Year during his years with Robertson Stephens Emerging Growth and its RS-branded successor funds (1996-2010). Like all its growth peers, the fund was crushed in the 2000-02 bear market; unlike most of its peers, it rebounded and remained a competitive offering through the first decade of the 21st century. In 2006, he launched a more concentrated and valuation-conscious version of the original strategy and found that he “strongly preferred it over a more diversified strategy.” In reaction to corporation restructuring and redirection at the fund’s parent, Mr. Callinan took  the concentrated strategy to his own firm, Callinan Asset Management. Recognizing the limits of a one-man shop, he stayed on the lookout for a corporate partner. In 2016, he found that partner in Osterweis and brought his strategy and team aboard.

The short-term performance of the young Osterweis fund reflects the longer-term performance of Mr. Callinan’s concentrated strategy. Here are the metrics from launch on 11/30/2016 through 6/30/2018:

  Total return Annual return Max drawdown Std Dev Downside Dev Ulcer Index Bear Month Dev Sharpe Ratio Sortino Ratio Martin Ratio
Osterweis Emerging Opportunity 53.8 31.2 -1.1 8.1 1.2 0.3 0.4 3.73 25.0 101
Category Average 39.1 23.1 -2.8 8.2 2.6 0.9 2.1 2.73 11.2 38.4

Here’s how to read that. Since inception, the fund has risen 54% while its average peer has risen 39%; that translates to annualized gains of 31% and 23%, respectively. Osterweis investors have experienced surprisingly low volatility in the same stretch. The fund’s maximum drawdown, standard deviation, downside deviation (which measures just “bad” volatility), Ulcer Index (which factors in both the length and severity of drawdowns) and bear month deviation (which looks at volatility during months when the stock market is falling) are all lower to much lower than you’d expect. All three standard measures of risk-adjusted returns (the Sharpe, Sortino and Martin Ratios) are far more positive for OSTGX than for its peers.

Mr. Callinan describes himself as “still invigorated and still wanting to do well for shareholders” after having been through “a lot of wars.” Here are Mr. Callinan’s 400 (or so) words on why he thought the world needed a 228th small-cap growth fund and, in particular, why you should add OSTGX to your due-diligence list.

Let’s be honest: this is the market’s most volatile space. It offers the opportunity for earning elliptical returns during windows of the market that may last two, three, four, perhaps five years; you’re getting tremendous compounding during that window. The question for me is what kind of constraints do you have to put on yourself in order to hold these types of rapidly growing companies and at the same time manage risk?

Part of the answer is a concentrated portfolio of 30 or so stocks from a universe of 100-150 that we’re constantly monitoring. Those will all be at different points in their growth cycles and will be moving at different speeds; 15-30% of them are names we may never to have sell, companies with five or more years of accelerating growth. We’re looking for the Googles of tomorrow.

The other part is our valuation overlay that uses our “anchor points.” I want to buy these stocks when they’ve corrected significantly off their highs, but also stocks that might be worth four or five times as much in five years as they are today. We invest in a lot of younger companies whose managers were often their founders. They’re passionate, may have come to market recently after five or six years when they were venture-backed, and they’re sick to death of answering “next quarter” questions. We ask, instead, about their vision statement, the ideal state of the company in five years. “We should control 10% of the sector revenue in five years,” as an example. We push them to be concrete in expressing those stretch points. Once we have them, we create a long-term valuation for the stock; if they meet their goal, the stock should be valued at X in five years. We use those anchor points to help us decide what to buy (we’re looking for upsides that are multiples of where they are now), which positions to trim and which to eliminate.

That valuation framework explains why we behave better during downdrafts now than during the 90s. We want to let our winners run but if a position has grown so much that there’s not a 100% potential upside or it’s grown to occupy 7% of the portfolio, we will trim. That can lead to a lot of turnover, but I want to be judged on the capital appreciation I offer my investors, not on turnover or tax efficiency. Venture capitalists make their money on one company in 10; we think we’ll have a better success rate with three or four out of 10 that are very impressive winners.

Osterweis Emerging Opportunity (OSTGX) has a $5,000 minimum initial investment, reduced to $1,500 for tax-advantaged accounts. The fund charges 1.29% but does not levy at 12(b)1 fee. The Emerging Opportunity homepage is reasonably rich with direct and linked information. Though it’s a bit dated, the Advisor Perspectives interview, the link to which is on the landing page, offers a pretty good walk-through of Mr. Callinan’s process and how it has evolved over time. The July shareholder letter is also available, but it’s too cursory to offer much insight.

Funds in Registration

By David Snowball

A surprising number of interesting funds have quietly entered the SEC’s new-fund pipeline. While we don’t cover passive ETFs or funds not available to the general public, even there there were interesting developments. DFA Emerging Markets Targeted Value Portfolio will target small and mid-cap EM value stocks, which is consistent with DFA’s research bent and validates the increasing interest in EM value. Impact Shares YWCA Women’s Empowerment ETF will target firms whose values align with the YWCA’s long-time public goals. Of more direct interest, Rajiv Jain of GQG Partners is launching a fund focusing on US equities, a long-time AllianzGI manager is adding an EM value fund to the mix, The Great Gabelli is seizing the helm of his 15th fund and a team from France is offering a direct challenge to the ideology of market-cap-weighted indexes.

American Beacon Continuous Capital Emerging Markets Value Fund

American Beacon Continuous Capital Emerging Markets Value Fund will seek long-term capital appreciation. The plan is to “apply a fundamental research philosophy and approach to identify companies that trade at attractive valuations and are of high quality.” They warn that this will be an actively traded, high turnover portfolio. The fund will be managed by Morley D. Campbell of Continuous Capital, LLC. Mr. Campbell managed $4 billion for Allianz NFJ, for whom he worked from 2008-18. He managed a number of funds in the AllianzGI NFJ family, including the four-star AllianzGI NFJ Emerging Markets Value Fund Class (AZMAX) which serves as the template for this fund. He’s convinced the SEC to allow him to include AZMAX’s record, but not its name, as “comparable fund performance” in his prospectus. That’s new to me. Its opening expense ratio for Investor class shares is 1.54%, and the minimum initial investment will be $2,500.

Argent Small Cap Fund

Argent Small Cap Fund will seek long-term capital appreciation. The plan is to build a 60-80 stock portfolio “emphasizing valuation and anticipating change to identify overlooked and underappreciated stocks in the small-cap universe.” By design, they hold both growth and value stocks. The fund is a conversion of a ten year old hedge fund; the hedge fund outperformed the Russell 2000 by about 150 bps a year though we have no measure of the fund’s volatility. The fund will be managed by John F. Meara and Eduardo Vigil who co-managed the predecessor fund. For now, only the Institutional share class will be offered though the prospectus also includes details on a retail share class. Its opening expense ratio has not been released, and the minimum initial investment for institutional shares will be $250,000.

Brown Advisory Latin American Fund

Brown Advisory Latin American Fund will seek capital growth by investing in a concentrated portfolio of high-quality Latin American growth companies. It will be an all-cap fund and will avoid firms with majority state ownership or which are dependent on selling commodities. The fund will be managed by Rupert Brandt and Peter Cawston. Its opening expense ratio for Investor shares is 1.56%, and the minimum initial investment will be $100.

First Trust Brookmont Dividend Equity

First Trust Brookmont Dividend Equity, an actively-managed ETF, seeks long-term total return. The plan is to use a top-down model and quant screens to identify stocks with attractive current yields, potential dividend growth and the opportunity for capital appreciation. The manager then applies non-quantitative screens (a/k/a research and judgment) to create a portfolio from them.The fund will be managed by a team from Brookmont Capital Management. Its opening expense ratio has not been disclosed.

First Trust Limited Duration Strategic Focus

First Trust Limited Duration Strategic Focus, an actively-managed ETF, seeks to generate current income. The plan is to build an ETF-of-ETFs using a discipline which “combines a bottom-up fundamental credit analysis with disciplined portfolio construction.” That seems admirable, if noncommittal. The fund will be managed by a team of seven from First Trust Advisors. Its opening expense ratio has not been disclosed.

FormulaFolios Flexible Income

FormulaFolios Flexible Income, an actively-managed ETF, seeks to provide “a strong, steady long-term total return relative to traditional US bond asset classes while maintaining a strong level of risk management.” The plan is to invest in other fixed income ETFs. The manager constructs the portfolio using two screens, one which tracks price momentum in fixed income sectors and one which measures the credit spreads between fixed income areas. Each screen determines the allocation of 50% of the portfolio. The fund will be managed by Jason Wenk, FormulaFolio’s founder and CIO, and Derek Prusa. Its opening expense ratio has not been disclosed.

FormulaFolios Sector Rotation

FormulaFolios Sector Rotation, an actively-managed ETF, seeks long-term total return. The plan is to use derivatives, or a combination of derivatives and direct investments, to implement a strategy that is 50% managed futures and 50% actively managed bond. The fund will be managed by Jason Wenk, FormulaFolio’s founder and CIO, and Derek Prusa. Its opening expense ratio has not been disclosed.

Gabelli Global Mini Mites Fund

Gabelli Global Mini Mites Fund will seek long-term capital appreciation. The plan is to focus on creating a global portfolio of micro-cap companies that appear to be underpriced relative to their “private market value.” This will be the 15th fund to be managed by The Gabelli, now 76 years of age. Its opening expense ratio for the no-load AAA shares is 1.25%, and the minimum initial investment will be $10,000.

GQG Partners US Select Quality Equity Fund

GQG Partners US Select Quality Equity Fund will seek long-term capital appreciation limiting downside risk through full market cycles. The plan is to create an all-cap growth portfolio which might include recent IPOs. They will target firms that have “strong fundamental business characteristics, sustainable and durable earnings growth and the ability to outperform peers over a full market cycle and sustain the value of their securities in a market downturn.” The fund will be managed by Rajiv Jain, Chairman and Chief Investment Officer of GQG Partners. Mr. Jain is most famous for the decade-long performance of the Vontobel Emerging Markets Opportunity portfolio that led all emerging markets funds during his tenure but, in reality, he was responsible for over $40 billion in equities across a wide array of countries and styles. Its opening expense ratio is 0.84%, and the minimum initial investment will be $2500.

JPMorgan Core Plus Bond

JPMorgan Core Plus Bond, an actively-managed ETF, seeks a high level of current income by investing primarily in a diversified portfolio of high-, medium- and low-grade debt securities. The prospectus contains the usual collection of dressed-up language: “The adviser allocates … among a range of sectors based on strategic positioning and other tactical considerations. The Fund’s allocations will be reviewed and rebalanced periodically, if appropriate. Individual portfolio managers will be responsible for day-to-day investment management decisions on the assets that are allocated to their respective sleeves; provided, however, the remaining credit of the portfolio, excluding distressed debt, will be managed across the ratings continuum. In buying and selling investments for the Fund, the adviser looks for market sectors and individual securities that it believes will perform well over time. The adviser selects individual securities after performing a risk/reward analysis that includes an evaluation of interest rate risk, credit risk, currency risk, legal provisions and the structure of the transactions.” The fund will be managed by a three person JPMorgan team led by Steven Lear, the CIO for macro strategies within JP Morgan’s global fixed income group. Its opening expense ratio has not been disclosed.

iM Dolan McEniry Corporate Bond Fund

iM Dolan McEniry Corporate Bond Fund will seek total return, with a secondary investment objective of preserving capital. The plan is to invest 75% of the portfolio in investment grade corporate bonds and 25% in high-yield corporates, including foreign corporates. The adviser does reserve the right to retreat into high grade, short term debt if the market goes south. The fund will be managed by a team led by, well, Dolan and McEniry. Its opening expense ratio for Advisor shares is 1.05%, and the minimum initial investment will be $2,000.

KBI Global Investors Water Fund

KBI Global Investors Water Fund will seek long-term total return. The plan is to build a global portfolio of 35-50 ESG-screened water stocks. The portfolio will be non-diversified and conviction weighted, with the most promising stocks receiving disproportionate weightings in the portfolio. The fund will be managed by a four person team from KBI Global Investors (North America). Its opening expense ratio is 1.35%, and the minimum initial investment for Investor shares will be $10,000.

PGIM QMA Strategic Alpha Large-Cap Core

PGIM QMA Strategic Alpha Large-Cap Core, an actively-managed ETF, seeks long-term growth of capital. The plan is to beat the S&P 500 by employing QMA’s “proprietary multi-factor quantitatively driven investment process for the Fund. The stock selection process utilizes systematic tools that evaluate stocks based on various signals, such as value, quality and volatility, to differentiate between attractive and unattractive stocks, subject to risk constraints. The investment management team exercises judgment when evaluating underlying data and positions recommended by its quantitative tools.” The fund will be managed by Stephen Courtney and Edward Lithgow from Quantitative Management Associates LLC. Its opening expense ratio has not been released.

The same prospectus details the simultaneous launch of small cap, small value and international versions of the ETF.

Touchstone Anti-Benchmark US Core Equity Fund

Touchstone Anti-Benchmark US Core Equity Fund will seek capital appreciation. The plan is to invest in 70-100 US stocks in their proprietary anti-benchmark index. This is an entirely quant process designed to maximize the portfolio’s diversification, a goal which market cap weighted indexes fail to achieve. The advisor estimates that they can add 3-5% to returns while reducing volatility by 20-30% with reference to a standard, market cap weighted index. Here’s their explanation of the process. The fund will be managed by a five person team of quants from TOBAM S.A.S., an SEC-registered investment adviser, located on Avenue des Champs Elysées, Paris. TOBAM manages about $10 billion in assets. Its opening expense ratio for no-load “Y” shares is 0.54%, after waivers, and the minimum initial investment will be $2500, reduced to $1000 for tax-advantaged accounts and $100 for those set up with an automatic investing plan.

Touchstone Anti-Benchmark International Core Equity Fund

Touchstone Anti-Benchmark International Core Equity Fund will seek capital appreciation. The plan is to invest in 100-150 international stocks in their proprietary anti-benchmark index. This is an entirely quant process designed to maximize the portfolio’s diversification, a goal which market cap weighted indexes fail to achieve. The advisor estimates that they can add 3-5% to returns while reducing volatility by 20-30% with reference to a standard, market cap weighted index. The fund will be managed by a five person team of quants from TOBAM S.A.S., an SEC-registered investment adviser, located on Avenue des Champs Elysées, Paris. TOBAM manages about $10 billion in assets. Its opening expense ratio for no-load “Y” shares is 0.69%, after waivers, and the minimum initial investment will be $2500, reduced to $1000 for tax-advantaged accounts and $100 for those set up with an automatic investing plan.

Briefly Noted

By David Snowball

All the developments that are worth knowing but aren’t worth separate stories, including the liquidation of Marsico Flexible Capital and worthy alternatives to it, notes on the other 19 funds slated for termination and the surprising roster of “A” tier firms with “A” tier outflows.

Updates

The Morningstar funds have gone live!

Less us at Moerus. Amit Wadhwaney reached out this month to let us know that Ian Lapey had chosen to move on. Ian, a former colleague of Amit’s at Third Avenue and a former manager of Third Avenue Value, joined Moerus in November, 2016, and has worked as an analyst for them. Amit tells us that Ian has recently become intrigued by the prospects of a financial services portfolio, and left, with Amit’s blessing, to pursue his dream.

Morningstar’s assessment was sanguine. “It’s worth noting that Ian Lapey, an analyst on the team since May 2016, will soon leave the firm to pursue another opportunity. While Lapey’s departure is disappointing–and his expertise will certainly be missed–the founding team remains in place and focused on the firm’s single strategy.”

Not so fine. Third Avenue Value continues to struggle. Under the team of Fine and Fineman, installed in September 2017, the fund has trailed 97% of its peers. Investor withdrawals have become much smaller but Morningstar gives the fund a negative rating on all five of the “pillars” through which its analysts assess funds. Third Avenue Real Estate Value remains a bright spot for the firm, but the departure of Michael Winer, the guy who led the fund for 20 years, suggests that cautious watching is in order.

If you look good in a fedora, GQG Partners might have a spot for you. GQG Partners is now advertising for an investigative journalist. While I did not receive a callback from the firm about the advertised position, founder Rajiv Jain had an investigative journalist on staff before. His argument was fascinating: he needs the best understanding he can possible get about a firm in which he might invest (or is invested). Financial analysts are all trained to look at firms through the same lens and he wanted people who could look using a different lens and different approaches. A journalist certainly can’t supplant financial analysts, but can provide critical insights that might otherwise be missed until it was too late. On whole, a cool firm and an intriguing opportunity.

Briefly Noted . . .

Dodge and Cox deflates a bit. In general, active funds have been seeing a bit of a turnaround in fund flows, which good active funds pulling assets from their passive competitors.  A July 20 2018 article by MFWire’s Neil Anderson found some interesting exceptions to that pattern, with Dodge & Cox being the biggest loser:

Neil reports that, on the flip side, that Edward Jones’s proprietary Bridge Builder funds gained nearly $400 million each in June.

Do I take this opportunity to point out the essential silliness of MFWire’s “Reporters covering mutual funds” list, which highlights “which reporters matter most”?  Well, sure. The list includes Bloomberg folks with one story and zero views, but no one at MFO. It also includes loveable curmudgeons like John Rekenthaler and the sui generis Chuck Jaffe, neither of whom is a reporter … but no one at MFO. It almost seems a bit disrespectful to the 25,000-35,000 folks who read the Observer each month.

SMALL WINS FOR INVESTORS

Every month, fund advisers and ETF sponsors cut fees in a silly and unproductive race to the bottom. Why silly and unproductive? Active funds will never be able to compete on price with passive ones, their expenses are simply too different. It’s a delusion for advisers to slice three or four basis points from the expense ratios, thinking that they’re somehow reversing the tide. Active managers need to demonstrate the value they’ve created through intelligent risk-management and enduring relationships with their investors. They need to help investors understand it’s not about “market beating returns,” it’s about meeting meaningful goals. And they need to make that argument now, before a break in the market leads to an outbreak of mass stupidity.

Many “active” managers, of course, provide neither intelligent risk management nor meaningful relationships. Like the dodo, they’re mostly praying that no one notices and, unlike the dodo, they mostly deserve the extinction they face.

Fidelity has taken price competition to an unsustainable extreme, by introducing two loss leaders: funds which charge nothing and have no minimum investment. As with grocery store loss leaders, the hope is that the $.99 blueberries will lure you in and you’ll end up buying some King Crab legs at $36/pound to go with them.

At the other end of the spectrum, some advisers are playing around the edges with the fees on the high cost funds, which is better than not playing with them but which is not a game-changer.

“Effective August 1, 2018, Vivaldi Asset Management, LLC has agreed to lower its management fee from 1.60% to 1.20% of the Vivaldi Multi-Strategy Fund’s (OMOAX) average daily net assets.” Morningstar currently reports net expenses of 4.18% for the fund’s “A” shares, so that should drop by 40 bps. OMOAX is a four-star fund. Your fee supports 13 managers at three different sub-advisers. The new fee structure will move the retail shares from the most expensive fund in Lipper’s peer group to the second most expensive, but the institutional share class will remain the costliest option for institutional investors.

CLOSINGS (and related inconveniences)

Effective at the close of market on August 29, 2018, Franklin Convertible Securities Fund (FISCX) will be closed to new investors. 

Effective September 4, 2018, the T. Rowe Price Emerging Markets Stock Fund (PRSMX) and T. Rowe Price Institutional Emerging Markets Equity Fund(IEMFX) will close to new investors.

OLD WINE, NEW BOTTLES

Hennessey gets energized! BP Capital TwinLine Energy Fund (BPEAX) and BP Capital TwinLine MLP Fund (BPMAX) are in the process of becoming Hennessey funds. The process requires shareholder approval, but that’s generally pro forma.

Shortly after announcing the reorganization, BP Capital shared very sad news with its shareholders, that portfolio manager “Anthony Riley, CFA, unexpectedly and tragically passed away on Saturday, July 21, 2018. The BP Capital TwinLine team is extremely saddened by the news, but is grateful for Anthony’s hard work and contributions, and he will be greatly missed.” We extend our sympathies to Mr. Riley’s family and the folks at BPC, and wish them great peace.

On August 7, 2018, Goldman Sachs TreasuryAccess 0-1 Year ETF (GBIL) will be rechristened Goldman Sachs Access Treasury 0-1 Year ETF. Subtle change: TreasuryAccess (one word) to Access Treasury (two).

On July 16, 2018, Innovator S&P High Quality Preferred ETF (EPRF) became Innovator S&P Investment Grade Preferred ETF.

Manning & Napier Strategic Income Moderate Series (MSMSX) is getting a new name and new portfolio profile. As of August 20, 2018, the fund is rechristened as Manning & Napier Income Series (MSMSX) and its stock exposure drops by 10%. Currently it holds 35-65% equity, going forward that will be 25-55% with the remainder in bonds.

The always-amazing Shadow notes that PhaseCapital Dynamic Multi-Asset Growth Fund (PHDZX) has been rechristened Astoria Multi-Asset Risk Strategy Fund (MARZX).

Vanguard Precious Metals and Mining Fund (VGPMX) is undergoing a complete transformation, which is pretty rare for Vanguard but having a specialty sector fund was pretty unusual, too. As of late September 2018, it’s being renamed Vanguard Global Capital Cycles Fund. What, you might reasonably ask, is a global capital cycles fund? Good question! Here’s the official non-explanation: “The Fund will invest globally across a range of sectors and market capitalizations and will continue to maintain meaningful exposure to the precious metals and mining industry.” So, Metals and Mining Lite? The expense ratio is set to soar by one basis point and Wellington Management will replace M&G Investment Management Limited as the fund’s advisor.

OFF TO THE DUSTBIN OF HISTORY

Really, it doesn’t get much more ironic than this. Brown Advisory – Macquarie Asia New Stars Fund (BIANX) will be liquidated on August 30, 2018. We’re taking nominations for best “new stars” lines. Over the past three years, the fund earned only one star and achieved the signal distinction of trailing (per Morningstar) 100% of its peers.

The $18 million Cane Alternative Strategies Fund (CDMAX) is slated to liquidate on August 15, 2018. It’s ironic, given the fund’s ticker, that it substantially underperformed CDs during the lifetime of its “A” class retail shares.

Morningstar’s increasingly moody website wouldn’t recognize the fund’s ticker:

While it did recognize the fund’s name, clicking on the result link looped you around to a “no such creature” page.

DGHM All-Cap Value Fund (DGHMX) will liquidate on August 30, 2018, following the advisor’s morose assessment of “factors such as the current level of assets under management, limited growth opportunities, and the Adviser’s indication that it does not desire to continue supporting the Fund.”

Direxion Indexed CVT Strategy Fund (DXCBX) will be liquidated on September 28, 2018. Continuous variable transmission is on its way out? Odd.

GMO International Large/Mid Cap Equity Fund Class III (GMIEX) will liquidate on Halloween. $10 million minimum, $40 million in assets, mediocre record.

Heartland International Value Fund (HINVX/HNNVX) has closed to all investments. The Board of Trustees is asking shareholders to approve liquidation of the fund. Not that the Board thinks of such approval as pro forma, but they’ve directed the managers to cease pursuing the fund’s investment objective and move the portfolio to cash.

A series of Ivy funds are slated to merge away in mid-autumn. Shareholders have recently received a proxy asking them to support the mergers and Ivy has announced plans to close each “target fund” on October 24 in anticipation of their disappearance. The dramatis personae (uhhh, dramatis fundae?) are

Target Fund Acquiring Fund
Ivy Global Income Allocation Fund Ivy Asset Strategy Fund
Ivy Tax-Managed Equity Fund Ivy Large Cap Growth Fund
Ivy LaSalle Global Risk-Managed Real Estate Fund Ivy LaSalle Global Real Estate Fund
Ivy Micro Cap Growth Fund Ivy Small Cap Growth Fund
Ivy European Opportunities Fund Ivy International Core Equity Fund

As a reminder, as of the close of business on July 27, 2018, the Keeley All Cap Value Fund (KACVX) was reorganized into the Keeley Small-Mid Cap Value Fund (KSMVX) and the Keeley All Cap Value Fund subsequently liquidated and dissolved.

Lazard US Realty Income Portfolio (LRIOX) is going to disappear into Lazard US Realty Equity Portfolio (LREOX) on or about August 17, 2018. LRIOX surrender a substantial advantage in yield (about 200 bps) for a substantial gain (about 500 bps) in total returns.

LoCorr Multi-Strategy Fund (LMUAX), run by eight guys including four named “Billings,” has closed and will liquidate on August 24, 2018. Several of the non-Billings managers participate in running the four-star LoCorr Macro Strategies Fund (LFMAX) which continues as a relatively excellent performer in a relatively rotten category.

Manning & Napier Strategic Income Conservative Series (MSCBX) is liquidating on or about September 27, 2018. Its sibling fund, Strategic Income Moderate Series, is simultaneously being renamed just “Income Series,” so it appears that the strategic income experiment has been terminated.

Manning & Napier World Opportunities Series (EXWAX) will be absorbed by Manning & Napier Overseas Series (EXOSX) on or about September 24, 2018. “The EXWAX advantage” sounds like a line from a bad 1950s TV commercial for, well, waxative. In any case, Morningstar rated EXWAX as a Bronze medalist and it was not, in terms of performance, markedly worse than the surviving fund. This might be a good time for former EXWAX shareholders to perk up and ask, “if I didn’t own shares on EXOSX, is there anything that would want to make me buy shares of it?”

Marsico Flexible Capital Fund (MFCFX) will be absorbed by Marsico Global Fund (MGLBX) on or about August 3, 2018. It’s a sad and odd tale, since Flexible Capital has over $200 million in assets and a four star rating but … the 10-year rating is five stars, the five year rating is three stars and the three year rating is just two stars. After a strong run under Corydon Gilchrist and Doug Rao (roughly 2006-2012), the fund’s record softened but did not crash. It’s been a middling performer since Mr. Rao’s departure and has seen slow, steady outflows monthly since early 2014. Mr. Marsico stepped in to manage the fund in March 2018 and it has performed well since then. We don’t know whether the fund’s fate was sealed even back then.

Global is barely one-quarter the size of Flexible Capital, though Global has seen some inflows while Flexible posted $43 million in outflows over the past twelve months. Over the past five years, Global has posted far high returns (14% versus 10%) though it has understandably also had higher volatility. The correlation between the funds over the past five- and ten-year periods is in the low- to mid-90s.

Bottom line: investors are being moved into a fine fund, but its higher risk profile might not be what they signed up for. If that’s the case, you might consider an alternative.

We searched the MFO Premium fund screener for comparable funds, looking particularly at the past five years. The funds below all have higher returns and lower volatility over the past five years than does MFCFX and far lower volatility than Marsico Global. They all fall in Lipper’s “flexible portfolio” peer group, all have substantial insider ownership and are open to new retail accounts. With the exception of RPGAX, they all have track records of 10+ years. With the exception of Provident Trust (PROVX), we’ve written about all of them.

Name Returns Returns vs Peer Max Drawdown Std Dev Ulcer Index Sharpe Ratio Martin Ratio ER Correlation to MFCFX
Provident Trust Strategy PROVX 14.4 8.9 -5.8 9.8 1.9 1.42 7.35 1.01 80
AMG Chicago Equity Partners Balanced MBEAX 8.9 3.4 -5.5 6.3 1.6 1.35 5.15 1.09 94
Leuthold Core Investment LCORX 7.7 2.2 -5.7 6.4 2 1.12 3.63 1.27 75
T Rowe Price Global Allocation RPGAX 7.5 2.0 -9.1 6.6 2.7 1.06 2.63 0.98 86
FPA Crescent FPACX 6.8 1.4 -8.7 6.8 2.4 0.94 2.61 1.1 77
Marsico Flexible Capital MFCFX 9.7 4.2 -10.3 9.9 3.4 0.93 2.72 1.45 100
Northern Trust Global Tactical Asset Allocation BBALX 6 0.6 -7.7 6.3 2.5 0.88 2.21 0.64 81
Marsico Global MGLBX 14.0   -12.9 12.7 4.4 1.07 3.09 1.05 87

We’ve highlighted the best five-year performance in each column.

If you’ve enjoyed your last five years with MFCFX, you might want to look at MBEAX particularly since it’s a fine fund with a high correlation to MFCFX with just slightly lower returns but substantially lower risk. If you’re looking for an upgrade, consider especially Provident Trust with substantially higher returns and modestly lower volatility. Or, if you simply like Mr. Marsico’s way of thinking about the world and investing, stay with Marsico Global but prep yourself for higher volatility.

And if you’re suddenly wondering why we haven’t profiled Provident Trust yet, join the club. I’m wondering the same thing.

Rex VolMAXX Long VIX Futures Strategy ETF (VMAX) is expected to cease operations and liquidate on or about July 27, 2018.

What on earth? “The Board of Trustees has determined to liquidate the Six Thirteen Core Equity Fund (TZDKX) and to cease operations of the Fund due to the adviser’s business decision that it no longer is economically feasible to continue managing the Fund because of the Fund’s small size and the difficulty encountered in attracting and maintaining assets.” The fund launched on April 27, 2018. It will close on July 27, 2018. The announcement “I will fight no more forever” came after a total 10 grueling weeks in the marketplace.

Transamerica Bond (IDITX, formerly Transamerica Flexible Income) has closed and will liquidate on August 31, 2018.