


I appreciate the opportunity to write for Mutual Fund Observer. I am a great fan of MFO, and it is my primary investment tool. I am a small investor, an engineer with a MBA nearing retirement. I spent the majority of the past dozen years working overseas and used my spare time reading about history, economics, forecasting, and investing.
The data used in this article is current as of July 2019. As of August 24th, the S&P 500 has lost 5% bringing the 12 month return down to 1.5%. Meanwhile the Vanguard Total Bond Market (BND) is up 10% over the same period. In this article, I look at risks to the financial markets and economy, how funds with varying allocations to stocks have done over the past 20 years, identify 36 top low risk funds with high risk adjusted returns, and create three hypothetical million dollar portfolios based on the current environment.
Understanding Risk
Risk is often described as not achieving financial goals, not keeping up with inflation, or losing money, and each has validity. Chart #1 shows the total return of six funds with varying allocations to equity from 0% to 100% over the past twenty years covering the past two bull and bear markets. At first glance, it seems that one should have invested as much as possible in the S&P 500.
Chart #1: Twenty Year Returns by Bull and Bear Market
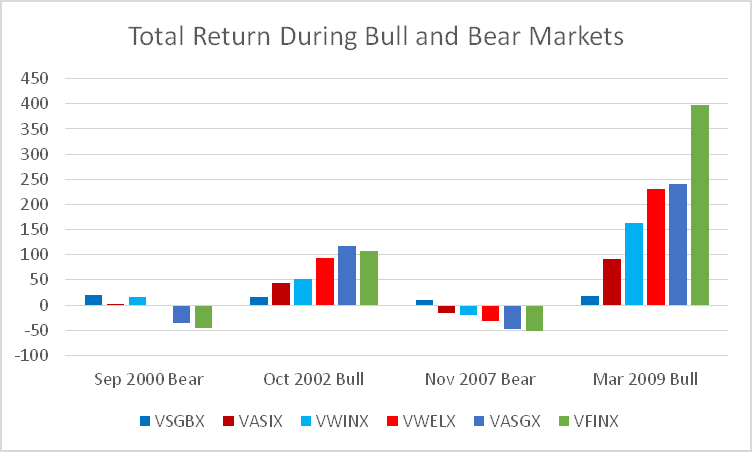
Table #1 tells a different story. Over the past 20 years, the Vanguard Wellesley Income Fund (VWINX) and Vanguard Wellington (VWELX) have both out-performed the S&P 500 including dividends, with less volatility and lower drawdowns. The reason for this is that if a fund loses 50% during a bear market, it must double to recuperate the losses. It took the S&P 500 five years to recover from the 2007 bear market.
Table #1: Performance during the Past 20 Years
| Symbol | Name | APR%/yr | STDEV%/yr | MAXDD% | %Equity |
| VSGBX | Vanguard Short-Term Federal | 3.4 | 1.8 | -1.5 | 0.0 |
| VASIX | Vanguard LifeStrategy Income | 4.9 | 4.2 | -15.5 | 19.7 |
| VWINX | Vanguard Wellesley Income | 7.1 | 5.7 | -18.8 | 37.3 |
| VWELX | Vanguard/Wellington | 7.6 | 9.2 | -32.5 | 65.7 |
| VASGX | Vanguard LifeStrategy Growth | 5.5 | 12.5 | -47.6 | 78.2 |
| VFINX | Vanguard 500 Index | 6.0 | 14.6 | -51.0 | 99.4 |
Markets behave differently over long periods of time. The Vanguard 500 Index Fund returned 16.2% annually from 1985 through 2000. This was a time period starting with low valuations and ending with high valuations and few major downturns. In contrast, the same fund has returned 6.4% annually since 2001 starting with high valuations and with two major corrections along the way. In my opinion, we are in an aging, cyclical bull market within a secular bear market. Because of demographics, valuations, deficits, and debt levels, among other reasons, I expect the next decade will continue the trend of high volatility and low returns.
Taking the six funds for the past twenty years and using risk adjusted return presents a similar perspective. Bonds have the highest returns in a recession while the risk adjusted return of a balanced fund with 15% to 60% equities has higher compensation for the amount of risk taken than the S&P 500 during a bull market.
Chart #2: Risk Adjusted Return (Martin Ratio) by Bull and Bear Markets
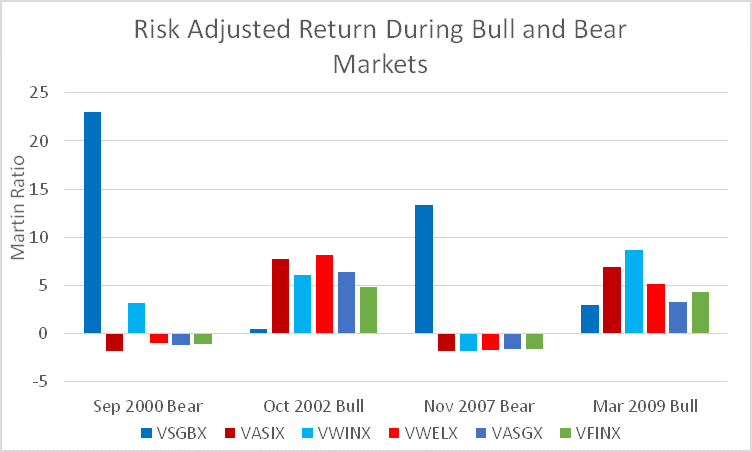
Table #2 shows how the funds have done during the past 18 months since February 2018 when investors noticeably started rotating to late business cycle stage investments. The Martin Ratio measures the risk free return for the amount of risk (Ulcer Index) taken. The Martin Ratio is a good metric to determine if a fund is achieving superior returns through higher risk. While the S&P 500 (VFINX) has had the highest return, there is little extra compensation as a reward for the extra risk.
Table #2: Performance for Past 18 Months
| Symbol | APR | MAXDD | STDEV | Ulcer | Martin | Yield |
| VSGBX | 3.1 | (0.2) | 1.2 | 0.1 | 11.7 | 2.3 |
| VASIX | 4.7 | (2.2) | 3.8 | 1.0 | 2.7 | 2.7 |
| VWINX | 5.0 | (3.5) | 5.9 | 1.9 | 1.6 | 3.0 |
| VWELX | 4.7 | (6.8) | 9.6 | 3.0 | 0.9 | 2.6 |
| VASGX | 1.6 | (10.6) | 12.0 | 4.2 | (0.1) | 2.3 |
| VFINX | 5.6 | (13.6) | 16.0 | 5.1 | 0.7 | 1.8 |
Trading Tactics for Long-Term Planning
Borrowing from Charles Schwab, “Trading Tactics for Long-Term Planning”, authors Lee Bohl and Randy Frederick offer five ways to incorporate trading into a broader financial plan.
- Set Specific Targets: My risk-off goal is to out-perform the Vanguard Wellesley Income Fund on a risk adjusted basis.
- Limit your Positions: With Mutual Fund Observer, an investor has incredible access to data, and investors can track a large number of funds. I tend to purchase more funds and have smaller positions to limit the risk of being wrong. MFO provides the tools for me to be wrong less often.
- (Don’t) let your Winners Run: While I believe that it is important to let winners run, I think it is more important to buy low and sell high. For me, this means evaluating what I own each month and if there is a reason to own a different fund. Three and ten month trends, price to earnings ratio, and the economy are some of the tools that I use for evaluating when to sell winners.
- Act in Increments: With legions of smart people following the market closely, I have no belief that I can consistently time the market in the short term. In the medium term, I have done my personal best when evaluating where the market is and where I think it is going.
- Stay in your Lane: In my opinion, it is best to have a plan that you can stick to during the turbulent times. The previous section shows that well managed conservative funds have beaten the S&P 500 over the past 20 years. It is not complicated. Manage risk first. My risk tolerance varies with the business cycle.
The Bucket Approach
Two of the main approaches to investing are total return and income. Total return investors tend to care more about drawdowns while income investors tend to care more about a steady stream of income. Pensions, among other sources of income will influence the importance of income to an investor. Total return investors tend to match investments to the timeframe for withdrawals. Income investors try to have income meet their withdrawal needs. As I near retirement, I remain a total return investor, but have been shifting focus to safely investing for income.
Suppose that you follow a bucket approach to investing and allocate to match financial needs to time horizons as shown in Table 4.
Table #3: Bucket Portfolio Approach
| Ticker | Name | Allocation |
| VSGBX | Vanguard Short-Term Federal | 5% |
| VASIX | Vanguard LifeStrategy Income | 5% |
| VWINX | Vanguard Wellesley Income | 15% |
| VWELX | Vanguard Wellington | 20% |
| VASGX | Vanguard LifeStrategy Growth | 25% |
| VFINX | Vanguard 500 Index Investor | 30% |
Chart #3 shows the Bucket Approach described in Table 3, the Maximum Sharpe Ratio low volatility portfolio (85% Vanguard Short-Term Federal, 15% Wellington), 100% Wellington and 100% S&P 500 portfolio. The assumptions are that $4,000 is withdrawn monthly starting in 1998 and adjusting for inflation. I own VASIX, VWIAX, and VWELX and will through the next recession, although allocations will change over time.
Chart #3: Investment Portfolio Strategies
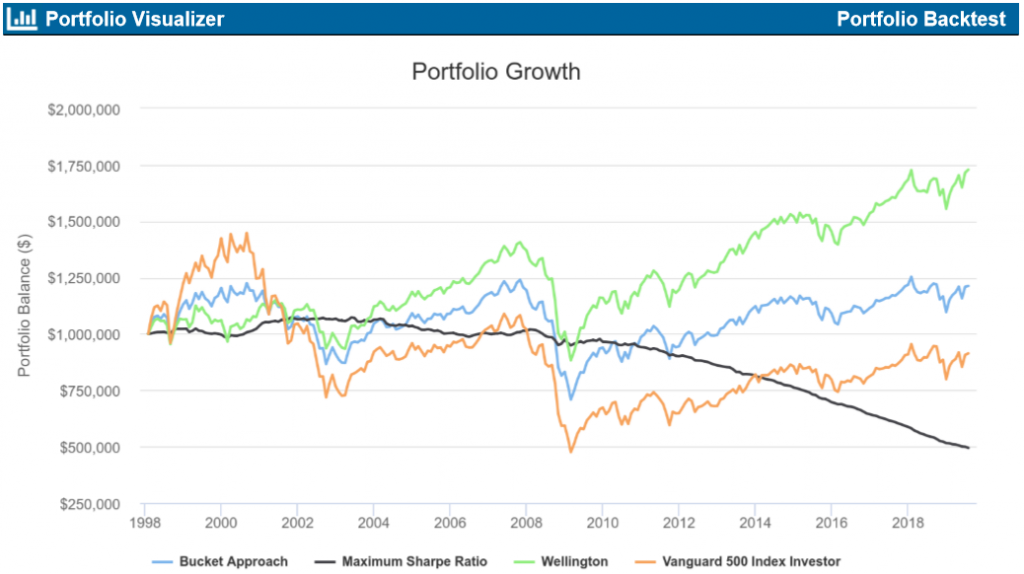
Source: Portfolio Visualizer
The Bucket Approach and Wellington Fund would have experienced maximum drawdowns of about 35%. Investing 100% in the Wellington Fund would have been the best choice for 20 year total return given these assumptions. If only we had perfect hindsight! However, median retirement savings for people between the ages of 55 and 64 is currently around $107,000 according to the Government Accountability Office. Priorities will vary based on savings level, other income, knowledge of investing, and risk aversion, among others.
Adjusting Allocations According to the Business Cycle
Another common approach is to tilt portfolios according to what does well during the business cycle. Representations of the business cycle and its impact on investing can be found at Fidelity and Schwab. Recessions are frequent events that are well studied and taken into account in many investment strategies that manage risk. I built an Investment Model based on over 30 indicators including Financial Risk, Recession Risk, Margin Debt Trends, leading indicators, coincident indicators, yield curve, housing, orders, spending, valuations, monetary policy, stock market technical, among others. The concept is to set cyclical indicators (usually year over year) to +1 for the highest point in the past 20+ years and -1 for the worst. One portfolio is used for each of the business cycle stages and allocations to stocks are allowed to fluctuate in order to maximize return.
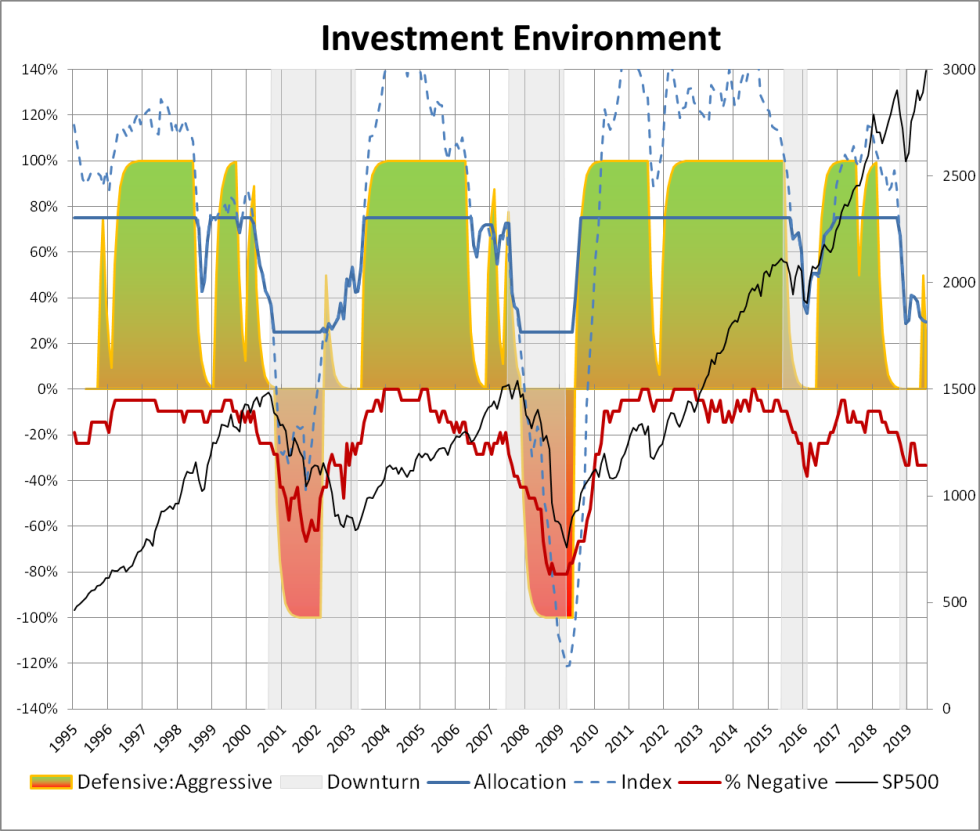
Chart #4 is my detailed view of the Investment Environment. Some indicators raise warning flags and others signal strength. The weakest indicators are to the left and the strongest are to the right. Recession and Financial Risk are currently low, while Monetary Policy, an economy near capacity, “flight to safety”, and yield curve are signaling caution is warranted.
Chart #4: Main Indicators
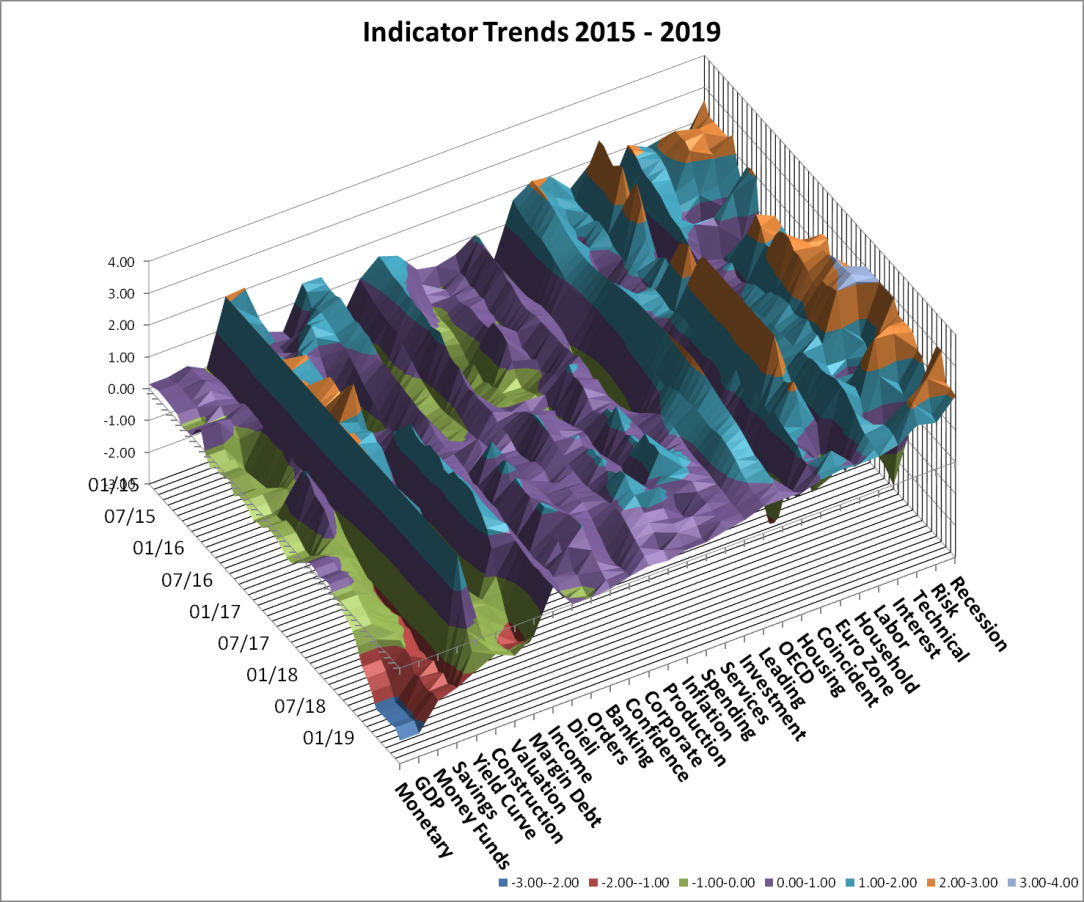
Chart #5 shows the summary view of the investment environment. The dark blue line is my target allocation to stocks following Benjamin Graham’s guidelines of never having less than 25% allocated to stocks, nor more than 75%. It currently suggests an allocation of 30% to equities. Why? Monetary policy has been three years of raising the federal funds rate and quantitative tightening, the economy is near capacity, institutional and retail investors are building up cash reserves, bonds are out-performing stocks, the yield curve has inverted, construction spending is in the doldrums, valuations are moderately high, orders are declining, and so on. The red line is the percent of indicators that are negative. The weakness is broad and expanding.
Chart #5: Investment Model
Creating a Fund Universe with Mutual Fund Observer
The Investment Model is good for providing a high level view of the financial markets and economy. It is limited in that it does not provide specifics on which funds to invest in. This is where Mutual Fund Observer excels. Each month, I extract over a thousand funds. I built a ranking system for the funds to match the risk-off, but not bearish level in the investment model. I am fortunate to have had a good mentor for Excel and use AVERAGEIFS(), PERCENTRANK(), VLOOKUP(), and INDEX(MATCH()) to rank funds from 0 to 1 for the metrics that are most important to me such as bond quality, 3 and 10 month trends, volatility, risk (Ulcer Index and drawdown), risk adjusted return (Sortino and Martin Ratios), total return, yield, leverage, performance during recessions, Premium/Discounts for closed end funds, P/E ratio for stocks, and Capture. I also use the MFO Risk and Rank metrics in my ranking system as well as the Great Owl classification. Some of the metrics are intended to predict how a fund is doing now or in the event of a recession.
What I like about a rating system is that it removes the emotions and subjectivity for evaluating funds. It also removes biases about managed vs passive, mutual funds vs ETFs vs CEFs, Vanguard vs Fidelity, Stocks vs Bonds, expenses, and so on. The funds in Table #4 are the top ranked funds with the highest ranked at the top. The table is a starting point for researching funds in more detail, and not a final list of buy recommendations. Each month, I create a new list using the same ranking system and see if there are funds moving into and out of the list. I may not own these funds, but I own similar ones. I own VTABX, FPNIX, VEMBX, VFITX, VWIAX, TSI, and real estate.
Table #4: Top Ranked Funds Over 18 Months
| Symbol | Name | Premium | CAGR | Ulcer | Martin | Yield | 2007 Bear |
| DMO | Western Asset Mort Defined Opp | 6.2 | 11.6 | 0.0 | – | 13.8 | – |
| BIAEX | Brown Advisory Tax Ex Bond | 5.7 | 0.2 | 21.2 | 3.2 | – | |
| VTABX | Vanguard Total Intern Bond | 7.4 | 0.1 | 69.4 | 2.9 | – | |
| FPNIX | FPA New Inc | 3.3 | 0.0 | – | 3.1 | 4.6 | |
| NXR | Nuveen Select Tax-Free Inc Port | -5.7 | 7.4 | 0.4 | 13.3 | 3.2 | 0.0 |
| VCSH | Vanguard Shrt-Trm Corp Bond | 4.1 | 0.2 | 11.6 | 2.8 | – | |
| CFBNX | Commerce Bond | 4.8 | 0.6 | 4.5 | 3.1 | 3.0 | |
| VEMBX | Vanguard Em Mrkts Bond | 8.8 | 1.3 | 5.3 | 4.8 | – | |
| VWAHX | Vanguard HY Tax-Ex | 6.4 | 0.4 | 9.9 | 3.5 | -3.9 | |
| MCR | MFS Charter Inc Trust | -9.3 | 7.0 | 1.0 | 5.2 | 7.7 | -6.8 |
| IGIB | BlackRock Interm-Term Corp Bond | 7.2 | 0.6 | 8.0 | 3.6 | -0.8 | |
| NID | Nuveen Interm Muni Term | -5.3 | 7.6 | 0.2 | 23.9 | 3.6 | – |
| FYBTX | Fidelity Shrt-Trm Credit | 3.5 | 0.1 | 19.5 | 2.7 | – | |
| GSY | Invesco Ultra Short | 2.8 | 0.0 | – | 2.9 | – | |
| AGBVX | American Century Global Bond | 5.2 | 0.5 | 6.9 | 5.6 | – | |
| CSHTX | AB Taxable Multi-Sector Inc | 3.6 | 0.1 | 21.8 | 2.8 | – | |
| PGZ | Principal Real Estate Inc | -12.2 | 13.8 | 1.3 | 9.0 | 6.1 | – |
| AMHIX | American Funds Hi-Inc Muni Bond | 6.1 | 0.4 | 9.8 | 3.5 | -12.0 | |
| USIBX | USAA Interm-Term Bond | 5.1 | 0.7 | 4.6 | 3.6 | -11.8 | |
| VFITX | Vanguard Interm-Term Treas | 5.1 | 0.4 | 7.7 | 2.5 | 10.4 | |
| VGIT | Vanguard Interm-Term Treas | 5.1 | 0.4 | 8.5 | 2.2 | – | |
| VFIIX | Vanguard GNMA | 4.2 | 0.4 | 5.6 | 2.9 | 7.4 | |
| USAIX | USAA Income | 5.1 | 0.7 | 4.0 | 3.4 | -3.2 | |
| VGLT | Vanguard Long-Term Treas | 8.3 | 2.0 | 3.1 | 2.5 | – | |
| TGHYX | TCW HY Bond I | 6.2 | 0.6 | 7.2 | 4.7 | -19.0 | |
| TIPX | State Street SPDR 1-10 Year TIPS | 3.8 | 0.5 | 3.1 | 2.9 | – | |
| VWOB | Vanguard Em Mrkts Gov Bond | 5.6 | 2.3 | 1.5 | 4.4 | – | |
| TSI | TCW Strategic Inc | -2.2 | 5.1 | 0.1 | 20.2 | 6.3 | -7.8 |
| ORSYX | Invesco Oppen. Short Term Muni | 2.7 | 0.1 | 8.0 | 2.2 | – | |
| VWINX | Vanguard Wellesley Inc | 5.0 | 1.9 | 1.6 | 3.0 | -14.5 | |
| PGHY | Invesco Global Shrt-Trm HY Bond | 3.2 | 0.3 | 3.8 | 5.3 | – | |
| VMMXX | Vanguard Prime Money Market | 2.2 | 0.0 | – | 2.3 | 2.9 | |
| FUMBX | Fidelity Shrt-Trm Treas Bond | 3.4 | 0.1 | 9.1 | 1.9 | – | |
| VGSH | Vanguard Shrt-Trm Treas | 2.8 | 0.1 | 12.4 | 2.2 | – | |
| HTD | John Hancock Tax-Adv Div Inc | -2.8 | 12.8 | 1.9 | 5.6 | 6.3 | -46.8 |
| FFXSX | Fidelity Limited Term Gov | 3.0 | 0.1 | 6.3 | 1.7 | 7.4 |
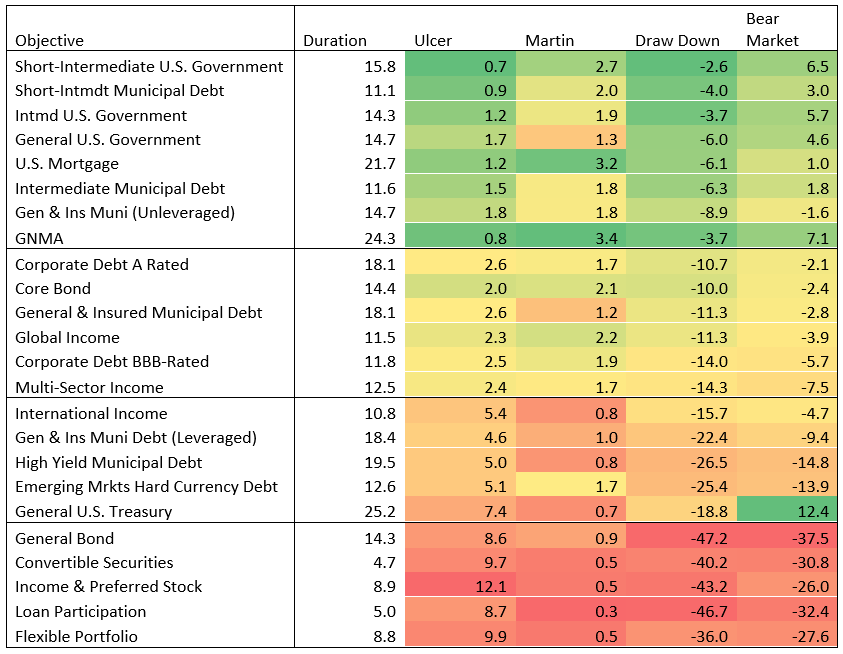
What about the Vanguard Long Term Treasury Fund (VUSTX)? It has returned 22% over the past 12 months! Table #5 was created from 280 funds with 20 year histories and contains the performance of long term bond Objectives. The Bear Market column is an average for the 2000 and 2007 Bear Markets. The top section is lowest risk (Ulcer Index) with highest risk adjusted returns (Martin Ratio). The second section is low risk, moderate risk adjusted performance. The third section is still low risk when compared to the S&P 500 over the past 20 years with an Ulcer Index of 17.6. Even the final section has Ulcer Index values about half of the S&P 500, but high drawdowns. The Vanguard Long-Term Treasury Fund (VUSTX) had a maximum drawdown of 19% over the past 20 years. The return over the past 3 months has been 15%. While I have shifted to conservative investments, I am not convinced that a recession is imminent. My base case is that interest rates continue to fall. My preference is for less volatile intermediate bonds. It does make sense to own long term bonds if one believes that interest rates are going down for an extended time or want a hedge against stock market volatility. My preference is to own funds in the top two sections.
Table #5: Long Term Bond Performance Over Past 20 Years
Creating Model Portfolios with Portfolio Visualizer
Use of Portfolio Visualizer is currently free. It optimizes allocations to funds. I used three options: 1) Maximize Sortino Ratio (risk adjusted return) for 7% return, 2) Maximize Sharpe Ratio at 5% Volatility, and 3) Maximize Sharpe Ratio (least volatility), and compare them to the Vanguard Wellesley Income Fund (VWIAX) for the past 18 months. These are not recommended portfolios but are representative of how funds might do in a portfolio. None of the Model Portfolios have 25% equity which is my minimum target allocation.
Table #6 shows the results, reducing the 36 funds down to 18. The Max Sortino and Return portfolios both returned over 8 percent compared to VWIAX with 5% return, with less volatility and drawdown and higher risk adjusted return.
Table #6: Allocations in Hypothetical Million Dollar Model Portfolios
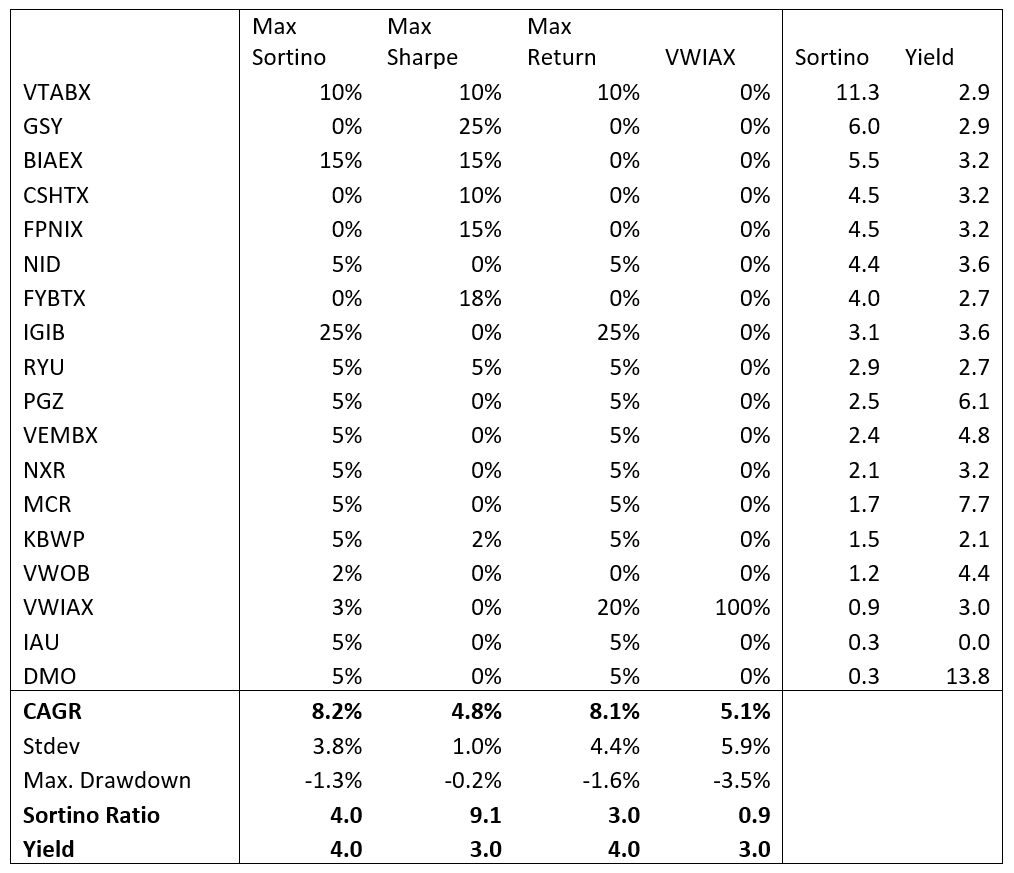
Chart #6: Performance of Hypothetical Portfolios
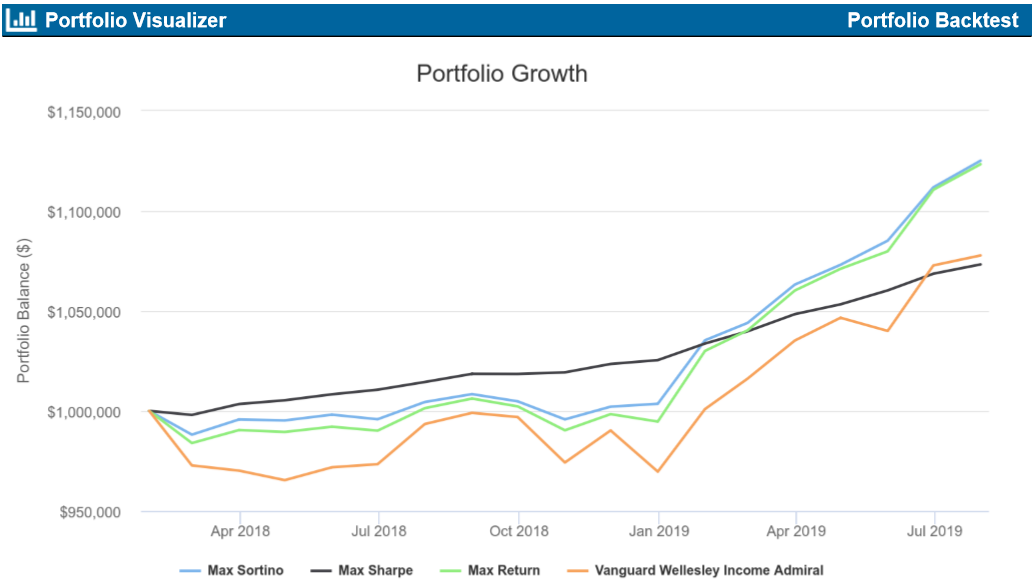
How well has the S&P 500 investor done during the past 18 months? It has made 5.6% with a max drawdown of 14% through July. However, as pointed out earlier, it has lost 5% during the past month for a 12 month return of 1.7%.
Closing
Following the process described in this article, I have been reducing risk in my portfolio for over a year. I am pleased with its performance. I believe that the two large drops in stocks during August are a sign of more to come. September is typically a low month for stock market performance and next year is an election year which is typically a good year for stocks. If current trends continue, I expect recession odds for late 2020 or 2021 to rise.
I focused on top ranked funds which are mostly bonds where 70% of my funds are allocated. The 30% allocated to equities are in the Vanguard Wellesley Income Fund, Wellington Fund, and “Overachieving Defenders” such as AMG Core Equity Focused (YAFFX) and Janus Henderson Balanced (JABAX), and several other Great Owls.
I appreciate the invaluable service that Mutual Fund Observer has contributed to developing a low risk, high risk adjusted portfolio. Each month, I like to review the Investment Model and Mutual Fund Observer data to see if there is some small change that I would like to make.