


It is unfair and irrational to judge a fund solely on its total returns, much less on whether it has managed to “beat the market” lately. The former concern ignores a long series of important questions, the most important of which is “how much risk does the strategy expose you to in exchange for those returns?” Many would argue that receiving 20% of the market’s gains is great if you bear only 10% of its risk, and that’s what you signed up for in the first place.
The latter concern is simply lunatic. Rational people do not invest with the goal of beating the market. Rational people invest with the goal of ending up with resources that match or exceed their needs. If you beat the market ten years straight and your resources are less than your needs, you have lost. If you trail the market ten years straight and your resources exceed your needs, you have won.
Nonetheless, some funds have performance that warrants serious concern. One red flag is risk-adjusted returns (which allow us to answer the first question) that are seriously subpar. That is, returns that are substantially lower than the risks investors are accepting.
A more serious red flag might be consistently terrible risk-adjusted-performance.
And a redder than red flag might be consistently terrible risk-adjusted performance in funds that hold tens of billions to hundreds of billions of dollars of investors’ futures.
MFO Premium offers many, many ways to approach the question, “am I getting reasonable returns for the risks I’m being exposed to?” A fund’s capture ratio measures whether the fund captures more of an index’s gains than its losses. The Ulcer Index looks at a fund’s worst stretches, those marked by its major drawdowns, and incorporates both how far a fund has declined and how long it took (if ever) to recover. You could think of a fund that stumbles and recovers as warranting the occasional Tums, while those that do a face-plant and stay on the ground moaning might call for gastric surgery. Downside and down market deviation refine “standard deviation” to focus on the part of volatility that investors actually care about: the frequency and severity of a fund’s downside moves. The Sortino and Martin ratios are more risk-sensitive riffs on the famous Sharpe ratio.
For the sake of simplicity, we screened for very large funds ($10+ billion in assets) that ended up with bottom-tier Sharpe ratios over the past three years. Those seemed reasonable parameters since the past three years have seen a combination of dramatic bull and bear moves, and the Sharpe ratio is the most widely recognized snapshot of risk-adjusted returns.
What is the Sharpe ratio? It’s a formula that won a Nobel Prize for its namesake creator, William F. Sharpe, who developed it in 1966. It’s simply the difference in returns between an investment (your fund) and a risk-free return (typically a Treasury bill), divided by the investment’s standard deviation. In general, a Sharpe ratio of 1.0 is okay: you’re getting the same balance of risks and returns as a T-bill investor. Higher is better.
Over the past ten years, only one fund has had a Sharpe ratio above 2.0: RiverPark Short-Term High Yield (RPHIX), with annual returns of 2.8% and a standard deviation of 0.8%.
Over the same period, 1460 funds are above 1.0, but only 11 – all income funds – reached 1.5.
At the other end of the spectrum is nearly a trillion dollars devoted to funds that were cellar-dwellers over the past three years. In the table below, a Sharpe Rating of “1” signals a fund that was in the poorest 20% of performers in its peer group, “2” is below average but not terrible, “3” is average, and so on.
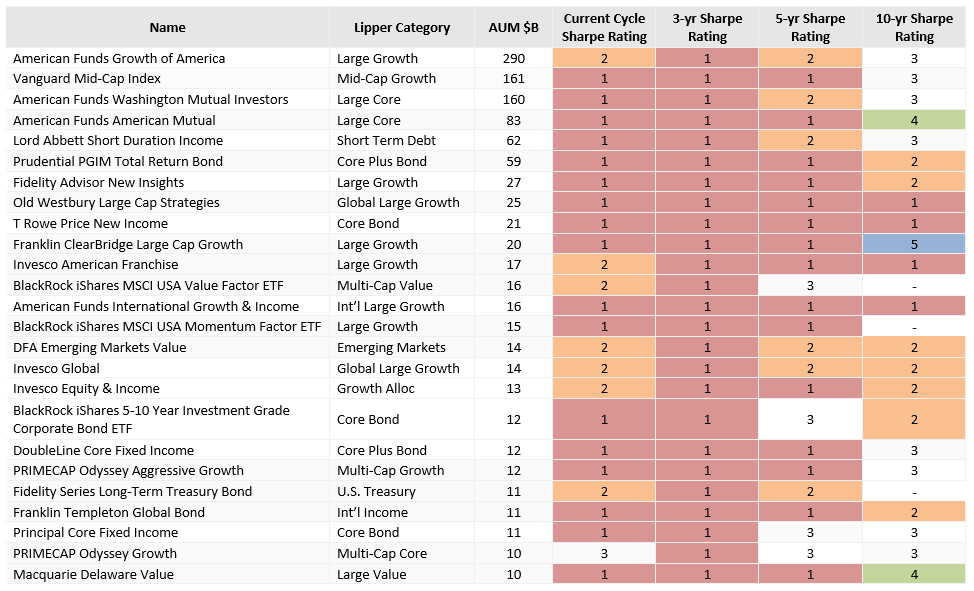
If you own one of the funds on this list, it’s time to start asking questions. There might be a very fine reason for a fund’s bottom tier performance over a three-year span … and a five-year span, also ten years, and the current market cycle that began at the end of the Covid bear in March 2020.
As the string of stumbles gets longer and funds with formerly top-tier performance show no sign of a rebound, the need to ask hard questions grows.
Bottom line: there are many ways to measure risk-adjusted performance precisely because no one way perfectly captures all of the aspects of performance that an investor needs to understand in order to be comfortable with a long-term holding. By some measures, some of these are perfectly fine performers. But as we enter into a period of increasing economic challenge (from rising prices, rising rates, energy price volatility, stretched valuations, and China’s lurch, as examples), it’s increasingly important to understand what you own and why it acts the way it does. Sorting through those same questions in the midst of a storm would be … challenging.