


Bond investors think they’ve seen it all.
They are wrong about that. For people who first began investing in bonds within the past 4o years – say, since 1982 – the bond market must seem like a source of perpetual, reassuring, and unrelenting gain. Just chuck some cash into the Treasury market or investment-grade corporates, and voila! Instant wealth.
In that same period, global equity investors have been slapped upside the head over 30 times, sometimes with local market crashes (the Argentine collapse in 1989) but more often in global corrections, panics, crashes, repricings, and bears.
Over the past 40 years, a vanilla “core bond” portfolio generated 6.1% annually with a standard deviation of 4.8%. In the same period, inflation was a meek 2.8%. As a result, you could pretty much bet the farm on inflation-topping gains. Interest rates were dropping steadily and almost relentlessly from their highs around 1980. Inflation was tame and occasionally negative. Freed of the need to worry about price stability – one of their two formal obligations – the Fed could devote its vast resources and considerable creativity to fostering full employment. And if the system had a stumble, no problem: the Fed would fix it.
Those days are gone. While nostalgia is understandable, it’s a poor basis for portfolio construction.
High inflation combined with rising rates presents both the opportunity to earn a decent return on fixed income along with the risk of a recession. It is unprecedented to have this combination without a recession. In this article, I look at how to balance this opportunity with risk. I identify twenty Lipper Bond Categories that have done well during the past five recessions, along with up to four funds each.
This article is divided into the following sections:
- Section 1, Investor Expectations and Steepening Yield Curves
- Section 2, Ten-Year Treasury Yields vs Fed Funds During Recessions
- Section 3, Bond Category Performance in Recessions with Falling Rates
- Section 4, Top Notch Bond Funds (ETFs, Fidelity, Vanguard & Others)
- Section 5, All Bond Model Portfolio
Investor Expectations and Steepening Yield Curves
We are in what appears to be a somewhat traditional late stage of the business cycle where the Federal Reserve raises the Federal funds rate to reduce inflation. Federal Reserve Chairman Jerome Powell has laid out plans to raise interest rates to about five percent and hold them there as I described in the MFO November Newsletter, “Federal Reserve Rate Hikes – The Next Nine Months.” Six months later, we are approaching the end of the rate hiking cycle as inflation has peaked but is likely to remain higher than the target of 2% for longer. The ten-year Treasury has been on a roller coaster ride peaking at 4.3% on October 24th, then falling to 3.4% on December 7th, and returning above 4.0% on March 2nd.
On March 7th, Federal Reserve Jerome Powell testified before the Committee on Banking, Housing, and Urban Affairs. The S&P 500 immediately dropped over one percent, and the short end of the yield curve rose. Mr. Powell says the data “suggests that the ultimate level of interest rates is likely to be higher than previously anticipated” and that they continue to reduce the balance sheet (Quantitative Tightening). I expect a quarter-point hike on March 22nd, but a half-point is not off the table. I then expect another quarter-point hike in the second quarter.
Kathy Jones from Charles Schwab describes in “How to Prepare for Landing” that investor expectations of the Federal funds rate have risen from 5.25% to 5.5% by this August and start to fall before the end of the year. Ms. Jones cites the inverted yield curve, tightening lending standards, falling demand for loans, and tight monetary policy for the rising risk of a recession. She suggests holding bonds of high credit quality and gradually adding duration.
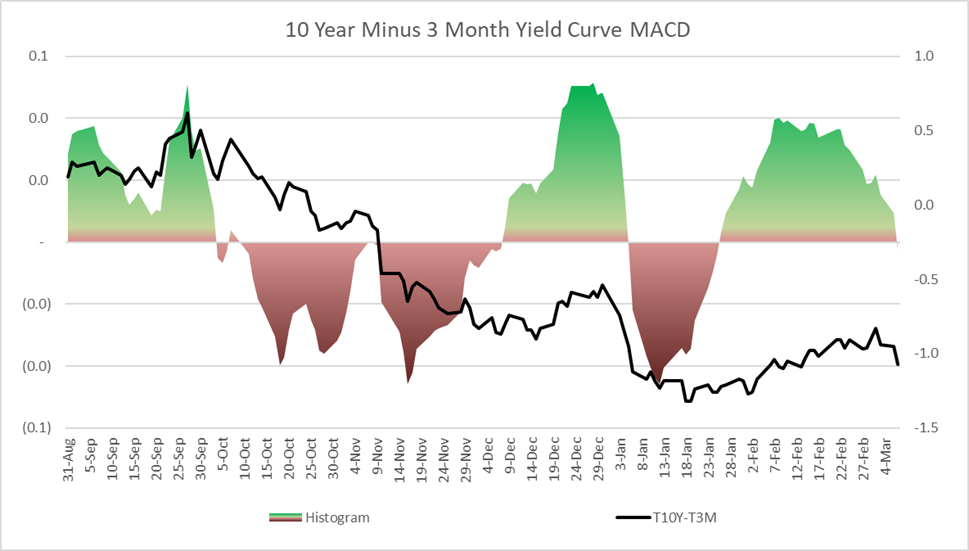
Lance Roberts wrote an insightful article, “Recession Countdown Begins as Yield Curves Trough,” where he describes the inverted yield curve as a “warning” of the possibility of a recession, but the bottoming and steepening of the yield curve are what signals a recession is approaching. Mr. Roberts believes that the “central bank is poised to keep policy tighter for longer” and the “downturn is thus liable to be worse, leaving the Fed needing to cut rates more.” He is overweight in cash and short-term Treasuries, and will be increasing bond durations.
I built Chart #1 to track the steepening of the ten-year to three-month Treasury yield curve using the Moving Average Convergence Divergence (MACD) momentum indicator. The chart shows that the yield curve is still inverted but has been steepening since the beginning of February. There is a lot of volatility as inflation expectations evolve, and this segment of the curve began to invert further after Mr. Powell’s testimony.
Chart #1: 10 Year minus 3 Month Treasury Yields Momentum (MACD)
Source: Author Using Mutual Fund Observer
Ten-Year Treasury Yields vs Fed Funds During Recessions
My short-term objective has been to build a bond ladder for the next eight years to lock in yields above four percent on Treasuries. Table #1 contains how the ten-year Treasury yield has behaved in relation to the Federal funds rate during the past seven recessions. On average, the Federal Funds rate has fallen from 10% to 5% during recessions while the ten-year Treasury has fallen from 7.9% to 7.5%. The spread of the ten-year Treasury to Federal funds rate increased from negative 2% to positive 2% because the ten-year yield held fairly constant while the Federal funds rate fell. The maximum yields during the recessions show that we may have a higher Federal fund rate and ten-year Treasury yield during the recession compared to the start of the recession because the start is not declared by the National Bureau of Economic Research (NBER) until about nine months afterward.
Table #1: Fed Funds Rate and 10-Year Treasury at Start and End of Recessions

Source: Author Using St. Louis Federal Reserve FRED Database
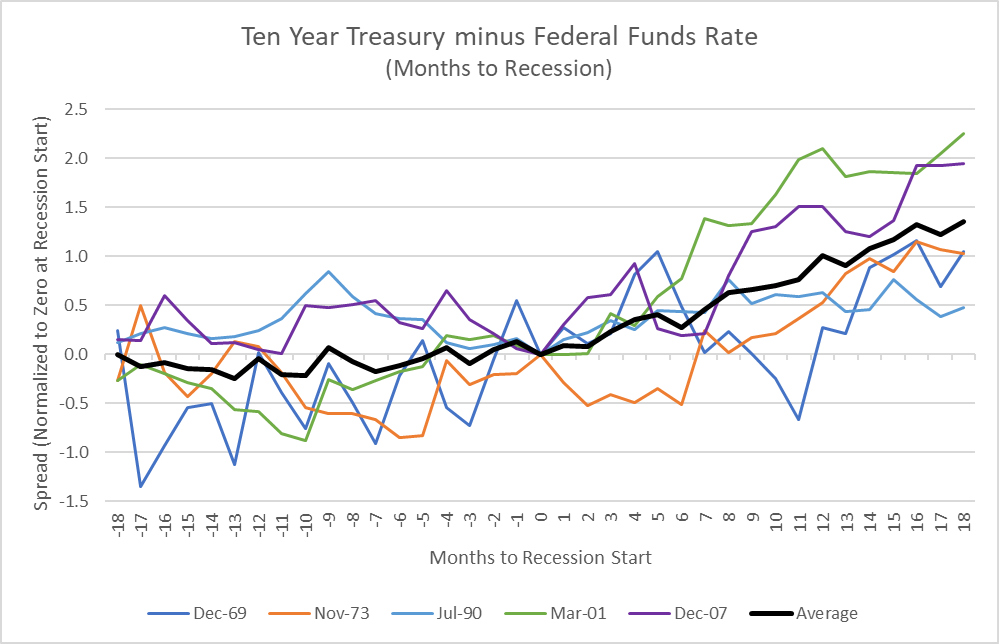
In Chart #2, I normalized the ten-year Treasury to Federal funds rate spread to the start of the recession excluding the outlier recessions in the early 1980s. The dark black line is the average spread. Prior to the start of the recession in Month “0”, the ten-year Treasury yield tends to move in parallel with the Federal Funds rate with some volatility. After the recession starts, the ten-year Treasury yield tends to remain relatively constant while the Federal funds rate falls.
Chart #2: Ten-Year vs Federal Funds Rate Spread During Recessions
Source: Author Using St. Louis Federal Reserve FRED Database
This implies that if the Federal Reserve raises the funds rate another 50 basis points (half percent) then the Ten-Year Treasury yield may also rise in parallel. The volatility shown in the above chart shows this is not a reliable planning tool, but there are buying opportunities during dips.
Bond Category Performance in Recessions with Falling Rates
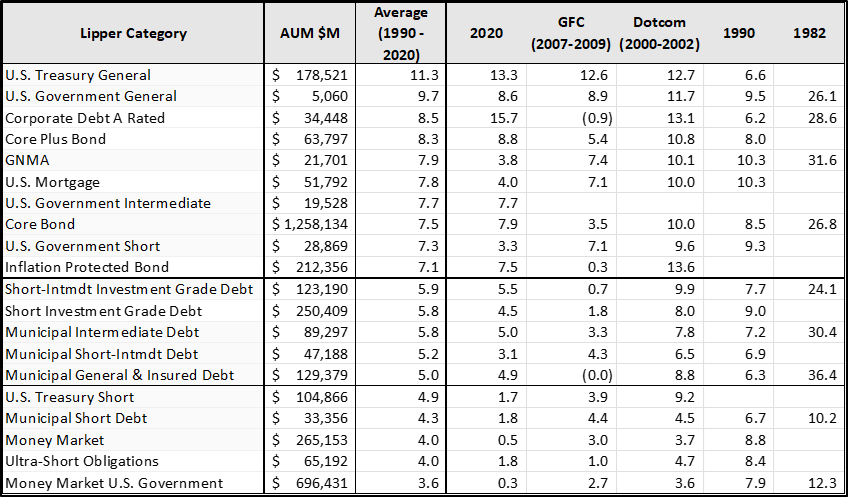
I used the Mutual Fund Observer MultiSearch screen for bond funds that outperformed during recessions along with falling interest rates. Table #2 shows the results by Lipper Category. The data set includes BlackRock, Allianz, Fidelity, State Street, T Rowe Price, WisdomTree, and Vanguard funds. These categories are used to select the funds in the next section. Table #2 contains mostly government or agency bonds, municipal bonds, high quality corporate bonds, and shorter-term investment grade bond categories.
Table #2: Highest and Consistent Lipper Bond Category Performers During Recessions
Source: Author Using Mutual Fund Observer
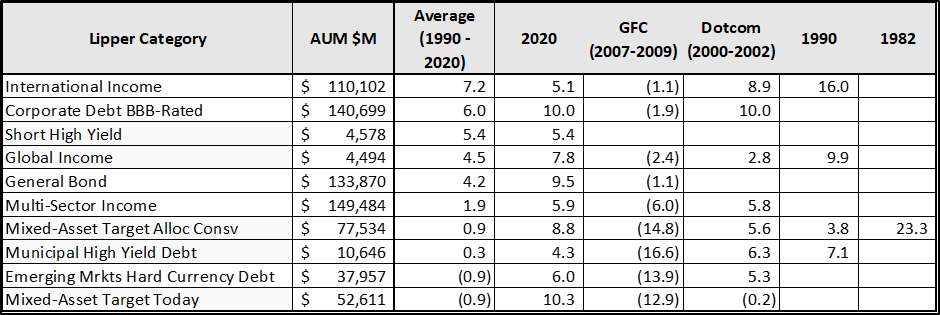
Table #3 contains a list of riskier bond and mixed-asset fund categories that can be rewarding depending on whether there is a hard or soft landing. Not shown are the riskiest of the bond categories such as high yield.
Table #3: Riskier and Less Consistent Lipper Bond Category Performers During Recessions
Source: Author Using Mutual Fund Observer
Top Notch Bond Funds (ETFs, Fidelity, Vanguard & Others)
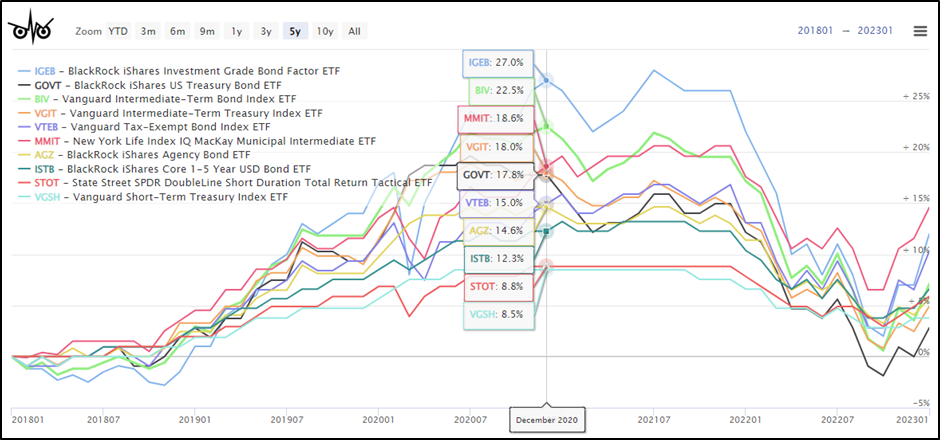
I like Professor Snowball’s terminology of “The Young Defenders” with impressive shorter histories but excellent risk and return metrics, and “The Wizards” that have consistently performed well through multiple recessions. I selected “Top Notch Bond Funds” of both Young Defenders and Wizards using MFO, Lipper, Ferguson and Reamer Ratings. I trimmed the list based on expense ratios, age, and assets under management, among other factors for the Lipper Categories identified in the previous section. I include one mutual fund for each category from both Fidelity and Vanguard along with a mutual fund from a different company that is available through Fidelity without a no-load and with no-transaction fee. I also include one ETF. The link associated with the symbol is to Morningstar. The funds are sorted from the highest Ulcer Rating to the lowest. The Ulcer Index is a measure of the length and depth of the drawdown. Bond performance will improve this year compared to last year because yields are stabilizing.
EXCHANGE TRADED FUNDS
Table #4: Top Performing ETF Bond Funds
| Symbol | Name | Lipper Category | Quality | Effect Maturity yr | 30d Yield % |
| IGEB | BlackRock iShares Inv Grd Bond Fact | Core Plus Bond | BBB | 9.5 | 5.02 |
| GOVT | BlackRock iShares US Treas Bond | U.S. Treasury General | AA | 7.9 | 3.95 |
| BIV | Vanguard Inter-Term Bond | Core Bond | A | 7.1 | 4.14 |
| VGIT | Vanguard Inter-Term Treas | U.S. Gov Inter | AA | 5.6 | 3.62 |
| VTEB | Vanguard Tax-Ex Bond | Muni Gen & Ins Debt | A | 14.8 | 3.05 |
| MMIT | New York Life IQ MacKay Muni Inter | Muni Inter Debt | A | 13.1 | 3.00 |
| AGZ | BlackRock iShares Agency Bond | U.S. Gov Gen | A | 3.2 | 4.13 |
| ISTB | BlackRock iSh Cor 1-5 Yr USD Bnd | Shrt-Intm Inv Grd Dbt | A | 3.7 | 4.51 |
| STOT | State Street DL Shrt Dur Tot Rtn Tact | U.S. Gov Short-Inter | BBB | 8.2 | 4.36 |
| VGSH | Vanguard Short-Term Treas | U.S. Gov Short | AA | 2 | 4.32 |
Source: Author Using MFO Premium database and screener
Chart #3: Top Performing ETF Bond Funds
Source: Author Using MFO Premium database and screener
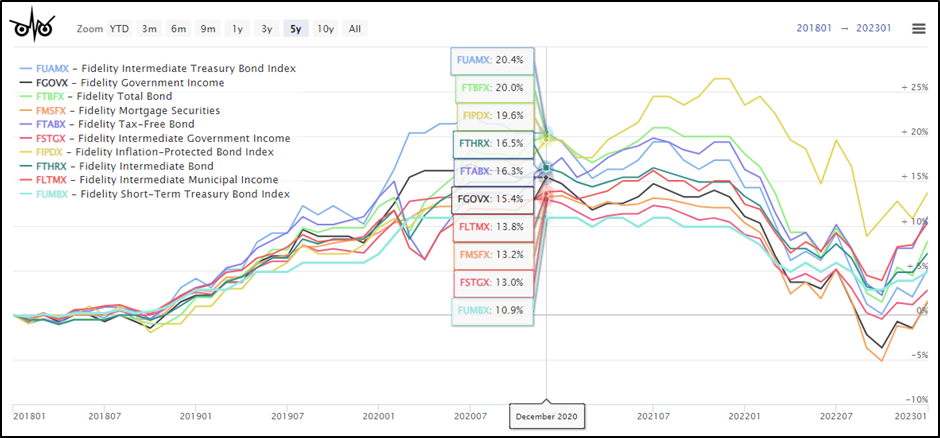
FIDELITY
Table #5: Top Performing Fidelity Bond Funds
| Symbol | Name | Lipper Category | Quality | Effect Maturity yr | 30d Yield % |
| FUAMX | Fidelity Inter Treas Bond | U.S. Treasury General | AA | 6.9 | 3.57 |
| FGOVX | Fidelity Gov Inc | U.S. Gov Gen | AA | 12.7 | 3.39 |
| FTBFX | Fidelity Total Bond | Core Bond | A | 13.9 | 5.13 |
| FMSFX | Fidelity Mortgage Sec | U.S. Mortgage | AA | 25.6 | 3.40 |
| FTABX | Fidelity Tax-Free Bond | Muni Gen & Ins Debt | BBB | 16.7 | 3.46 |
| FSTGX | Fidelity Inter Gov Inc | U.S. Gov Short-Inter | AA | 5.2 | 3.54 |
| FIPDX | Fidelity Infl-Prot Bond | Infl Prot Bond | AA | 7.2 | 0.60 |
| FTHRX | Fidelity Inter Bond | Shrt-Intm Inv Grd Dbt | A | 7 | 4.22 |
| FLTMX | Fidelity Inter Muni Inc | Muni Inter Debt | A | 12.8 | 2.80 |
| FUMBX | Fidelity Short-Term Treas Bond | U.S. Treasury Short | AA | 2.7 | 4.10 |
Source: Author Using MFO Premium database and screener
Chart #4: Top Performing Fidelity Bond Funds
Source: Author Using MFO Premium database and screener
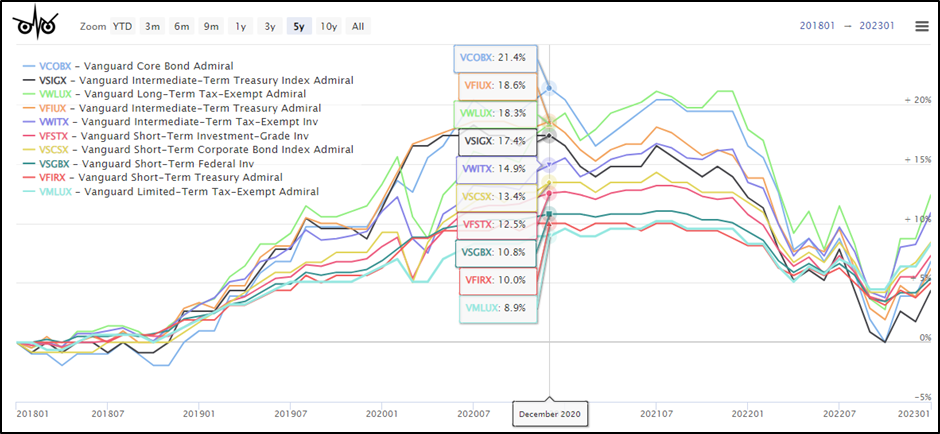
VANGUARD
Table #6: Top Performing Vanguard Bond Funds
| Symbol | Name | Lipper Category | Quality | Effect Maturity yr | 30d Yield % |
| VCOBX | Vanguard Core Bond | Core Bond | A | 15.2 | 4.21 |
| VSIGX | Vanguard Inter-Term Treas | U.S. Gov Inter | AA | 5.6 | 3.58 |
| VWLUX | Vanguard Long-Term Tax-Ex | Muni Gen & Ins Debt | A | 18.8 | 3.39 |
| VFIUX | Vanguard Inter-Term Treas | U.S. Treasury General | AA | 6.6 | 3.59 |
| VWITX | Vanguard Inter-Term Tax-Ex Inv | Muni Inter Debt | A | 11.9 | 2.88 |
| VFSTX | Vanguard Short-Term Invest-Grade | Shrt Invest Grade Dbt | BBB | 3.5 | 4.55 |
| VSCSX | Vanguard Short-Term Corp Bond | Shrt-Intm Inv Grd Dbt | BBB | 3 | 4.77 |
| VSGBX | Vanguard Short-Term Federal Inv | U.S. Gov Short | A | 4.7 | 3.85 |
| VFIRX | Vanguard Short-Term Treas | U.S. Treasury Short | AA | 4.2 | 4.16 |
| VMLUX | Vanguard Lim-Term Tax-Ex | Muni Shrt-Intmd Debt | A | 10.7 | 2.65 |
Source: Author Using MFO Premium database and screener
Chart #5: Top Performing Vanguard Bond Funds
Source: Author Using MFO Premium database and screener
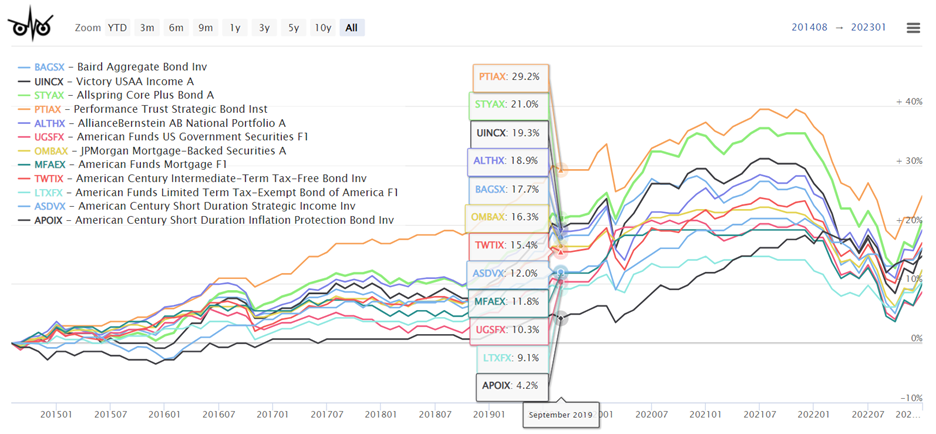
OTHER FUND FAMILIES
Table #7: Top Performing Bond Funds From Other Companies
| Symbol | Name | Lipper Category | Quality | Effect Maturity yr | 30d Yield % |
| BAGSX | Baird Aggregate Bond Inv | Core Bond | A | 15.1 | 3.74 |
| UINCX | Victory USAA Inc A | Corp Debt A Rated | BBB | 9.6 | 4.22 |
| STYAX | Allspring Core Plus Bond A | Core Plus Bond | A | 13.5 | 3.84 |
| PTIAX | Performance Trust Strat Bond Inst | Gen Bond | BBB | 14.7 | 5.80 |
| ALTHX | AllianceBernstein AB Nat Port A | Muni Gen & Ins Debt | BBB | 17.5 | 3.24 |
| UGSFX | American Funds US Gov Sec F1 | U.S. Gov Gen | AA | 11.4 | 2.12 |
| OMBAX | JPMorgan Mortgage-Backed Sec A | U.S. Mortgage | A | 21.8 | 2.78 |
| MFAEX | American Funds Mortgage F1 | U.S. Gov Inter | A | 16.9 | 3.11 |
| TWTIX | American Cent. Inter-Trm Tax-Fr Bnd | Muni Inter Debt | A | 12.4 | 2.88 |
| LTXFX | Am. Funds Lim Trm Tx-Ex Bnd of Am | Muni Shrt-Intmdt Dbt | A | 13.8 | 2.08 |
| ASDVX | American Century Shrt Dur Strat Inc | Shrt Invest Grade Dbt | BBB | 6.9 | 4.98 |
| APOIX | American Cent. Short Inf Prot Bnd | Infl Prot Bond | AA | 3.6 | 14.57 |
Source: Author Using MFO Premium database and screener
Chart #6: Top Performing Bond Funds from Other Companies
Source: Author Using MFO Premium database and screener
All Bond Model Portfolio
I wanted to round off this article with some actionable recommendations. I chose to create an All-Bond Portfolio for the time period from July 2000 though September 2011 because it covers two recessions where inflation was higher than the 2% target and two recessions when the Fed funds rate was falling. It does not include the past ten years which was characterized by ultra-low interest rates and massive stimulus. Note that the “Top Notch Funds” were limited to 8 to 10 funds, but more short-term bond funds are included in the list below. Chart #7 shows the Federal funds rate and inflation during this period.
Chart #7: Model Portfolio Time Period
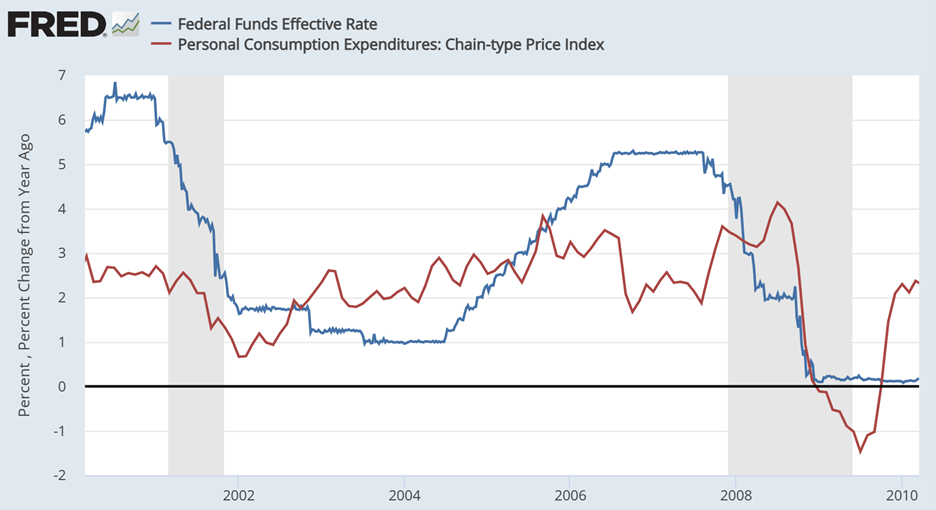
Source: Author Using St. Louis Federal Reserve FRED Database
I selected the “Top Notch Funds” from this time period. I used Portfolio Visualizer to select one fund from each category and then to select ten funds to maximize an equal weighted portfolio. The link is provided here. Chart #7 shows the final ten funds for the twelve-year period. These are the categories of bond funds that I will be using to build the bond portion of my portfolio throughout the year in addition to Treasury ladders to match withdrawal needs. Note that Portfolio Visualizer is effectively building a bucket list of shorter-duration bond funds for stability and longer duration for higher returns.
Chart #8: Funds Selected to Build the All-Bond Portfolio
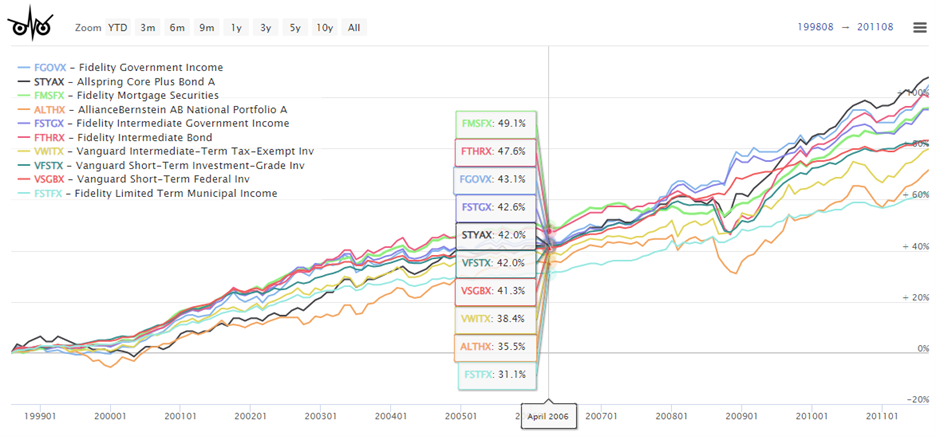
Source: Author Using Mutual Fund Observer
Chart #9 compares the All-Bond Portfolio to the Vanguard Balanced Portfolio (VBINX) over the twelve-year period. Note that the two bear markets in this time period were unusually severe. I believe that investors should have diversified portfolios across multiple asset classes, but the chart suggests that holding more quality bonds over the next few years or longer may result in higher returns and lower volatility.
Chart #9: Equal Weight Bond Portfolio vs Vanguard Balanced Fund
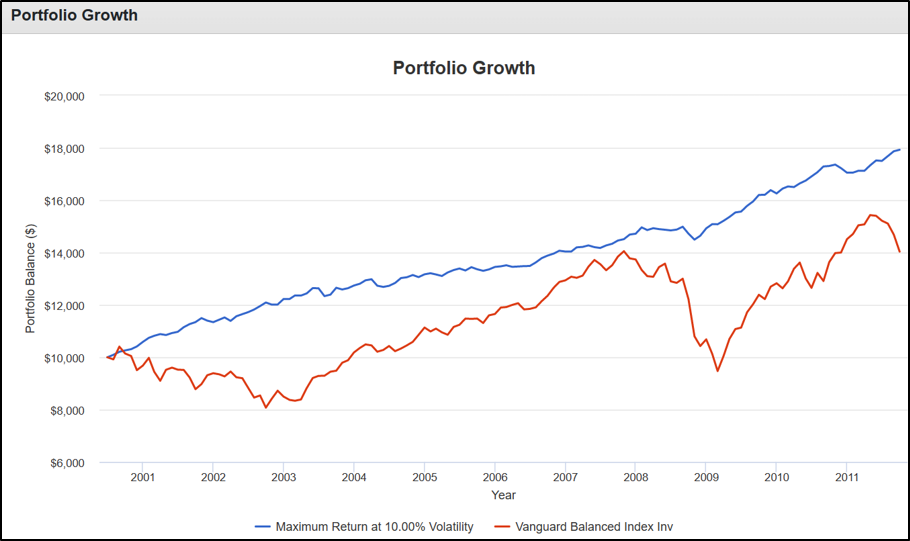
Source: Author Using Portfolio Visualizer
The All-Bond Portfolio outperforms VBINX because it has higher yields and continues to make money during recessions rather than experiencing losses.
Chart #10: All-Bond Portfolio Performance by Year
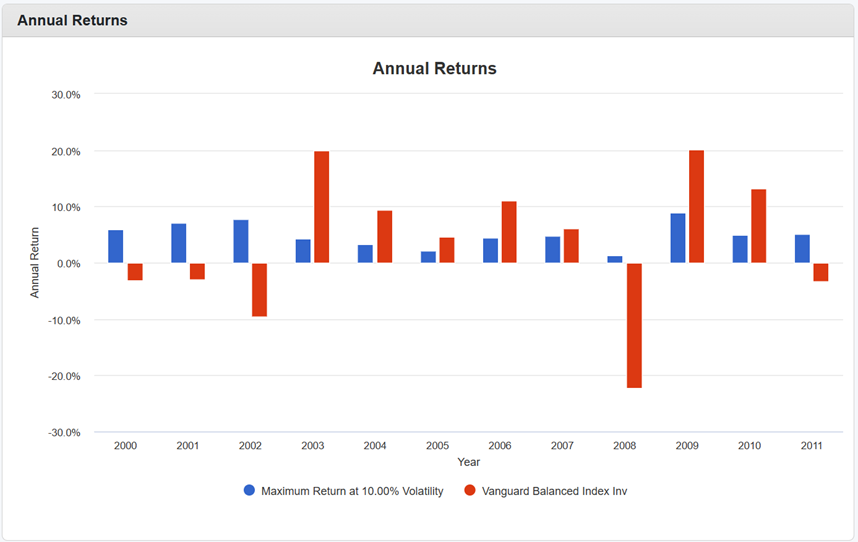
Source: Author Using Portfolio Visualizer
Closing Thoughts
Last year, I bought ladders of short-term certificates of deposits and Treasury so that they mature every month or so. This allows me to evaluate the current environment each month and to make a small decision of whether to hold cash, extend bond durations, buy bond funds, or buy equity funds. I will complete the construction of bond ladders in the next month or two extending over the next eight years. At that point, my expectation is that I will switch and invest in some of the bond funds covered in this article.
I expect to remain over-weight in bonds for the remainder of this year, but buy equities during significant dips. As I mentioned last month, I will continue to look for opportunities to add to Columbia Thermostat (CTFAX/COTZX), American Century Avantis All Equity Markets ETF (AVGE), and possibly Allianz PIMCO TRENDS Managed Futures Strategy (PQTAX). After increasing allocations to bonds, I will look for opportunities to shift allocations from mixed asset funds to equity funds.
As a follow-up to previous articles, Standpoint Multi-Asset Investor has an institutional class (BLNDX) which is available at Vanguard with lower fees but a higher minimum requirement. The investor share class (REMIX) is available at both Vanguard and Fidelity.