Monthly Archives: December 2023

December 1, 2023

By David Snowball

Dear friends,

Welcome to December. Welcome to Winter. It’s my favorite time of the year, despite the post-Covid haze that has enveloped me all week. Augustana is increasingly festive, ringing with the sounds of holiday concerts and celebrations, as well as the definite “click” of another semester coming to its close. My students, with their hummingbird-like metabolisms, are loathe to surrender their shorts and sandals even now.

We annually share the same simple reminder. Winter has always been a dark and drear span. The weather turns against us, and we retreat inward for protection. Gardens lay frozen. Workdays are framed by darkness: dark when we arise, dark when we return home.

The midwinter holidays ahead – not just Christmas but a dozen other celebrations rooted in other cultures and other traditions – are, at base, expressions of gratitude. They occur in the darkest, coldest, most threatening time of year. They occur at the moment when we most need others, and they most need us. No one thrives when they’re alone, and each day brings 14 to 18 hours of darkness. And so we’ve chosen, from time immemorial, to open our hearts, our homes, our arms, and our pantries to friends and strangers alike.

Don’t talk yourself out of that impulse. Don’t worry about whether your gift is glittery (if people actually care about that, you’re sharing gifts with the wrong people) or your meal is perfect (Martha Stewart’s were, and she ended up in the Big House). People most appreciate gifts that make them think of you; give a part of yourself. Follow the Grinch. Take advice from Scrooged. Tell someone they make you smile, hug them if you dare, smile and go.

In this issue of The Observer

Nearly a week after the fact, I continue muddling through Covid’s after-effects. This variant, unlike its predecessors, has left me surprisingly tired and unfocused. I’ll ask your indulgence as I write only a short letter.

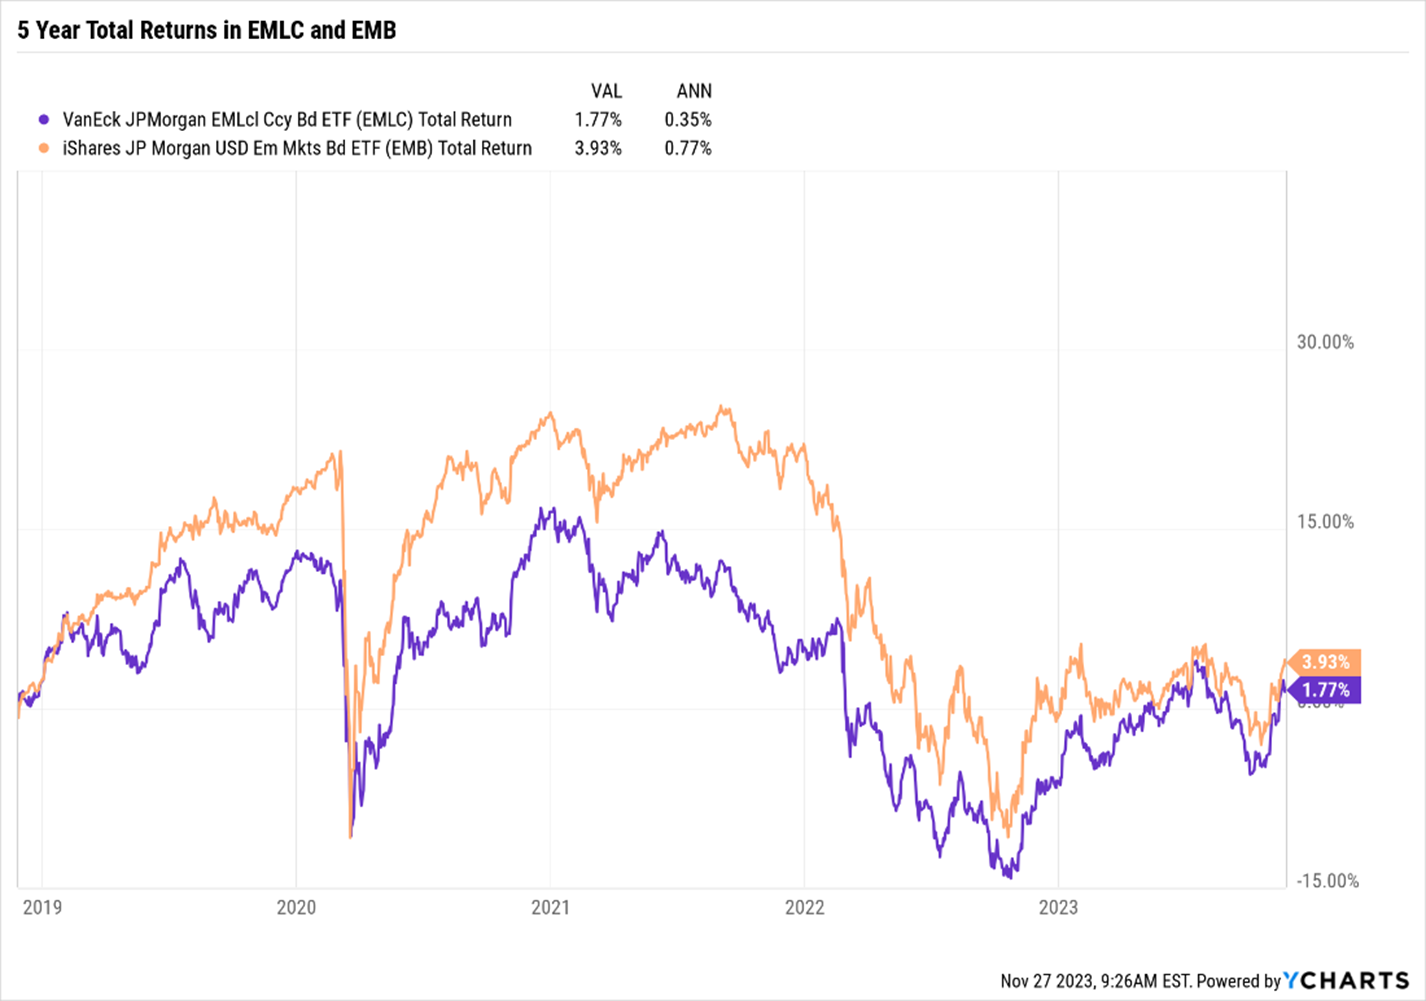
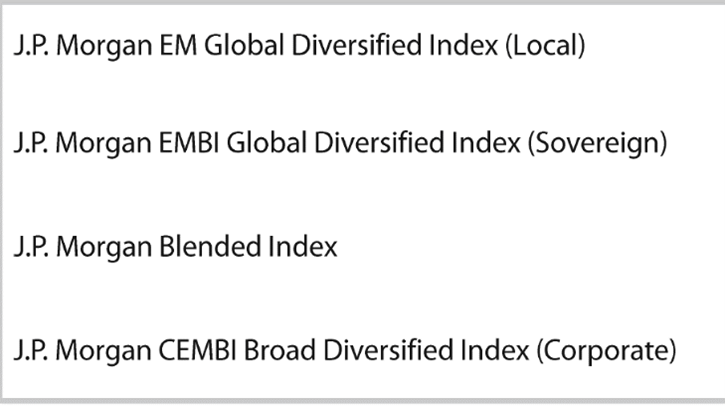
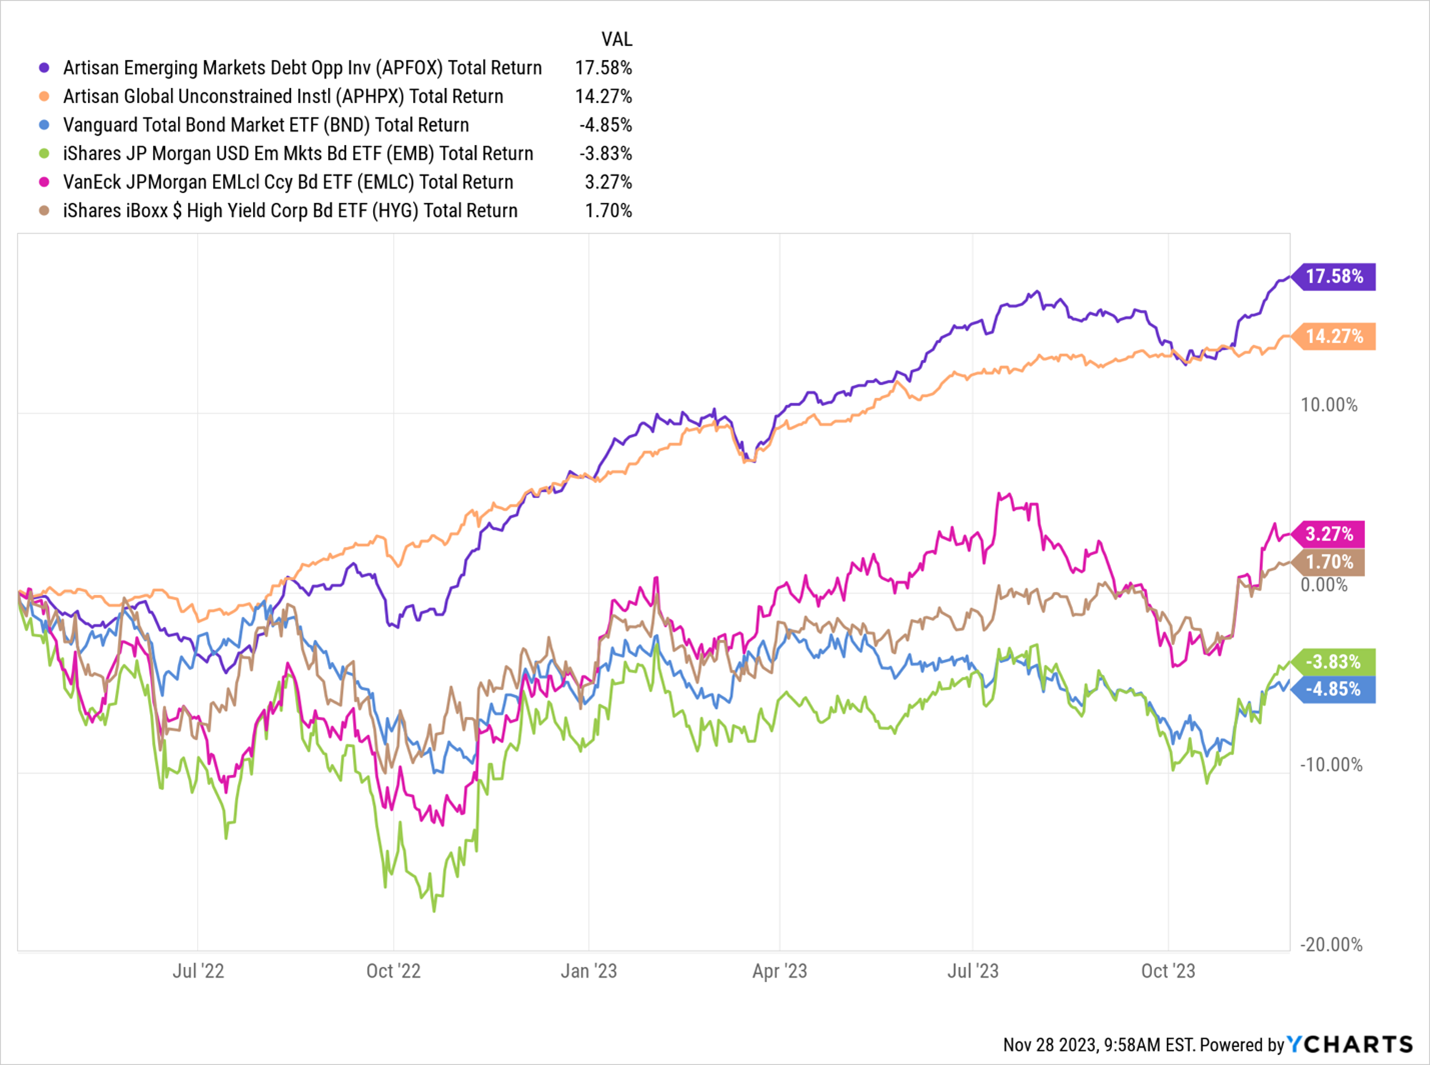
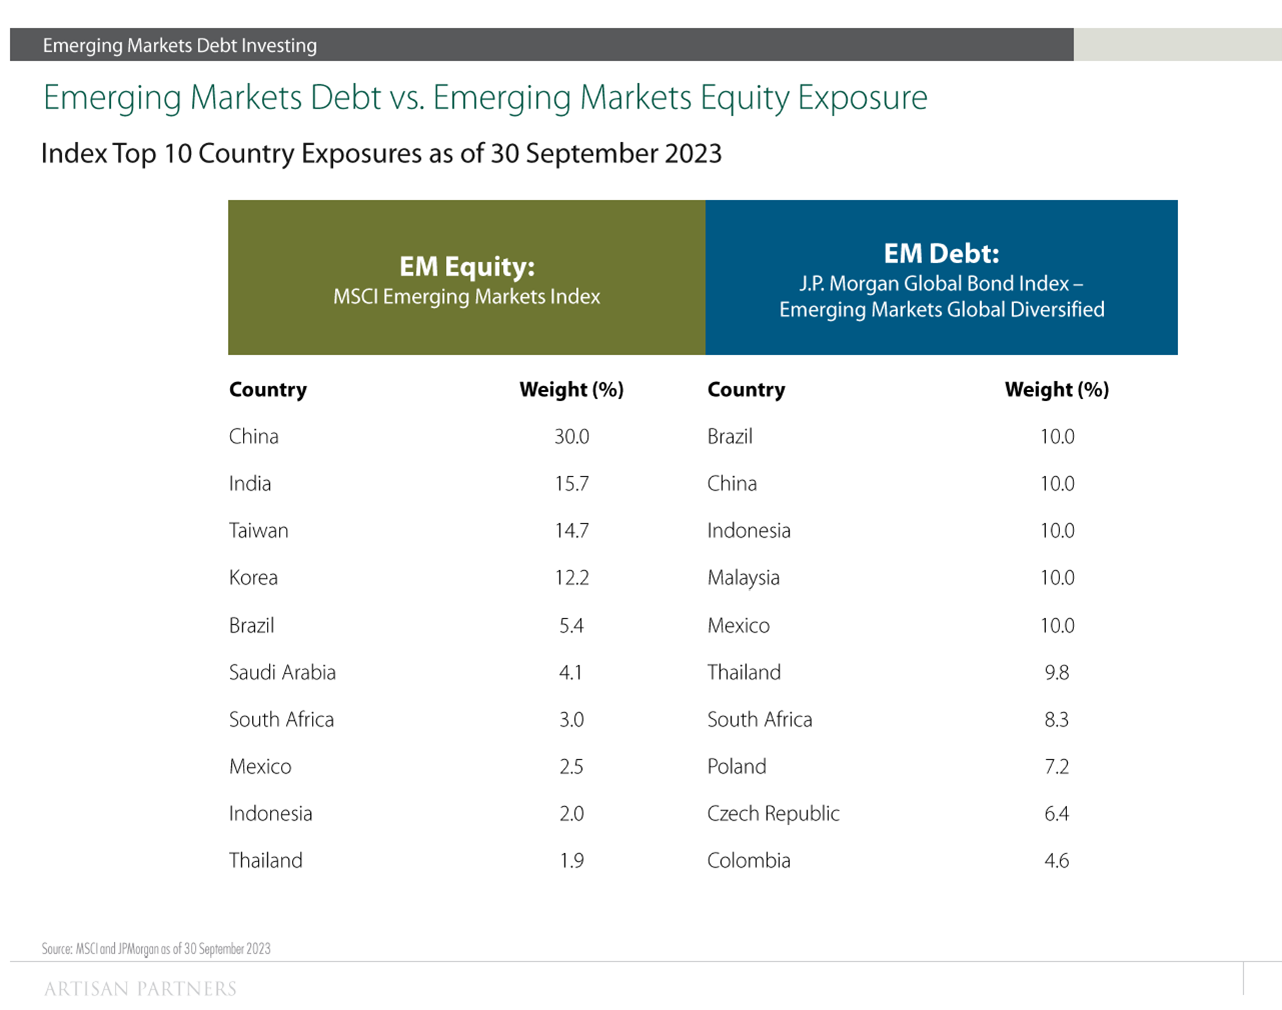
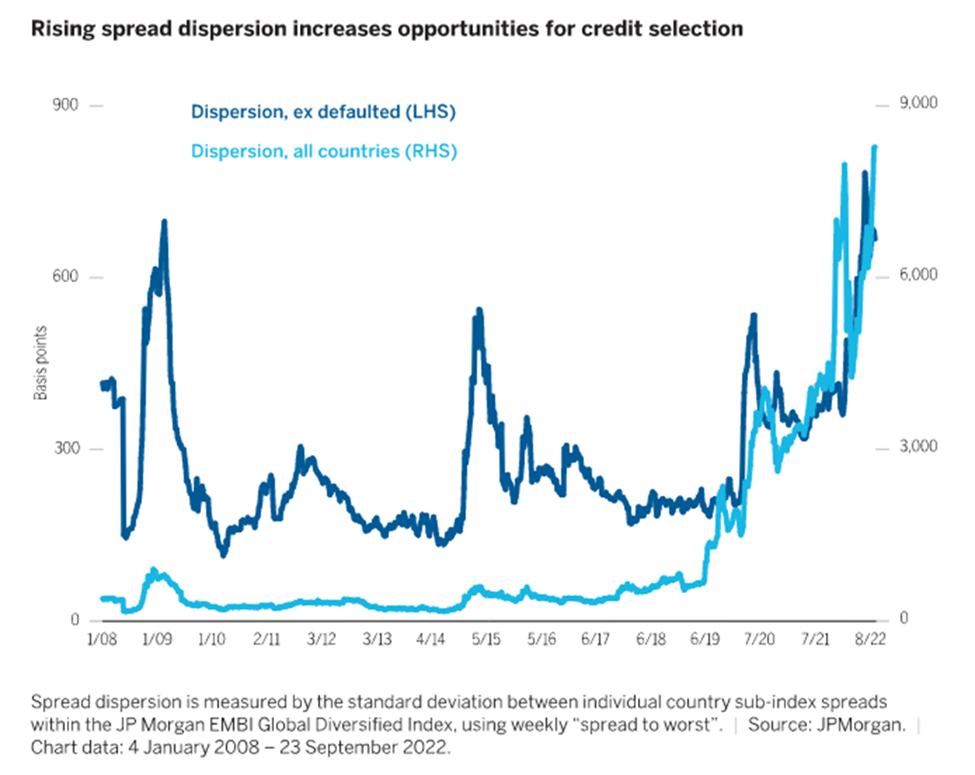
My colleague Devesh Shah had a long and informative interview with one of the industry’s most consistently successful emerging market debt (EMD) investors, Artisan’s Michael Cirami. As a complement to Devesh’s work, I’ve shared a broader piece entitled “Artisan and the Emerging Market Debt Universe.” Read together, they might give you a sense both of the strategy and of its potential role, if any, in your portfolio.

Lynn Bolin went “Searching for Inflection Points.” Lynn understands that the results of what we’ve called The Great Distortion are unsustainable; it is vanishingly unlikely that a handful of high-growth US tech stocks will dominate the global market in the decade ahead. Lynn’s analysis has led him to attractive opportunities in global bond and long-duration funds, and possibly to international equities. His question this month is, “Is it yet time to pull the trigger?”

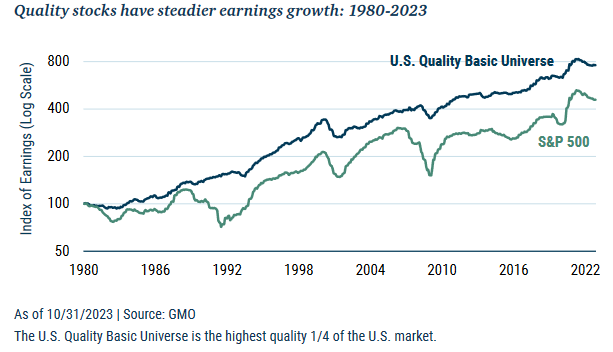
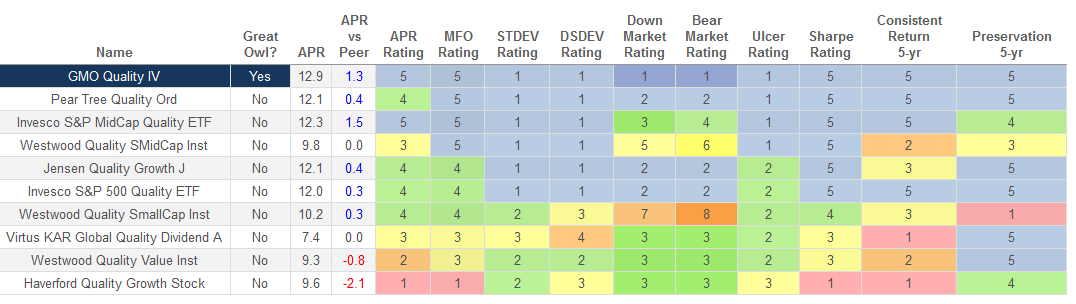
November also saw the debut of two potentially outstanding funds. GMO US Quality ETF, an actively managed ETF, is GMO’s first retail offering. It embodies the Quality Equity strategy that its Focused Equity team has used in the five-star GMO Quality Fund, whose investment minimum runs between $1,000,000 and $500,000,000 depending on the share class.

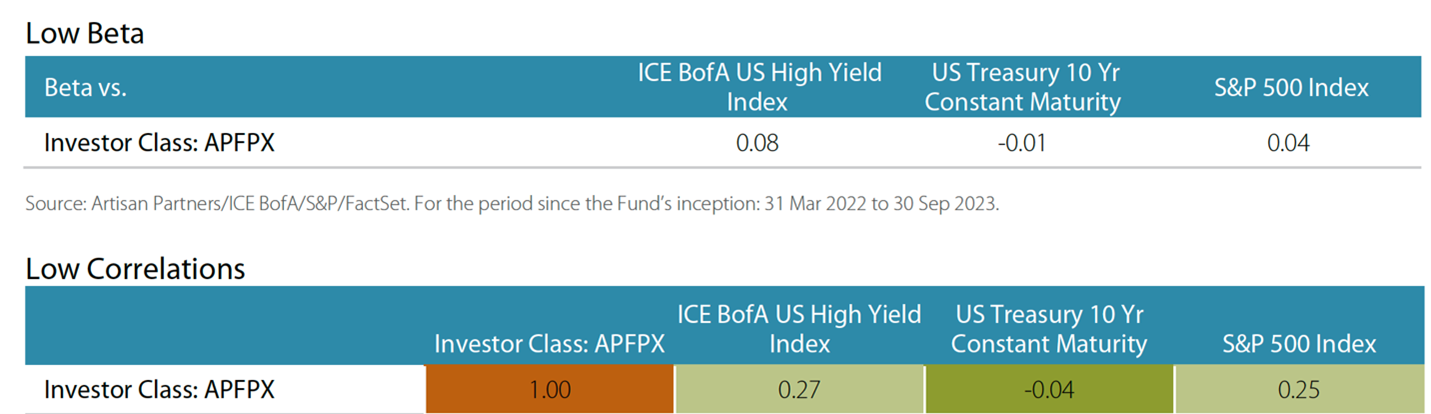
T. Rowe Price Capital Appreciation and Income Fund completes a suite of Capital Appreciation funds from T. Rowe. The driver is the long-closed, five-star Capital Appreciation Fund, whose performance record is unparalleled. Rather than reopen a $54 billion fund, manager David Giroux has been working at the margins. T. Rowe Price Capital Appreciation Equity ETF, launched last summer, follows – but does not clone – the equity discipline in the original fund. The new Capital Appreciation and Income fund adds two further twists: while it uses the Cap App stock discipline, it has a far heavier weight in fixed income, and it introduces Mr. Giroux’s first co-manager, who is responsible for bringing quant insights into the asset allocation.

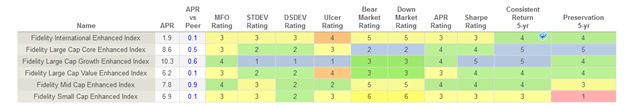
Charles Boccadoro, the maestro of MFO Premium, is introducing this month both enhanced chart tools and fund flow analytics.

And, as ever, The Shadow tracks down the industry’s highs and lows in Briefly Noted.

Charles Thomas Munger (1/1/1924 – 11/28/2023)

Charlie Munger passed away in November, a month short of his 100th birthday. I never met Mr. Munger and have no original insights to add to the ocean of encomia that he fully deserves. 

For a rich guy, he seemed strikingly sensible. I think out of all of the advice he offered, two pieces most stand out.

  1. Don’t get full of yourself. My feelings toward people with half-billion-dollar yachts and $50 million homes alternates between pity and loathing. A centa-billionaire needs a bed no bigger than a pauper’s, and their insistence otherwise speaks to a profound poverty of soul and mind. Mr. Munger’s works are full of cautions about such hubris: “The world is not driven by greed. It’s driven by envy… I have conquered envy in my own life. I don’t envy anybody. I don’t give a damn what someone else has. But other people are driven crazy by it.”

    He explained the magic behind the century’s most successful investing tandem this way: “It’s remarkable how much long-term advantage people like us have gotten by trying to be consistently not stupid, instead of trying to be very intelligent.”

    Jason Zweig reported on Mr. Munger’s preferred epitaph: “I tried to be useful.” No, Mr. Z. notes, “I was useful,” which is for others to judge, but the humble “I tried” (“Charlie Munger’s Life Was About Way More Than Money,” WSJ.com, 11/29/2023).

  2. Keep learning, keep reading widely. “In my whole life, I have known no wise people (over a broad subject matter area) who didn’t read all the time — none, zero.” Even in his 90s, Mr. Munger read widely, sometimes at the rate of a book every two days. “Spend each day trying to be a little wiser than you were when you woke up. Day by day, and at the end of the day – if you live long enough – like most people, you will get out of life what you deserve.”

    His advice was the antithesis of the drone’s impulse to read everything that all of your peers and competitors are reading. If you read nothing but what they read, you’ll think nothing but what they think. Read what they abjure! Read history. Read poetry. Read speculative fiction. Read the words of people smarter than you, and grow from each encounter. Don’t worry about why you’re learning or how it will make you rich next year; learn passionately, and your life will be infinitely richer for it.

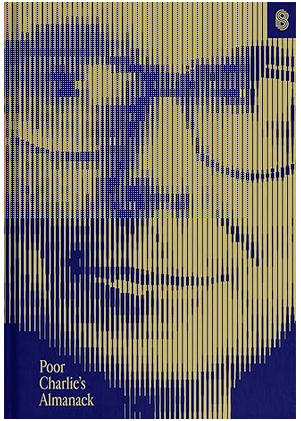
December 2023 sees the release of an abridged Poor Charlie’s Almanack, originally published in 2005. Mr. Zweig notes, “Existing editions have sold about 175,000 copies in English and 1.2 million copies in Chinese. “It’s very rare for people to have sound judgment and to be untouched by the magnitude of emotions that surround them. You can only do that after years of self-cultivation,” said Li Lu, who runs Himalaya Capital, a global investment firm in Seattle with large holdings in Chinese stocks. “People in China really do regard Charlie as an example of modern Confucianism.”

Morningstar’s warning: You’re not that smart.

“New research from Morningstar reveals a concerning trend: over the past five years, investors in thematic funds lost more than two-thirds of total returns because of poorly timed buys and sells.”

Morningstar’s report, The Big Shortfall, builds off of their long-running Mind the Gap studies to show that investors’ buying and selling habits destroyed considerable value. They find:

  1. Investors in narrowly focused funds routinely screw themselves with mistimed purchases and sales.
  2. Investors in narrowly focused ETFs screw themselves more than those in comparable funds because it’s so much easier – and more manly! – to trade ETF shares frequently throughout the day, relentlessly multiplying the cost of overconfidence.
  3. Investors in Hot! Hot! Hot! funds fared worst of all.

I’ll close with Mr. Munger’s contrary advice: “It’s so simple. You spend less than you earn. Invest shrewdly, and avoid toxic people and toxic activities, and try and keep learning all your life. And do a lot of deferred gratification because you prefer life that way. And if you do all those things, you are almost certain to succeed. And if you don’t, you’re gonna need a lot of luck.”

Thanks, more than ever …

A bunch of kind folks shared both kind words and some end-of-year financial support this month. I’m honored to thank the folks who have, in some cases, supported MFO for more than a decade and returned this month: Leah from Massachusetts (we’ll try!), Michael of Vegas, Richard from Georgia, Santa from the North Pole (ho-ho-ho, Anonymous Sir!), Binod from Houston, Robert of Kirkwood, Mark from Michigan, John from Pensacola, and Kevin from Brooklyn.

To The Faithful Few, whose monthly contributions keep spirits up and the lights on: Wilson, S & F Investment Advisors, Gregory, William, William, Stephen, Brian, David, and Doug. If you’d like to do your part to keep MFO up and running, please click on the “Support Us” link above or join the MFO Premium folks who, for just $120/year, get access to maestro Charles and some of the most advanced search tools available (or, at least, “available for less than the $16,000 that some others charge”).

Wishing you good health and a joyful season,

david's signature

@MFOPremium Channel Demos Enhanced Chart Tool, Plus Fund Flows Preview

By Charles Boccadoro

We rolled-out our interactive Total Return Chart Tool last year, as described in Introducing MFO Charts. Recently, we integrated several new features, including enhanced styling, eliminated display restriction (previously based on youngest fund), and added a legend placement option. Here’s a screenshot of 10-year total return performance of Artisan’s US equity funds, through November’s close, along with a comparison with S&P 500 ETF SPY:

All these Artisan funds have recovered strongly since their COVID lows, but some are well off their peaks at start of The Great Normalization cycle, which began January 2022, especially Artisan Small Cap Inv (ARTSX).

Over the past ten years it’s been hard to beat the S&P500 and our chart shows SPY is just few percent shy of its all-time high.

The features of our interactive Chart Tool include:

  • Total return performance plots of up to 12 funds.
  • Adjustable display period via Zoom buttons and Navigation Bar at bottom of chart.
  • By default, Y-axis units are percentage growth relative to initial value of each fund for the plot period displayed.
  • Scaling defaults to Relative and Linear, but it can be changed to Absolute and Logarithmic. Logarithmic scaling can be helpful because compound growth of constant value will appear as a straight line with its slope indicating the annualized return.
  • New charts can be obtained quickly via the New button.
  • Change location of legend or hide summary note below the chart via the View button.
  • Click on fund name in legend to hide fund series.
  • Hover cursor over plot to see performance values of each fund in series. Hover of fund name in legend to highlight its performance.
  • Export and view chart data, print the chart, and download chart image in various formats.

We’ve created the YouTube channel @MFOPremium to host instructive videos on the features and use of all the tools on the site. Our first video is, aptly: Demo Total Return Chart Tool. Hopefully, these videos, in addition to our webinars, will help users fully explore the features embedded throughout the site.

Speaking of webinars, our year-in-review webinar is scheduled for Friday, 5 January. It will highlight performance of funds across different market segments and attempt to showcase various search features, including additions since our mid-year webinar. There will be just one session this year at 9 am Pacific (noon Eastern). Join us if you can in the New Year by registering here.

Lastly, my colleague Devesh Shah has advocated for months to bring fund flows to the premium site, which come via our Lipper Global Data Feed. But it’s a lot of data! The really hard part though is figuring out how to best integrate these data for ease of use and subscriber benefit. Fortunately, thanks again to our HighCharts license, we are close to bringing a new tool to the site called … Flows.

Below is a sneak preview of our evolving Flows tool, using one of my more painful memories, namely AlphaCentrics Income Fund (IOFIX), once considered the perfect fund … it went up, or stayed even, but rarely retracted … until one fateful day in March 2020.

Launch Alert: T. Rowe Price Capital Appreciation & Income

By David Snowball

On November 29, 2023, T. Rowe Price launched the T. Rowe Price Capital Appreciation and Income Fund (PRCFX) after the longest gestation period in fund history. Normally, there’s a lag of 70 days between a fund’s initial SEC filing and its clearance to launch. In this case, the lag is 2,590 days. The fund was organized in October 2016, filed a full prospectus in September 2017, at which point T Rowe Price bought 10,000 shares, and appeared in all of the subsequent Statements of Additional Information filed annually with the SEC.

It’s clear this has been on the adviser’s mind and to-do list for rather a while.

The fund will invest 50-70% of its net assets in fixed-income and other debt instruments (corporate and government bonds, mortgage- and asset-backed securities, convertible bonds, and bank loans) and 30-50% in common and preferred stocks. The target securities are issued by “companies whose stocks are expected to provide an attractive return relative to the company’s associated risk…. The fund follows a similar security selection process with respect to fixed income and other debt instruments.” In particular, they target firms with some combination of

  • experienced and capable management;
  • strong risk-adjusted return potential;
  • leading or improving market position or proprietary advantages; and/or
  • attractive valuation relative to a company’s peers or its own historical norm.

There are no limits on the market capitalization of the issuers of the stocks in which the fund invests.

The fund will be managed by David Giroux, whose other charges include the long-closed T. Rowe Price Capital Appreciation Fund (PRWCX) which he has managed since 2006, and T. Rowe Price Capital Appreciation ETF (TCAF), launched in June 2023. In both cases, he is listed as the sole manager of the fund. The new fund is co-managed by Farris Shuggi, a quantitative analyst who joined Price in 2008. Price refers to these, collectively, as “the Capital Appreciation suite” of funds. Mr. Giroux positions the new fund as most attractive to “clients … who prioritize current income and enhanced capital preservation.”

Fund Equity allocation Expenses / assets Management
Capital Appreciation “at least 50%” with up to 25% international; currently 60% equity with 194 stocks 0.72% / $55 billion Giroux
Cap App Equity ETF 100% equity with 100 stocks 0.31% / 506 million Giroux
Cap App & Income 30-50% equity 0.655 / – Giroux / Shuggi

Why might you be interested?

We noted in our August 2023 analysis of the fund when it was in registration with the SEC, “You care because T Rowe Price Capital Appreciation is (a) utterly unmatched and (b) closed tight. MFO/Lipper categories PRWCX as a Growth Allocation Fund. Here is its performance against its peers:

Period APR Sharpe ratio rank APR rank Ulcer Index
03 year 11.1% #3 of 242 #6 #18
05 year 10.9 #1 of 233 #1 #6
07 year 10.8 #1 of 215 #2 #5
10 year 10.3 #1 of 188 #1 #3
15 year 10.1 #1 of 146 #1 #20
20 year 10.1 #1 0f 95 #1 #5
25 year 10.0 #1 0f 77 #1 #2
30 year 10.8 #1 of 42 #1 #1

Source: MFOPremium.com, using Lipper Global Dataset data and custom calculation

Three things to note:

  • #1. As in, “damn, this has had the #1 risk-adjusted returns over the past 5, 7, 10, 15, 20, 25, and 30-year periods?” Yep. The Ulcer Index, a more conservative risk-return calculation, refers to roughly the same picture. The few funds with lower Ulcer Indexes tended to have dramatically lower total returns as well.
  • 10. As in, “damn, this strategy returns 10% a year over every trailing period?” Yep. Annualized returns since inception in 1986: 11.2%. Average three-year rolling returns since inception, 11.3%. Average five-year rolling returns: 11.2%. Average 10-year rolling returns (you guessed it): 11.0%.
  • 3. As in “three different managers – Richard Howard (1989-2001), the late Stephen Boesel (2001-05) and David Giroux (2006- ) – all managed to produce the same results. The founding manager, Richard Fontaine (1986-89), falls outside the time boundary of our table.

In short, this appears to be a strategy that works – at least within the confines of T Rowe Price’s culture – across managers and across market cycles. Mr. Howard’s succinct description of the fund was “A defensive fund willing to use aggressive tactics.”

Potential investors would benefit from reviewing a long and thoughtful discussion about the Capital Appreciation suite (one of three discussions of the fund ongoing at the board) on the MFO discussion board. Observant1, one of our community members, shared a reflection by Mr. Giroux about his new co-manager:

Jeff Ptak from M* asked David Giroux: “With the benefit of hindsight, what do you think you might have urged your younger self to do and conversely, warn the younger you to refrain from doing, given all that you’ve learned along the way?”

David Giroux’s partial response:
“Second, I think I would tell myself to work more closely with the quantitative resources at T. Rowe earlier in my career. I really didn’t do anything on that front really until late ‘09. I joke with people internally. There was a BFS era, before Farris Shuggi, and AFS, after Farris Shuggi, period at CAF. I’ve worked very, very closely with Farris Shuggi and the rest of the quant team at T. Rowe on so many proprietary projects over the last 14 years that have really meaningfully and positively contributed to CAF’s performance. Honestly, it changed the way I managed CAF for the better over time.”

Bottom line

All investing involves risk. The risks here are the unknowns created by adding the quant overlay to a long-established strategy and the greater reliance on a fixed-income sleeve of the portfolio. Given all that we know about the strategy and the team, it seems like a risk well worth considering for conservative investors who would benefit from additional income, both for its own sake and for the sake of the stability it might add to the fund’s day-to-day performance.

In Conversation with Michael Cirami

By Devesh Shah

Missed Opportunity in Brazilian Interest Rates sowed the seeds of finding the right fund

Earlier this year, one of my friends, a doyenne of Currencies and Interest Rate trading, told me there was money to be made in Brazilian Real Local Government Bonds and interest rate products. In 2022, the Brazilian interest rate rose from 9.25% to a cycle high of 13.75%. Inflation was soaring there as in the rest of the world. A lot of traders lost money calling the highs in the rate high cycle and threw in the towel. Losses multiplied. But by the turn of the year, things were looking different. Inflation was coming down, the Central Bank had stopped raising rates in Sao Paulo and had stopped sounding hawkish. Since the market had been wrongfooted in 2022, interest rates seemed too high at the beginning of 2023.

“Devesh, you have to get involved in Brazilian local rates,” she pleaded. “This is a great trade.”

“But how?” I responded with frustration. “No mutual fund or ETF allows an individual investor based out of the USA to invest in local Brazilian Government bonds in Reais. There has never been a way to participate.”

She has always been liberal with her market calls and is almost always right. But trading Thailand vs. Malaysia or Aussie rates vs. Mexican rates is not my forte. I twiddled my thumbs until I determined to find an answer to the problem. I have enough background in these products to understand their complexity and the opportunity set.           

My personal career history in EM showed opportunities and risks.

Right out of college, my first job was to trade Latin American currencies and local interest rates. From 1997 to 2000, I called banks and brokers in Venezuela, Argentina, Colombia, Chile, Brazil, and Mexico to buy and sell currencies and bonds for Merrill Lynch’s customers and for the bank’s own capital. Once, we took down an entire Colombian bond auction at 32% interest rates. But I also saw the Argentine and Venezuelan devaluation, and there is nothing uglier than seeing money evaporate. Debt instruments in Emerging Markets are fascinating because there are so many countries and so many products.

Exciting and educational it may be, but perhaps it is a blessing in disguise that simple fund products don’t exist to speculate on the future path of these Emerging Market (EM) debt assets. At a bank, one could be a specialist. Not from home. I kept looking for an intelligent way to harness the opportunity set in Emerging markets debt.

Does the answer lie in a Passive ETF?

For local currency investments, the Van Eck JP Morgan EM Local Currency Bond ETF (EMLC) has almost $3 Billion in AUM. For hard currency investments, The iShares JP Morgan USD EM Bond ETF (EMB) is the go-to vehicle with almost $14 Billion in Assets. Unfortunately, neither of them inspires despite the billions invested in them. The 5-year Total Return for both are in the low single digits. There are many reasons for the poor record, but I am not looking for losers to turn around. I want to talk to winners who know how to make money.

PS: One wonders who these investors are with $17 Billion in these sorry ETFs. And why do they continue to be involved in it?

The Active Choice: Artisan EMsights Capital Group Emerging Market Debt Funds

I kept looking for active funds that would fit the shoe for EM debt and beat the pants out of the passive. With the help of the MFO Premium search engine, I found what I think is a good fund for the purpose and the portfolio.

Michael Cirami is a fund manager of three EM Debt funds at Artisan Partners. I spoke to him in mid-November to understand better what he does and why his funds might work for those in search of an adept manager in EM debt. I’d like to add that David Snowball has a companion piece that readers should read. If a reader wants a greater appreciation of what the fund tries to accomplish, there is a fantastic interview by The Wall Street Transcript. I wanted to take a slightly different approach. As an asset allocator, it matters less whether the fund chooses or avoids Nigeria or Guyana. The important thing for investors in our seats is to understand what this fund does and how it fits into our overall portfolio.

Can we start with why the passive investment approach does not work well in EM Debt?

Passive ETFs generally follow Benchmarks. In EM Debt, there are four benchmarks:

Benchmarks are riddled with problems: Countries which issue the most debt tend to have the biggest positions in the index. Just because a country is highly indebted does not make them more investment-worthy. Perhaps, quite the opposite. Benchmarks may assign very low weights to some countries or all together ignore other countries while still keeping defaulted countries in the benchmark. There are arbitrary rules on minimum size and maturities included in the index. Bonds in the benchmark also have a lot of risk to non-EM factors: like US interest rates of the Euro currency rate. Finally, the benchmark carries many bonds with low spreads to US treasuries which do not offer attractive yields to debt investors.

These are some of the reasons why Passive ETFs have not performed well in EM.

What do you do that’s different?

We are benchmark agnostic. We start with a blank piece of paper and determine the best investments in EM across sovereign hard currency bonds, local currency bonds, corporate bonds, and derivatives which allows us to hedge or add to FX risk, Credit risk, or interest rate risk. Our investment universe is around 130 countries. Furthermore, we hedge out the US Interest rate risk across all our investments (more about this later).

We manage three different investment strategies:

  1. Artisan Global Unconstrained (“Unconstrained”)
  2. Artisan Emerging Markets Debt Opportunities (“EMDO”)
  3. Artisan Emerging Markets Local Opportunities (“Local”).

As of October 2023, the assets under management (AUM) are: Unconstrained $301 million, EMDO $82 million, and Local $412 million. We manage mutual funds, separate accounts, and European UCITS.

Only Global Unconstrained and EMDO are available to US Mutual Fund investors.

The EMDO fund is a long only fund in the EM debt asset class. It’s 100% EM alpha and beta.

The Global Unconstrained fund is a long-short fund across EM and Developing Markets (DM). This fund can be a mix  80% EM and 20% DM. Because it’s Long Short it carries less beta risk than the EMDO fund. It also allows us to capture alpha on both sides of the market as our analysts are focused on country by country and security by security research.

We believe that investing in mid-size countries like Brazil and Mexico might set up every now and then. But these tend to be generally more efficient. Our sweet spot is in the highly inefficient countries, tens of smaller countries, which can offer true diversification to a portfolio, and where the chances of over and undervalued securities are highest.

How big is your investible universe set for this asset class?

We believe the Sovereign Hard Currency market is about $1 Trillion dollars. Local currency bonds ex-China is about $2 Trillion, and perhaps $3 Trillion if we include India. The size of the asset class is not relevant to what we do as we try and find the best opportunities in EM.

You started the funds in March and April 2022. Let’s take a look at the returns of the two funds and compare them with a few passive ETFs.

The EMDO and Global Unconstrained have fared substantially better in a hostile broader environment for bonds. Tell us something we should learn from this observation.

Over the last ten years, the EMBI (which is 90% in hard currency sovereigns and 10% in corporates) generated a total return of 24%. A hard currency bond is priced on a spread to US Treasuries. Over this period, about 44% of the return generated in the EMBI came from US interest rates. The passive is heavily exposed to the movements in US interest rates and thus is a confusing barometer with EM-specific performance.

Take the example of a new 10-year Turkish bond in US Dollars. It may be issued at a spread of over 4% (400 basis points) to the US 10-year, which has a current interest rate of 4.5%. The combined yield or interest earned would be 4 + 4.5% = 8.5%.

The EMBI would invest in a bond like this. So, a lot of the yield of the Turkish bond is coming from the level of the US 10-year interest rates. If US interest rates risk, and US bonds fall, so will the Turkish bond, even if the fundamentals might improve in Turkey on the margin.

In our funds, we hedge out our interest rate risk. If we bought the Turkish bond, we would short the 10-year US Treasury bond against it and mostly, but not fully insulate ourselves from the long-dated US Bond market.

We would then invest the proceeds generated from the sale of the 10-year US Treasury into short-term US Money market funds. This way we reduce the duration risk of all the positions.

We can still earn the 4% spread, and we could earn 5.25% from the current overnight cash rate, or a total of 9.25% now. We thus convert a fixed rate bond portfolio to a floating rate portfolio.

By choosing our countries based on opportunity set and not market cap weight, and by hedging duration risk from our investments, our funds behave differently from the passive ETFs.

What returns can be expected for an investor willing to invest in the fund for 5-7 years?

We understand that investors expect to meet a certain hurdle rate to step out of their comfort zone and invest in EM debt.

There are two components to our funds: Hard currency bonds and local bonds. Both have a wide dispersion between countries.

First, Sovereign & Corporate hard currency bonds trade from 300-400 bps over US Treasuries to as wide as 1000 bps. We think a blended rate is about 500 bps.

Second, local interest rates may be as low as 2% and as high as 9-10%. Additionally, there would be some FX movements on our investments. We see the Excess return to US Treasuries there to be between 300 to 500 bps.

Blending the two, we hope to earn an excess return over Treasuries with a spread duration of about 2.2 years. In a very good year, that could lead to mid-teens in returns. In a poor year, given the high yield, it might be in the small single-digit negative territory.

Returns are generally not going to be as extreme as Emerging Market Equities.

Besides the difference in volatility between Bonds and Equities, is there a difference in composition?

Compared to EM Equities, EM Debt is less volatile and also not as concentrated in Asia. Here is a chart with Top 10 country exposures:

How correlated are the funds with other large asset classes?

The Global Unconstrained fund has a low beta and low correlation to US assets like the HY Index, the 10-year Treasury, and the S&P 500 Index.

Depending on the existing portfolio structure of investors, our EM debt funds can be a good diversifier. They can be a low duration, low beta, low correlation, high Sharpe ratio asset to own.

We believe that active management wins by not losing. We hope to protect the downside and compound capital over the years.

Note to reader: Since I was looking for a way to allocate to local and sovereign debt positions in Emerging Markets on a long-only basis, I am an investor in EMDO.

When I asked Michael where he is invested, he said, “I have been a fixed-income investor in my career. We tend to be a bearish breed, but I have money in both of the funds.”

How does he plan to deal with a large institutional investor deciding to pull the sell trigger on the portfolio given the highly illiquid and geographically diverse nature of the EM debt investments? Portfolio distribution in kind only works in theory. I am sure that’s not an option.

We invest in sovereign/corporate bonds and derivatives that span the liquidity spectrum. Many of these markets are highly liquid. I have managed in this style for nearly two decades in all different market conditions, and EM markets can be more liquid than some other traditional credit markets. Having said this, we would not have difficulty managing a large sell in the portfolio.

Conclusion

My journey started with the quest for a public market fund that offered intelligent exposure to EM Debt. The Artisan EMDO and Unconstrained seem to be the solution in the right direction. There might be other funds too, but I would be watching both funds very closely as a current investor. With Debt funds, there is less hyperbole. We are never going to have really great years. The hope is to compound capital outside of equities in a steady and solid manner. Michael Cirami and the team seem to have a handle on that process.

Launch Alert: GMO US Quality Equity ETF

By David Snowball

On November 13, 2023, the Boston-based institutional investment firm GMO, founded in 1977 as Grantham, Mayo, and Van Otterloo, launched their first retail product: GMO US Quality Equity ETF (QLTY). The actively managed fund will invest in a focused portfolio of “companies with established track records of historical profitability and strong fundamentals – high quality companies – are able to outgrow the average company over time and are therefore worth a premium price.” Expect a portfolio of about 40 names, with a 75% weighting in large-cap stocks and 25% in mid-caps. At 0.5%, the ETF charges the same expenses as the $5 million share class of the Quality fund.

The fund will be managed by the three-person Focused Equity team: Tom Hancock, Ty Cobb, and Anthony Hene. All three joined GMO in the middle 1990s and boast 28 or 29 years of investment experience. Together, they manage the $7.5 billion GMO Quality Fund, which launched in 2004, and the $117 million GMO US Quality Strategy, which launched in June 2023. GMO Quality Fund is rated five-star / Gold by Morningstar and a Great Owl by MFO for its consistently top-tier risk-adjusted returns over the past 3-, 5-, 10-, and 20-year periods.

Why might you be interested?

GMO argues that investing in quality equity should be the core of any long-term investor’s portfolio. Their argument is that there’s “much gnashing of teeth” over the value/growth divide, which fails to recognize that both of those disciplines have innate weaknesses: growth investors tend to get trapped by short-term momentum plays, while value investors tend to get trapped in … well, value traps; companies that are achingly cheap, but for good reason.

The Focus Equity team’s contention is that by adding the third factor – quality – to a discipline that is both growth-centered and value conscious, they’re able to consistently thread the needle.

We believe the GMO Quality Strategy is an ideal core equity holding that has delivered strong returns, stability, and downside protection for investors for nearly 20 years and counting. By selecting stocks for their durable quality characteristics, it sits outside of the growth vs. value dilemma and avoids the pitfalls of those styles. Compared to similar approaches that employ more systematic commoditized processes but fail to consider valuation, the GMO Quality Strategy has delivered superior results and has earned the right to be called the real McCoy.

They illustrate the potential stability of the strategy by looking at the stability of the earnings of “quality” companies in comparison to the broader market.

GMO clearly intends to market this as an extension of the Quality Fund. The ETF factsheet advertises, for instance, “No minimum size required to invest in a 20-year institutional strategy.” GMO describes their process and competitive advantage this way:

In 2004, GMO launched the Quality Strategy with the mandate to own attractively valued stocks within the quality universe. The creation of the strategy was the culmination of decades of GMO research on quality business models. While the strategy’s origins date back to GMO’s earliest days, our process continues to evolve to ensure sustained relevance as well as our investment edge. We believe an increased emphasis on fundamental analysis in the last decade has given us a better chance to win and has further distinguished our approach from increasingly commoditized “factor” portfolios.

Investors in the strategy have always included a mix of tactical investors and those who consider the Quality Strategy to be a core, long-term allocation. It is worth mentioning that some of those earliest “tactical” investors still hold our strategy nearly 20 years later.

GMO is pretty openly dismissive of mechanical strategies that try to capture “quality” or “low volatility” through passive ETFs. Low-vol strategies simply focus on what was low volatility in the past, with no attempt to anticipate seismic change, so “they tend to exhibit significant time-varying style and sector exposures, often with abrupt turnover at inopportune times … For example, many levered financial services companies seemed relatively low volatility in 2007 until suddenly they weren’t.”

Smart beta quality strategies have a process that ends at the point that GMO’s begins. The smart beta funds run quant models and then buy the highest-rated stocks. GMO runs the quant models, then begins to query the outputs:

While we have a high degree of confidence in our own quant models, we recognize that the best quant models can produce false positives if, for example, a business model has exploited a niche that has eroded over time or if the perceived stability of profitability is merely a function of an unusually long cycle.

Similarly, sole reliance on quantitative screens can result in false negatives and exclude long-term, durable quality business models that may not meet one criterion of the screen or may not yet have enough financial history for the model to sort.

Dr. Hancock is the head of GMO’s Focus Equity team and has been with the strategy for 15 years, so we searched at MFO Premium for the 15-year performance of all equity funds with “Quality” in their name.

Color is the key to a quick reading of this graphic. Blue cells signal performance in the top 20% of one’s peer group, green in the next lower tier, then yellow, orange, and red. GMO Quality has the highest annual returns in the group and is the only fund to earn a place in the top tier by every measure we assessed: returns, volatility, down- and bear-market performance, risk-adjusted returns, and consistency of returns.

Bottom line

The US Quality ETF is not a clone of the Quality Fund because the latter owns some international stocks as well as US stocks. It does appear to clone the newer US Quality Strategy, which relies on the same team, the same logic, and the same discipline as the Quality Fund. GMO’s research library offers rather a lot of evidence by which to assess both the idea of “active quality” investing and the performance of the GMO Strategies over time.

It warrants your attention.

Artisan and the Emerging Markets Debt Universe

By David Snowball

My colleague Devesh Shah sat down with Artisan’s Michael Cirami for a long conversation. Mr. Cirami is a managing director of Artisan Partners, a portfolio manager on the EMsights Capital Group, and lead portfolio manager for the Artisan Emerging Markets Debt Opportunities, Global Unconstrained, and Emerging Markets Local Opportunities Strategies. Two of those three strategies, Debt Opportunities and Global Unconstrained, are manifested in mutual funds.

Prior to joining Artisan Partners in September 2021, Mr. Cirami had a distinguished career at Eaton Vance. He is also a member of the Board of Directors of the Emerging Markets Investors Alliance. The organization seems to strongly emphasize collaborative action to improve transparency and sustainability in emerging markets.

As a complement to their long and thoughtful discussion, we’ll share the answers to two questions. First, what’s the case for investing in EM debt? Second, what’s the case for investing with the Artisan Emerging Markets Debt Opportunities Fund (APFOX)?

The Case for Emerging Markets Debt

  1. Emerging markets debt is a major and mature asset class.

    The exact size of the universe is unclear. Emerging market investor Ashmore Group estimated it at $30 trillion in 2020, while the Institute for International Finance has over $100 trillion now. Yes, Covid, but really?

    The EM government bond market is USD 13.0trn (44% of the total), while the corporate bond market is USD 16.6trn (56% of the total). Financial sector corporates in EM have issued USD 10.7trn of total outstanding corporate debt with the balance of USD 5.9trn issued by non-financial corporates. (Ashmore Group, EM Fixed Income Universe 9.0, 8/202o)

    The report showed 75% of the Institute for International Finance’s emerging market (EM) universe saw an increase in debt levels in dollar terms in the first quarter, with the overall figure crossing over $100 trillion for the first time. China, Mexico, Brazil, India and Turkey posted the biggest increases, the data showed. (Reuter, “Global Debt on the Rise,” 5/17/2023)

    The IMF Global Debt Monitor report laments:

    Adequate debt data are typically lacking for many emerging market and low-income countries. (Global Debt Monitor, 12/2022)

    Broadly speaking, historical problems like debt defaults have largely faded as more markets have matured and have taken seriously the conditions imposed by international lenders.

    Mr. Cirami, in speaking with Devesh, makes two points: he believes his investable universe is something in the $3 trillion range and, further, that the overall size of the universe is largely irrelevant to his ability to find attractive, mispriced assets.

  2. Emerging markets have stronger fundamentals than developed markets.

    The question to ask before lending someone money is, are they going to promptly repay it? The answer to that is informed by how much debt they’re already in and what their record of repayments has been. (Those are the dominant factors driving an individual’s credit scores as calculated by Experian, TransUnion, and company.) Emerging markets carry far less debt than developed markets, such as the US and Europe. The developed markets’ debt-to-GDP ratio is over 120%, while the emerging markets are under 70% debt-to-GDP ratio.

    Emerging markets have held up surprisingly well against a series of challenges that might previously have led to a debt crisis. Kenneth Rogoff, former chief economist of the International Monetary Fund and Professor of Economics and Public Policy at Harvard University, marveled at the available calamities that might have upended the emerging markets but haven’t:

    … wars in Ukraine and the Middle East, a wave of defaults among low- and lower-middle-income economies, a real-estate-driven slump in China, and a surge in long-term global interest rates – all against the backdrop of a slowing and fracturing world economy.

    But what surprised veteran analysts the most was the expected calamity that hasn’t happened, at least not yet: an emerging-market debt crisis. Despite the significant challenges posed by soaring interest rates and the sharp appreciation of the US dollar, none of the large emerging markets – including Mexico, Brazil, Indonesia, Vietnam, South Africa, and even Turkey – appears to be in debt distress, according to both the IMF and interest-rate spreads. (“Emerging markets have ignored the ‘Buenos Aires consensus,’” Financial Review, 11/28/2023)

    Research Affiliates calculates a 4.5% real return for EM local debt over the next decade, with a Sharpe ratio of 0.32. Of the development markets, only Japan is poised for returns competitive with those (4.6%), with the US and European markets projected to return 1.6 – 3.4%. If correct, EM debt will return about 50% more than developed markets debt, though with higher volatility.

    That higher volatility has to be read in context: the long-term returns in EM debt tend to match those of US high-yield debt but with about half of the volatility. So EMD is more volatile than investment grade debt, with higher returns, but dramatically less volatile than high-yield, with comparable returns.

  3. Most investors are underexposed to emerging market debt

    You need to approach this argument with care.

    In an ideal world, your portfolio is composed of a mix of assets that give you the most bang for the buck. That doesn’t mean betting it all on the assets you pray will return the most on their own; it often means including some assets that will zig when the market zags. EM debt tends to be a ziggy asset. The mix of assets that give you the best risk-adjusted returns defines “the efficient frontier,” which is simply an analysis of what mix of assets gives the best results given the amount of risk you’re willing to take on. The mix is different if you’re willing to (or if you think you’re willing to) live with 15% annual volatility than if you’re comfortable with 6%.

    Eric Fine and Natalia Gurushina, from the Emerging Markets Fixed Income team at Van Eck, calculate the efficient frontier for fixed-income investors for the period from 2003-2022. By their calculation, “for a fixed income portfolio with a low desired volatility of around 6.5, the optimal allocation to EM debt should have been 8%” (The Investment Case for Emerging Markets Debt, 2023). Sophisticated investors such as US pension funds are typically at 3%, and individual investors have a vanishingly small exposure.

    That parallels our biases in EM equity investing. Morgan Stanley estimates that US investors have 6-8% exposure to EM equity, with an optimal exposure of 13-39% based on metrics such as GDP, implied marketing weighting, or efficient market theory (“Emerging Market Allocations: How Much to Own?” 2021).

The Case for Artisan Emerging Markets Debt Opportunities Fund

Passive investors in emerging markets have been plagued by underperformance in both absolute and risk-adjusted terms. That’s true in both equity and debt. The problem in both cases is that the benchmark indexes are poorly designed to favor “scalable” investments; that is, they tend to favor large, indebted issuers in larger markets. Mr. Cirami argues that there are a series of errors embedded in the EM benchmark:

We think there are interesting investments out there. Importantly, we don’t think they’re all represented well by the standard EM debt benchmarks—which exclude significant investable swathes of the markets. To take just one example, consider the hard currency space (wherein, incidentally, we think the benchmark does a slightly better job of representing the asset class): the benchmark excludes countries’ euro-denominated paper issuances, which means countries like Albania, North Macedonia, Montenegro and Benin are underrepresented for (in our opinion) no great reason. As a result, the EM investable universe is actually much broader than represented by the most common benchmark. Additionally, the benchmark has a considerable number of low -spread securities, while also including some from countries that have defaulted. (“Emerging Market Debt: Beyond the Benchmarks,” 5/30/2023)

And it turns out that market selection matters a lot. Wellington Management calculates “spread dispersion” in emerging markets; that is, how much more you can get by investing in one market than in another.  Wellington Management shows that the spread dispersion is at 15-year highs:

(“Emerging markets debt outlook: A glass half full or half empty?” 11/2022)

The Artisan team seeks “idiosyncratic opportunities with compelling risk-adjusted return potential.” The team covers 100 markets but invests with only 40 issuers. Morningstar celebrated Mr. Cirami’s historic success in taking out-of-benchmark positions when they provided compelling opportunities:

Unlike many managers in the emerging-markets local-currency bond Morningstar Category, the team looks beyond the relatively concentrated JPMorgan GBI-EM Global Diversified Index, considering investment opportunities in virtually every emerging country that has capital markets. When the team finds the benchmark countries unattractive, it adds out-of-index positions in sovereigns, typically frontier markets such as Serbia or Ukraine, as well as corporates, while keeping the portfolio’s market sensitivity close to the benchmark’s.

The strategy’s out-of-index exposure has historically provided incremental gain on the upside, like in 2019, and acted as a buffer during tough years, as in 2013 and 2015.

That independence has led to an outstanding short- and long-term track record. In the shortest term, the fund dropped 0.35% in the third quarter of 2023, against a benchmark decline of 2.25%. Since its inception, APFOX has decisively outperformed its peers and near-peers.

Artisan EMD Opportunities is categorized by Lipper as an EM local currency debt fund. The related category is EM hard currency debt, with the difference being whether the debt was issued in the local currency or in US dollars. Dollar-denominated debt tends to be a bit more stable but yields less. Between the two groups, there are 111 funds and ETFs.

Of them, Artisan EMD Opportunities has the strongest record since its inception.

  APFOX Peer ranking
Annualized returns 9.8% #1 out of 111 funds (combined local/hard)
Standard deviation 6.3% #5 in the combined group and #1 in the local currency debt group
Down market deviation 3.1% #2 of 111 and #1 in the local group
Maximum drawdown 2.7% #1 of 111
Sharpe ratio 0.93 #1 of 111
Ulcer Index 1.2 #1 of 111

Source: MFO Premium data calculations and Lipper global data feed

The pattern mirrors the work Mr. Cirami did in managing the multi-billion-dollar Eaton Vance Global Macro Absolute Return, Eaton Vance Global Macro Absolute Return Advantage, and Eaton Vance Emerging Markets Local Income funds.

Bottom Line

Artisan prides itself on its ability to identify, partner with, and support management teams that have the prospect of being “category killers.” They’ve done so with exceptional consistency. For relatively sophisticated investors seeking dedicated exposure to EM debt, Artisan EMD Opportunities is likely to remain among the most compelling options.

Investors interested in Mr. Cirami’s services but wary about pure EMD exposure should investigate Artisan Global Unconstrained Fund, which applies the same discipline but has the freedom to invest across markets worldwide. Both funds have Silver analyst ratings from Morningstar, and both have substantially outperformed their peers since inception.

Searching For Inflection Points

By Charles Lynn Bolin

Jimmy and Rosalynn Carter – Habitat For Humanity. Source: Encyclopædia Britannica

In November, I began volunteering at the Loveland Habitat For Humanity, helping to build houses for those who might not be able to afford them without a hand up. Former President Jimmy Carter and First Lady Rosalynn have volunteered or worked with Habitat For Humanity since the 1980s. Housing prices have roughly doubled in the past ten years putting home ownership out of the reach of many potential buyers. I also volunteer at Neighbor To Neighbor, which helps those on the fringe of homelessness stay sheltered. Pandemic-era savings are expected to be depleted during the first half of 2024, but for many, losing work, even temporarily, can mean eviction, losing utilities, and going hungry. This puts a human perspective on financial metrics.

My target allocation to stock is 50% within a range of 35% to 65% based on my investment model, which loosely follows the guidelines of Warren Buffet’s mentor, Benjamin Graham. Warren Buffet is usually sitting on a pile of cash prior to recessions because he tends to reduce his exposure to stocks when valuations are high. The Motley Fool reported that Warren Buffet was a net seller of stocks during the third quarter, and “Buffett added $29 billion to his position in short-term U.S. Treasury bills last quarter, bringing his total investment to more than $126 billion.” With the recent run up in stocks and my Roth Conversion, my equity allocation has crept up to 40%. I remain overweight in short-term Treasuries and Certificates of Deposit. I have no plans to make any changes until next year when ladders of bonds and certificates of deposit mature.

In this article, I look at the economy, the labor market, and two metrics that highlight inflection points to look for early signs of changes in the markets. I use the Mutual Fund Observer MultiSearch tool to identify funds that are trending now. I am interested in global bond funds and long-duration bond funds as possible additions over the next six months. US equities have done much better than international equities over the past decade in part due to an increase in valuations, stronger dollar, and high monetary stimulus (Quantitative Easing). I look for this to normalize over the coming decade. One fund that caught my attention this month is the emerging markets mixed-asset Fidelity Total Emerging Markets Fund (FTEMX), which is roughly 40% in bonds.

This article is divided into the following sections:

Economy And Recession Watch

Credit keeps the economy going as businesses borrow to expand and consumers borrow to keep spending. The Federal Reserve raises the interest rate that banks charge each other to borrow or lend excess reserves overnight, known as the Federal Funds rate, in order to make borrowing more expensive, thereby slowing down the economy and reducing inflationary pressures. Figure #1 shows that by the time the Federal Reserve starts to lower the Federal Funds rate, a recession often follows.

Figure #1: Federal Funds Rate with Recession Shading

Source: Author Using St. Louis Federal Reserve FRED Database

Figure #2 contains the Philadelphia Federal Reserve Survey of Professional Forecasters estimates for real gross domestic product growth (solid blue line) to be around 0.8% to 1.5% in the first half of next year, and the Reserve Bank of New York estimates for the probability of a recession (solid black line) to be 57% to 68%. The Consumer Price Index (dashed purple line) is currently 3.2%, and the one-year expected inflation rate is 2.8%. Inflation is expected to be “sticky,” and rates will remain “higher for longer.” The chart shows that economic growth will be low and the probability of a recession relatively high. It should be clear by the end of the second quarter of 2024 whether there will be a recession or a “soft landing.”

 Figure #2: Real GDP Growth Forecast and Recession Probabilities

Source: Author Using Philadelphia Fed, Reserve Bank of New York, Consumer Price Index

Figure #3 is my composite of six valuation methods, with +1 being favorable (low valuations) and -1 being unfavorable (high valuations). In my perspective, current high valuations are not justified in a slow growth environment with high bond yields and with the Federal Reserve likely to lower the Federal Funds rate in the second or third quarter of next year.

Figure #3: Author’s Valuation Indicator

Source: Author Using St. Louis Federal Reserve FRED Database

Post Pandemic Consumers

The Federal Reserve Bank of San Francisco, using the Bureau of Economic Analysis, estimates that pandemic-era savings have declined from a high of $2.1T in August 2021 to $430B in September 2023. However, analysis suggests that the bottom 80% of households by income have depleted their pandemic-era savings. Figure #4 is my Consumer Health Indicator which is a composite of ten indicators that suggest how well consumers may be able to continue their current spending habits. The strength of the consumer is not high but has been improving since mid-year.

Figure #4: Author’s Consumer Health Indicator

Source: Author Using St. Louis Federal Reserve FRED Database

Paxtyn Merten listed a detailed description of industries laying off employees in “The 19 Industries Laying Off the Most Workers Right Now” for Stacker. The following industries laid off more than 100,000 employees each in August: 1) Professional and business services, 2) Accommodation and food services, 3) Retail Trade, 4) Health care and social assistance, and 5) Construction, and 6) Transportation, warehousing, and utilities. According to Business Insider, here is a list of some of the companies reducing staff this year: Amazon, Charles Schwab, Roku, Farmers Insurance, T-Mobile, CVS, Binance, Robinhood, Ford, JP Morgan, Morgan Stanley, Spotify, Gap, Jenny Craig, 3M, Lyft, Deloitte, Whole Foods, Ernst & Young, McKinsey, Electronic Arts, Walmart, Sirius, Accenture, Citigroup, General Motors, Yahoo, Twitter, Disney, Zoom, Docusign, eBay, Dell, Rivian, Intel, FedEx, PayPal, IBM, Google, Capital One, Microsoft, Blackrock, Goldman Sachs, BNY Mellon, and Direct TV.

Figure #5 is my composite employment indicator that points to clouds on the horizon for labor. Businesses usually reduce Temporary Help Services and Hours Worked before laying off full-time employees, and these are falling. Growth in persons employed has slowed.

Figure #5: Author’s Employment Indicator

Source: Author Using St. Louis Federal Reserve FRED Database

Inflection Points

I built the Declining Indicator (Figure #6) to measure the percent of months that indicators are negative. It is highly negative, showing that key indicators are either declining or have peaked.

Figure #6: Author’s Declining Indicator

Source: Author Using St. Louis Federal Reserve FRED Database

Figure #7 is my Market Turning Points indicator which composites the values of leading and coincident indicators to give an estimate of major inflection points. While the level is low, it is not negative, suggesting that conditions for a market downturn are not yet fully developed.

Figure #7: Author’s Market Turning Points Indicator

Source: Author Using St. Louis Federal Reserve FRED Database

Review Of Author’s Funds

The funds in Table #1 are those that I currently own in Bucket #1 (Living Expenses) and Bucket #2 (Expected Withdrawal in 3 to 10 years held in multiple accounts), along with fixed income ladders. Vanguard Balanced Index Fund (VBIAX) is included as a baseline. My strategy has been to lock in higher yields in longer-duration bond funds as the Federal Reserve pauses rate hikes. What I would like to add during the next six months is Global/International bond funds and longer-duration bond funds, but the time is not right. I use management services at Fidelity and Vanguard for Bucket #3 (longer-term) funds.

Table #1: Review of Author’s Funds – Metrics for One Year

Source: Created by the Author Using the MFO Premium Multi-search Tool

Grant Park Multi Alternative Strategies (GPANX) has not performed well this year, but it is a good fund with a long-term performance record, so I will keep it. Upon dips, I will add to American Century Avantis All Equity Markets ETF (AVGE), and Columbia Thermostat (COTZX/CTFAX) will increase its allocation to equities.

Trending Lipper Categories

Table #2 contains the top-performing Lipper Categories for the 635 funds that I currently track. The first group of funds is short-term, quality fixed income. The Ulcer Index measures the depth and duration of drawdowns over the past two years, while the Martin Ratio measures the risk-adjusted performance over the past two years. The next group of categories (International bond funds and long-duration Treasuries) are not trending favorably, but I include them to fill gaps in my portfolio. Next are intermediate government and corporate bond funds which have higher duration or quality risk than the first category. Global and international equities have recently tended to perform better than domestic equities.

Table #2: Trending Lipper Categories – Ulcer & Martin Stats – Two Years

Source: Created by the Author Using the MFO Premium Multi-search Tool

Fidelity Total Emerging Markets Fund (FTEMX)

Only a handful of emerging market mixed-asset funds are available to individual investors. One of my criteria for selecting an emerging market fund is to have low exposure to China. Fidelity Total Emerging Markets Fund (FTEMX) has 14% allocated to China, which is below the 22% that most EM funds have. In Table #3, I show two emerging market mixed-asset funds compared to two emerging market equity funds for the past ten years. I am not concerned about the low annualized returns because I expect emerging markets to outperform over the coming decade.

Table #3: Emerging Market Mixed Asset Funds and Selected Equity Funds (10 Years)

Source: Created by the Author Using the MFO Premium Multi-search Tool

Figure #8 is a graphical representation of the above funds. Emerging market mixed-asset funds have performed well over the past decade until interest rates went up. I will monitor FTEMX with interest but have no plans to purchase it in the near term.

Figure #8: Emerging Market Mixed Asset Funds and Selected Equity Funds

Source: Created by the Author Using the MFO Premium Multi-search Tool

Closing Thoughts

I like the prospects for bonds relative to stocks in the intermediate time horizon. In November, I sold Allianz PIMCO TRENDS Managed Futures Strategy (PQTAX) and bought Fidelity Investment Grade (FBNDX), which is an intermediate duration fund with 39% Treasuries and 31% corporate bonds. Over the next six months, I expect to add Global/International bond funds and/or a quality long-term bond fund.

I created a long-term financial plan that includes Roth Conversions and accelerated withdrawals to minimize long-term taxes and increase the tax efficiency of estate plans. In July, I set up an appointment to do a Roth Conversion on October 27th, expecting the markets to go down. I was fortunate that the S&P 500 fell roughly ten percent, allowing me to convert more shares for the same conversion amount. The market then recovered. I plan to do another Roth Conversion in mid-2024 if the market dips as I expect.

Hiring Fidelity and Vanguard to manage my long-term investment bucket(s) freed up my time to pursue other interests. I enjoy volunteering and giving back to the community. I am learning a lot and meeting a lot of interesting volunteers.

Briefly Noted…

By TheShadow

Updates

BenWP, a member of MFO’s discussion community, contributed that the Capital Group has several new equity and fixed-income ETFs.  One of the newest ETFs is the Capital Group Core Balanced ETF, an active multi-asset ETF. Some of the other active equity ETFs are the Capital Group International Equity ETF, Capital Group International Focus Equity ETF, Capital Group Dividend Growers ETF, Capital Group Dividend Value ETF, Capital Group Global Growth Equity ETF, Capital Group Core Equity ETF, and Capital Group Growth ETF. The Capital Group has several new fixed-income ETFs: Capital Group Core Bond ETF, Capital Group Core Plus Income ETF, Capital Group Short Duration Income ETF, and Capital Group U.S. Multi-Sector Income ETF. There are two municipal ETFs: Capital Group Municipal Income ETF and the Capital Group Short Duration Municipal Income ETF.

Fidelity will convert the following mutual funds, according to an SEC filing:  

  • International Enhanced Index Fund (FIENX) will become Enhanced International ETF 
  • Large Cap Core Enhanced Index Fund (FLCEX) will become Enhanced Large Cap Core ETF 
  • Large Cap Growth Enhanced Index Fund (FLGEX) will become Enhanced Large Cap Growth ETF 
  • Large Cap Value Enhanced Index Fund (FLVEX) will become Enhanced Large Cap Value ETF 
  • Mid Cap Enhanced Index Fund (FMEIX) will become Enhanced Mid Cap ETF 
  • Small Cap Enhanced Index Fund (FCPEX) will become Enhanced Small Cap ETF. 

The ETFs will retain their investment objectives and the management of their actively indexed funds. Their related ETF expenses will be significantly less than their mutual fund counterparts. The ETFs will continue to be managed by Anna Lester, Max Kaufmann, and Shashi Naik.

On the whole, the funds have been solid since inception. The chart below reflects performance relative to their Lipper peers on a variety of measures of return, volatility, and risk-adjusted returns. Make it easy on yourself: Blue is high, Green is above average, Yellow is roughly average. You would worry if you saw a lot of orange and red, but you don’t.

All data and ratings are generated at MFO Premium (the web’s best fund analyzer for those with a little knowledge of numbers and a reluctance to share $15,000 for access to The Big Boy’s Toy).

Vanguard International Dividend Growth Fund held a subscription period from November 1, 2023, through November 14, 2023. During this period, the Fund invested in money market instruments or cash rather than seeking to achieve its investment objective. This strategy should allow the Fund to accumulate sufficient assets to construct a complete portfolio and is expected to reduce initial trading costs.

SMALL WINS FOR INVESTORS

Southeastern Asset Management has lowered its expense fees on its Longleaf Partners International and Longleaf Partners Global Funds.  Both funds’ expense caps have been reduced from 1.15% to 1.05%, effective November 1, 2023, through at least April 30, 2025.

CLOSINGS (and related inconveniences)

American Beacon FEAC Floating Rate Income Fund, investor share class, will be reorganized into the A share class effective the close of business on December 29. This fund was formerly the Shore Point Floating Rate Income Fund which was reorganized into American Beacon Funds around December 15, 2015The fund is currently rated two stars by Morningstar.

The Angel Oak High Yield Opportunities and the Angel Oak Total Return Bond Funds have closed their class A shares to new and existing investors effectively immediately on November 8.

PIMCO is liquidating the Administrative Class of PIMCO Global Bond Opportunities Fund (U.S. Dollar-Hedged) on or about March 15, 2024.

OLD WINE, NEW BOTTLES

Allspring C&B Large Cap Value Fund will become Allspring Large Cap Value Fund on or about March 4, 2024. Allspring is the former Wells Fargo Asset Management, which was bought by two private equity funds and rebranded. And, as it turns out, being subjected to a year-end housecleaning. The adviser posted a dozen change announcements to the SEC on a single day. We note, below, the liquidation of their target-date funds. If you’re an Allspring fundholder (a) why? and (b) check your email because there’s a pretty good chance that your fund has been renamed, repurposed, liquidated, or otherwise buffed.

Effective as of March 1, 2024, the name of ClearBridge Value Trust will be changed to ClearBridge Value Fund.

Neuberger Berman U.S. Equity Index PutWrite Strategy Fund becomes the newly-created Neuberger Berman Option Strategy ETF on January 26, 2024. That turns out to be a surprisingly complicated venture. The “A” and “C” shares already rolled into “Institutional.” On January 11, “R6” shares will merge into Institutional. January 19, Neuberger engineers a reverse share split to raise the fund’s NAV. On January 26, the firm cashes out any fractional shares, then converts the fund to an ETF will every shareholder receiving a whole number of shares.

The Roundhill BIG Tech ETF has been renamed Roundhill Magnificent Seven ETF. No change in strategy (buy Amazon, Apple, Facebook, Google, Microsoft, Nvidia, Tesla), but the ticker did transition from BIGT to MAGS. Because, why not declare yourself a slave to named market darlings? Look how well that worked in 2000 when “El Siete Magníficos” would have been Microsoft (hi, Bill), GE, Cisco, Intel, NTT, Nokia, and Lucent. So here is Intel’s price chart:

Hmmm … well, if you had bought this early Magnificent Seven stock at its $41/share peak in 2000, you would have been subject to some short-term repricing (say an 80% loss in the following two years), but you would have roared back to your $41 purchase price … 18 years later. Followed by a surge and another downward adjustment so that the current share price remains about 25% below its 2000 level.

So, stock up on the Magnificent Seven. What’s the worst that could happen?

Virtus Newfleet High Yield Bond ETF became Virtus Newfleet Short Duration High Yield Bond ETF on November 28, 2023.

OFF TO THE DUSTBIN OF HISTORY

In case you’re wondering about the target date for the Allspring (fka Wells Fargo) Target-Date funds, it is December 29, 2023. On that date, Allspring Dynamic Target Today Fund, plus all of its Dynamic Target date siblings, will be liquidated.

In addition, Allspring is merging away for other fours in February 2024.

Target Fund Acquiring Fund
Allspring C&B Mid Cap Value Fund Allspring Special Mid Cap Value Fund
Allspring Growth Balanced Fund Allspring Asset Allocation Fund
Allspring Moderate Balanced Fund Allspring Spectrum Moderate Growth Fund
Allspring Small Cap Fund Allspring Small Company Value Fund

The tiny B.A.D. ETF (well-earned ticker: BAD) was liquidated on November 23, 2023. It was a bad attempt to replicate earlier “sin” funds, such as the Vice Fund and Morgan FunShares, which invested exclusively in socially sanctioned industries. In this case, Betting, Alcohol, and Drugs (or, at least, Canadian cannabis stocks). Two managers, neither of whom committed a penny of their own wealth to the enterprise. Which is good for them since the fund ended life at a loss-since-inception.

Beech Hill Total Return Fund will be liquidated on December 4, 2023.

The Causeway Concentrated Equity Fund will be liquidated on or about December 14.

Clouty Tune ETF was liquidated on November 26, 2023. (Every time I see the name, my brain substitutes Clayton Tune – a hapless quarterback for the Arizona Cardinals whose total quarterback rating, on a scale of 1 to 100, is 1.5 – ETF for it.) The fund opened in June 2023 with what appears to be a seed investment of $500,000. The fund now has … well, under $500,000 in assets and, in the 21st century, five months is more than enough time to become Insta-famous or flameout so …

The Energy & Minerals Group EV, Solar & Battery Materials (Lithium, Nickel, Copper, Cobalt) Futures Strategy ETF (CHRG) has lost its charge and will be liquidated on December 15, 2023. We are now on the lookout for a new contender to the title “pointless fund with the longest name.” The decedent clocked in at 17 words.

iShares Factors US Value Style ETF, iShares Currency Hedged MSCI Canada ETF, iShares Currency Hedged MSCI United Kingdom ETF, and iShares MSCI Germany Small-Cap ETF were liquidated effective November 2, 2023.

The Jacob Internet Fund, institutional share class, was liquidated on or about November 17.

JPMorgan Social Advancement ETF and JPMorgan Sustainable Consumption ETF are the latest victims of “green flight” and will be liquidated and dissolved on the day after Christmas in 2023. (Fa-la-la-la-la!)

JPMorgan Tax Aware Equity Fund will be liquidated on or about December 19 due to it sustaining significant outflows during the past year

The Kelly Hotel & Lodging Sector ETF (HOTL) will be liquidated on or about December 8.

The Loomis Sayles Credit Income Fund was liquidated on November 6.

After careful consideration and at the recommendation of Roundhill Financial Inc., the investment adviser to the Roundhill BIG Bank ETF, Roundhill MEME ETF, and Roundhill IO Digital Infrastructure ETF will close and liquidate on December 14, 2023.

On October 31, 2023, Pear Tree Axiom Emerging Markets World Equity Fund merged into Pear Tree Polaris International Opportunities Fund.

Sanford Bernstein Short Duration Plus Portfolio and Short Duration Diversified Municipal Portfolio will make a “liquidating distribution” on or shortly after January 26, 2024. (The visual image of what “distribution” one makes as one is being liquidated is … striking.)

The Virtus Duff & Phelps International Real Estate Securities, Virtus Stone Harbor Emerging Markets Debt Allocation, Virtus Stone Harbor High Yield Bond, and Virtus Stone Harbor Strategic Income Funds will be liquidated on or about December 13, 2023. 

The SGI U.S. Small Cap Equity Fund will be liquidated on or about December 28.

The tiny and consistently underperforming Sterling Capital SMID Opportunities Fund merges into small and inconsistent Sterling Capital Mid Value Fund on or about January 26, 2024.

Utah Focus Fund had all the markers of an upcoming wreck: weird, narrow focus, managers who had no fund management experience and who wouldn’t invest in the fund, high expenses … wisely no one else would invest in it either, so it’s 15% loss over its first 11 months of operation hurt few and its pre-Christmas liquidation will close the book.

Virtus Funds will reorganize its Virtus Seix High Income and Virtus Seix Ultra-Short Bond Fund into Virtus Seix High Yield and Virtus Seix U.S. Government Securities Ultra-Short Bond Fund, respectively.  The reorganizations are expected to occur on or about February 23, 2024.  

Wildermuth Fund is making its liquidation look more than real. Effective November 1, 2023, Wildermuth Advisory, LLC was terminated adviser to the Fund. Daniel Wildermuth and Carol Wildermuth each resigned from the Board of Trustees. Daniel Wildermuth also resigned as Chairman of the Board. Daniel and Carol Wildermuth also resigned from their positions as officers of the Fund, including Daniel’s resignation as portfolio manager.

They’ve been succeeded by BW Asset Management Ltd, a sort of undertaker for condemned funds which has overseen the liquidation of over $1 billion in assets. Currently, they’re providing end-of-life / beginning-of-death services for a Mauritius-regulated fund with $110 million AUM; five private funds under voluntary liquidation with combined assets of $120 million; and “various funds in provisional or official liquidation with combined assets of $300 million.”

Shadow

Briefly Noted . . .

FPA Funds has registered the FPA Global Fund and the FPA Global ETF. Total annual expenses will be .49% for the ETF; expenses have not been stated for the FPA Global Fund.

Steven Romick, CFA, Managing Partner of the Adviser; Mark Landecker, CFA, Partner of the Adviser; and Brian A. Selmo, CFA, Partner of the Adviser, serve as portfolio managers of the Fund and of the ETF (and its predecessor fund inception in December 2021).  

T Rowe Price has filed a registration filing for its Hedged Equity Fund for Investor, I, and Z class shares to become available on November 8. Total annual fund operating expenses for the Investor class will be .58%.  The fund normally invests at least 80% of its net assets (including any borrowings for investment purposes) in equity securities and derivatives that have similar economic characteristics to equity securities or the equity markets. The fund may purchase the stocks of companies of any size and invest in any type of equity security, but its focus will typically be on common stocks of large-cap U.S. companies. Sean P. McWilliams will be the portfolio manager.