Monthly Archives: March 2024

March 1, 2024

By David Snowball

Dear friends,

In like a lion, out like a lamb? The Total Stock Market Index has risen 12% in the past three months, as has the S&P 500. Nvidia stock is up 76% in the same period while semiconductor stocks inched up … 48%.

The thermometer in Davenport today topped 76 degrees, just a bit warm for a late winter day. We heard that participants in the March 1st Polar Plunges at locations across the upper Midwest had to be treated for heat stroke.

We live in interesting times. The one thing likeliest to help us through them is the support we offer one another, and our joint optimism that we can make it work!

In this month’s Mutual Fund Observer

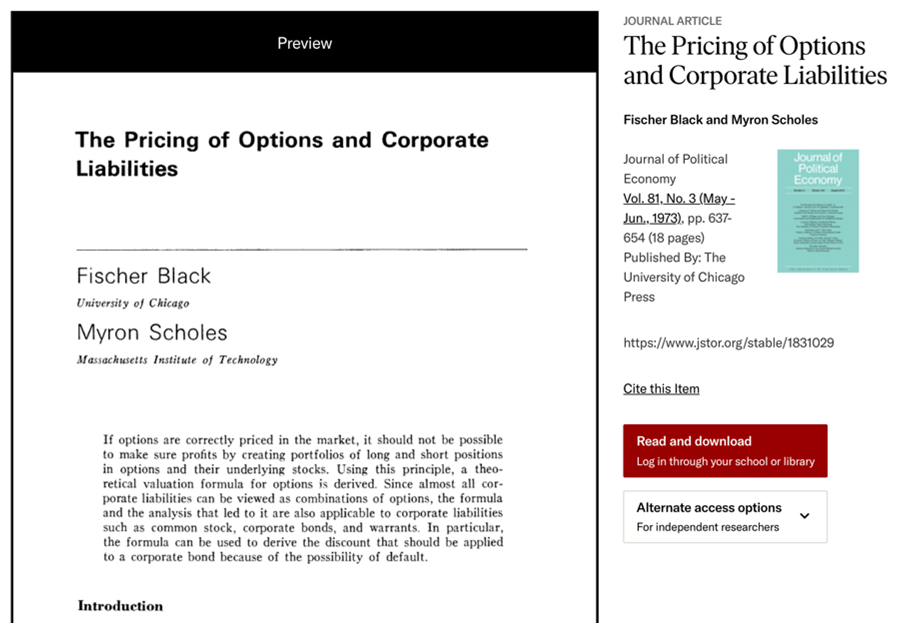
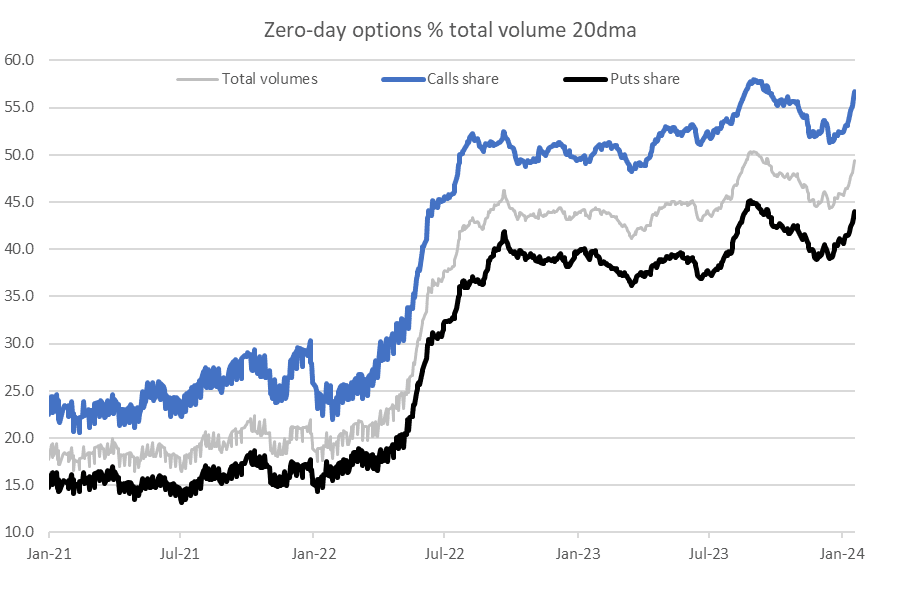
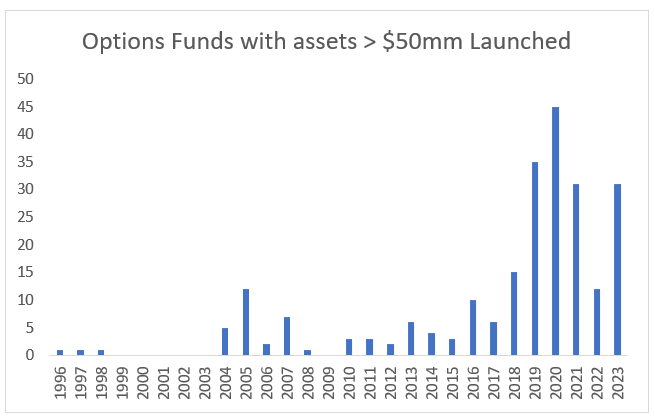
Investors seem mesmerized by the potential for stock options, and so-called Zero Day options in particular, to perform the feat that never has been (spoiler: and never will be) done before: magically deliver the stock market’s gains with little of its pains. Money is rushing in a torrent toward such investments. Our colleague Devesh Shah, who dead asleep knows more about options than any of the rest of us do wide awake, takes us on a tour of the options industry and its manifestation in funds and ETFs.

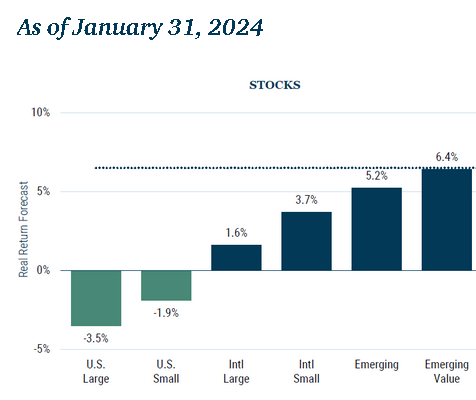
GMO releases monthly its seven-year asset class forecast. In the wake of The Great Distortion (2008-2023), their forecast has become a reliable contrarian indicator; their first shall be last and their last shall be first, so to speak. That masks the fact that their work was remarkably accurate up until the era of zero-to-negative real interest rates and unbounded Fed creativity in propping up financial markets. How many people remember the emergency intervention in the overnight repo markets in 2021, where the Fed provided trillions of liquidity when the financial sector refused to, much less the fact that the Fed continued providing over a trillion until November 2023? If interest rates and Fed behavior return to their pre-2008 “normal,” GMO’s projections might suddenly become surprisingly valuable. I examine the argument, share the latest projection, and suggest six strategies and twelve funds that might be worth looking at … soon.

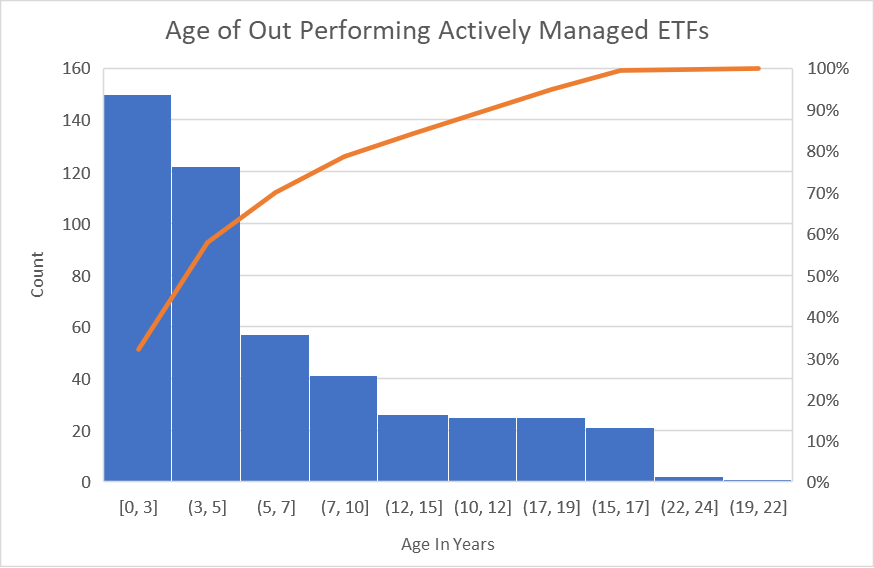
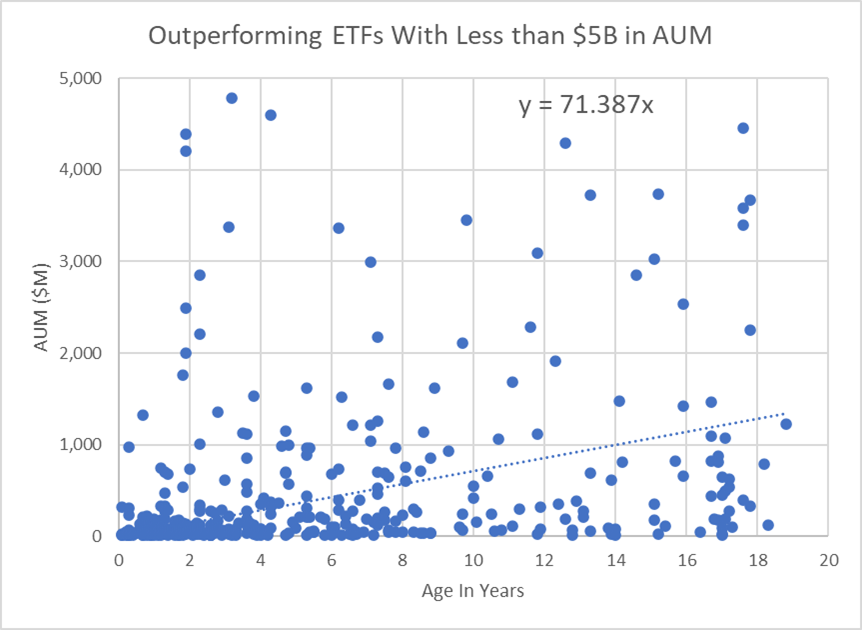
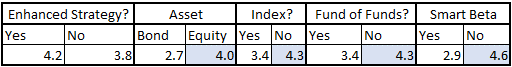
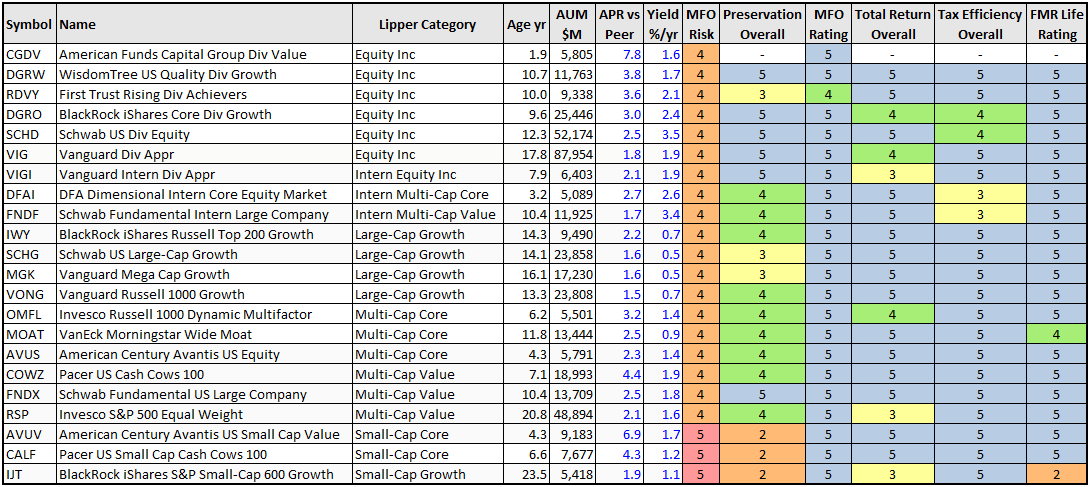
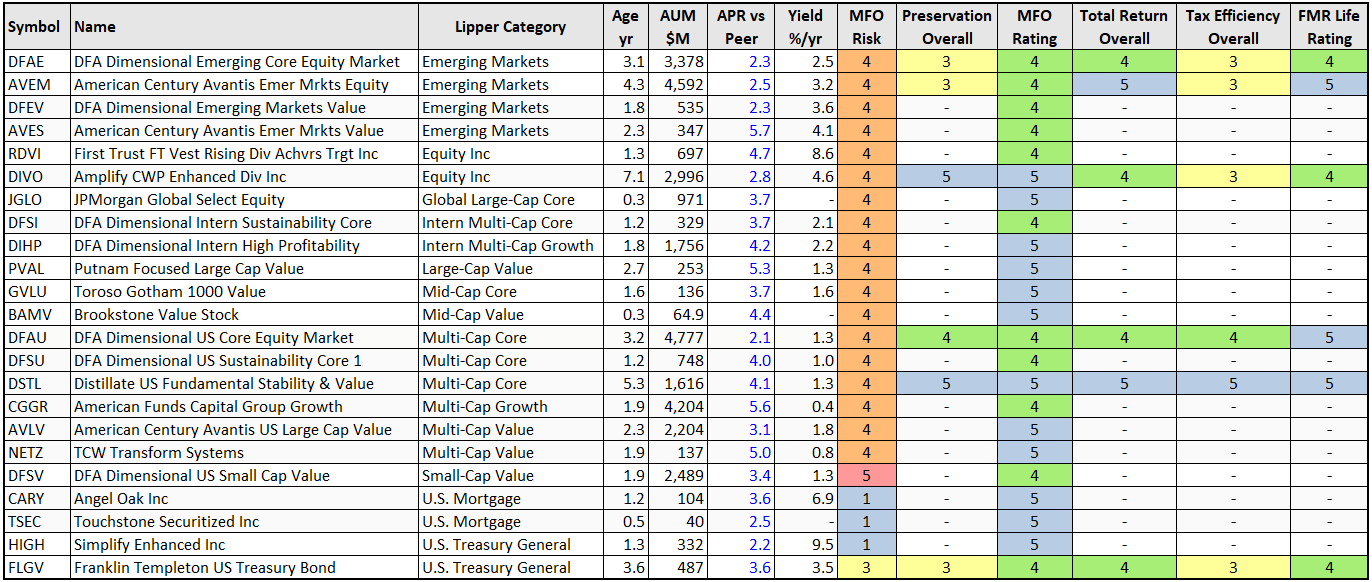
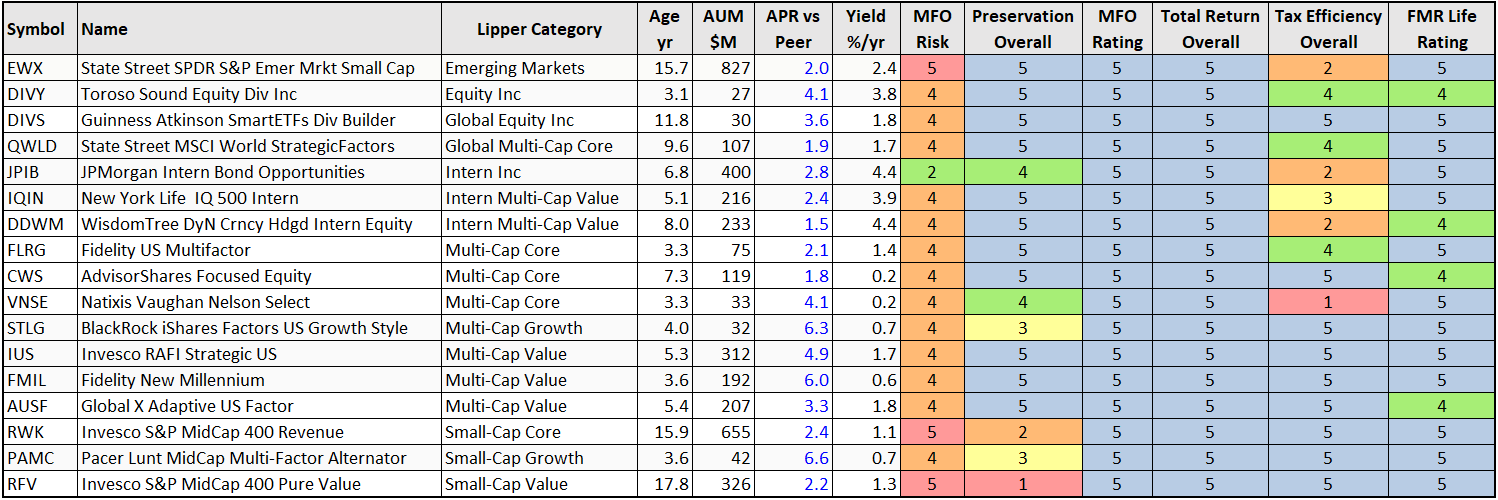
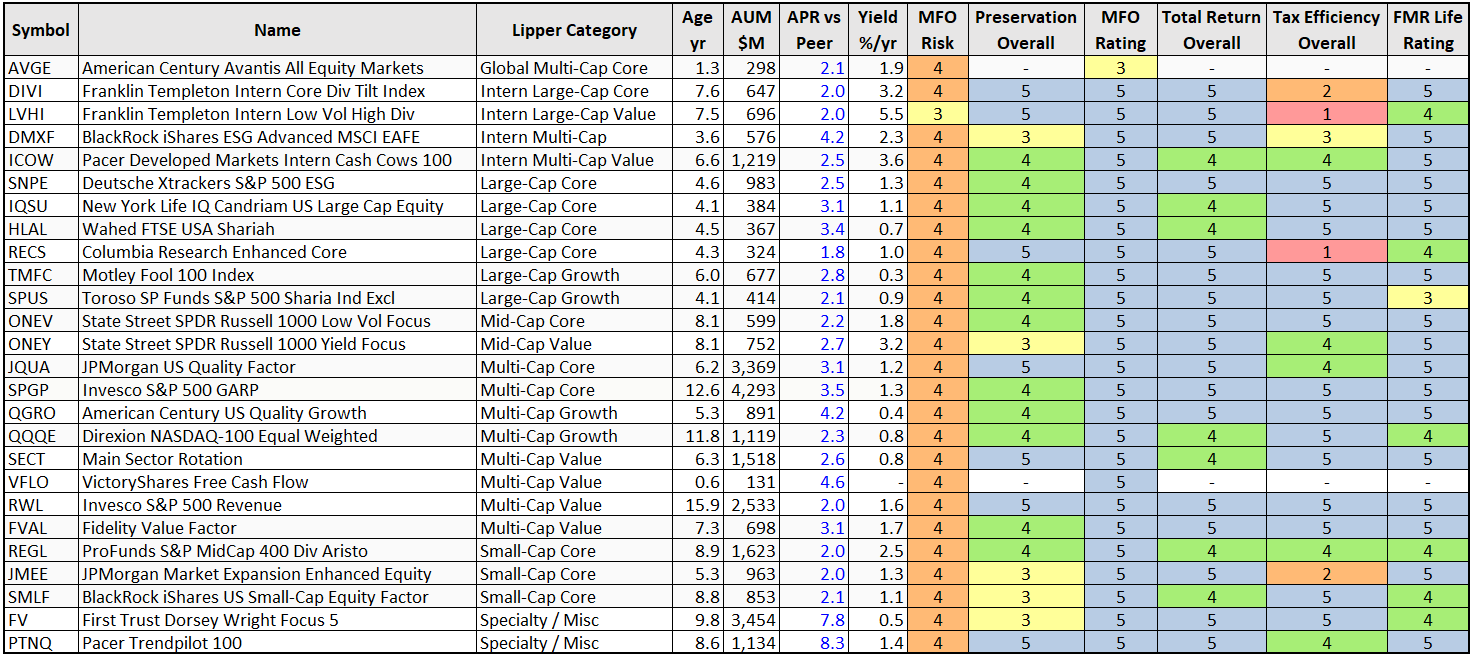
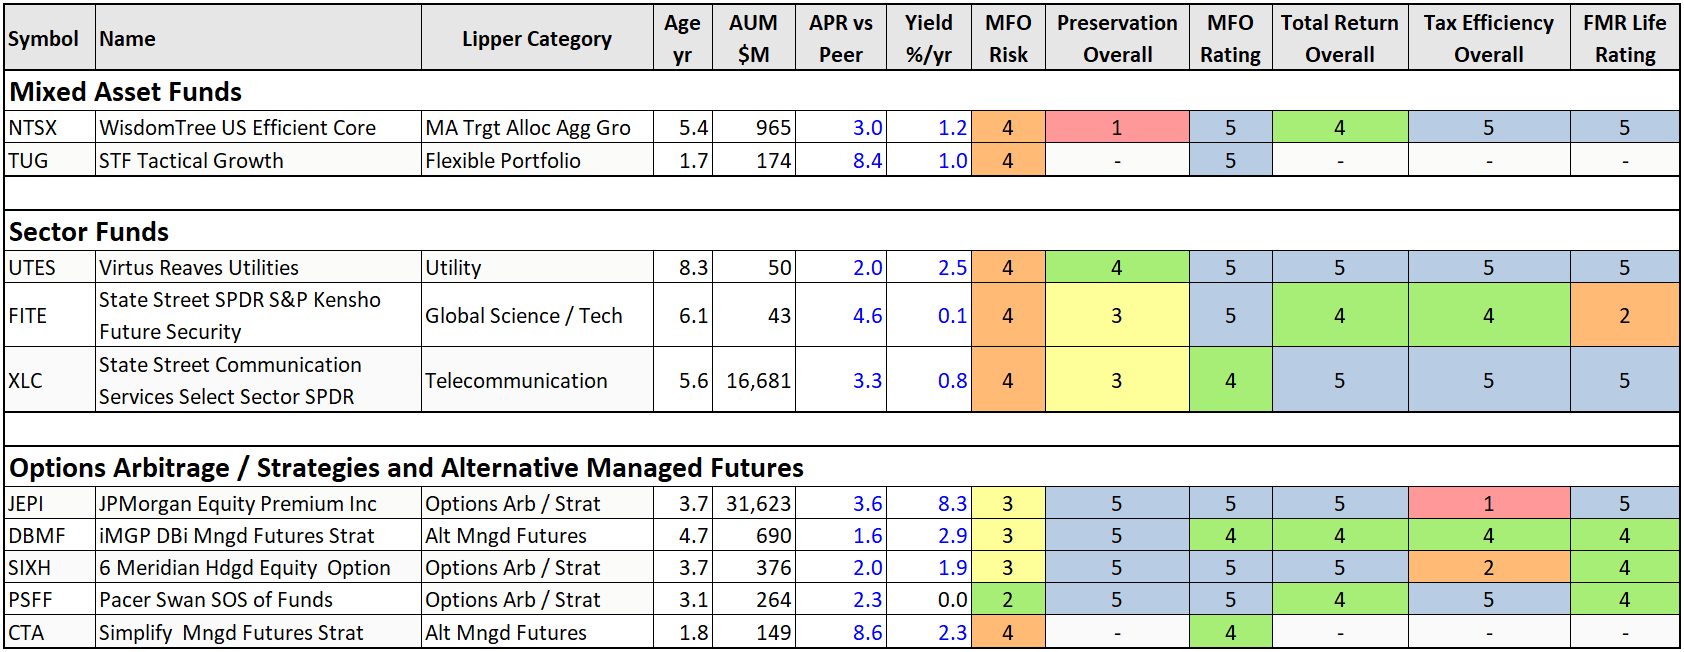
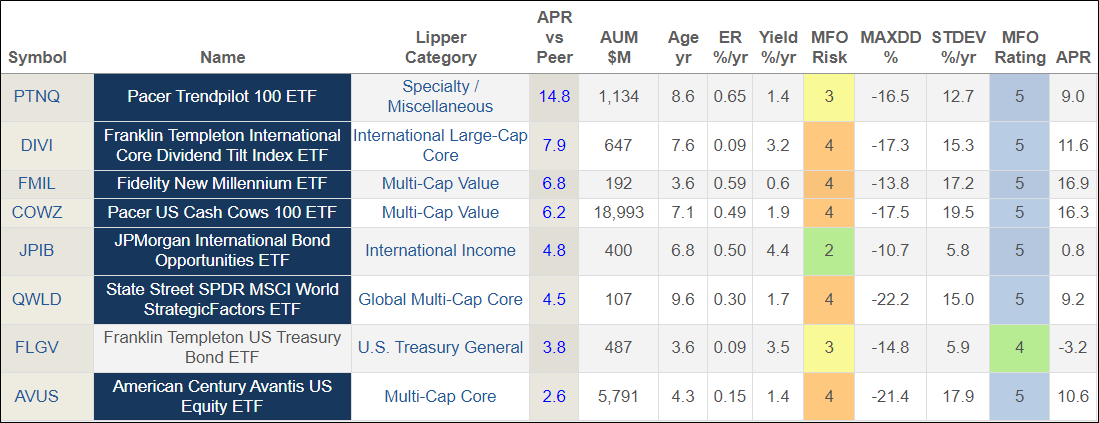
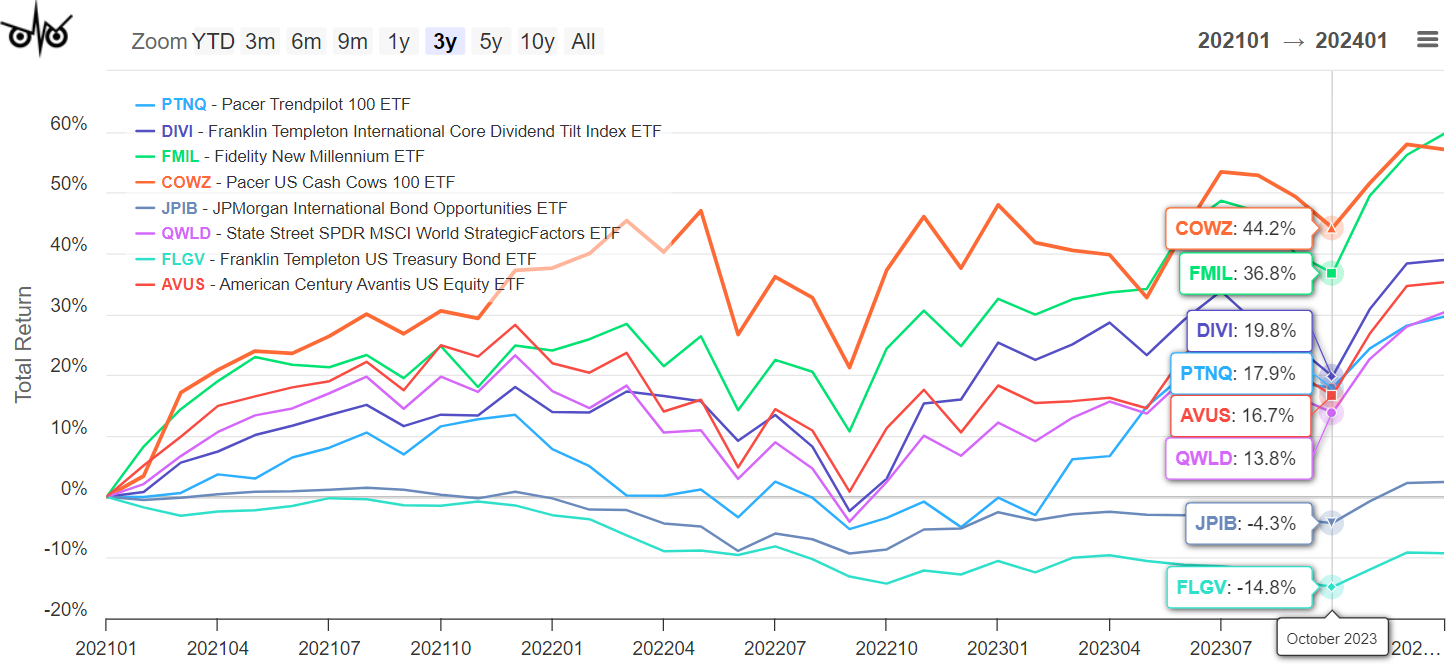
Most active fund strategies would probably benefit from being teleported into active ETFs, which tend to have both structural cost and tax advantages and a major PR advantage. While they’re gaining in popularity, they remain a surprisingly small niche. Lynn Bolin goes behind the curtains to identify the best – in terms of performance and persistence – and discusses their integration into a portfolio.

Investors all love the idea of winning big, a single dramatic bet paying off Las Vegas style. (“If you’d invested $10,000 in Nvidia five years ago, you’d have $200,330 today!” Which misses the fact that you didn’t invest in Nvidia; you bought a cannabis ETF and Beyond Meat stock.) The impulse toward “next big thing” investing is captured in funds that specialize in investing in “disruptors.” For the benefit of those tempted, we look at the relative fortunes of two classes of funds: those claiming to be “disciplined” and those claiming to be “disruptive.”

The Shadow catches us up with industry news in Briefly Noted, but also highlights serious concerns around one news item. The assets in passive strategies have now surpassed active ones. The foolish response is a kneejerk: “Well, good! Passive is cheaper and better.” The more thoughtful response is “Hmm… passive works as a free rider on the efforts of active managers to maintain some market discipline. But what happens if there are too few active managers to maintain that discipline?”

Slippery when elevated

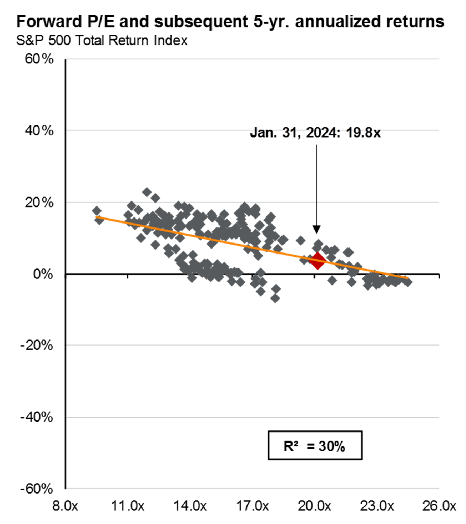
In the past six years, the market has crashed three times: down 20%(2018), 34% (2020) and 34% (2022). Despite that, by measures such as the Shiller CAPE, we remain in one of the three most expensive markets in the past 150 years. Doug Ramsey Chief Investment Officer & Portfolio Manager at Leuthold Management reminds us,

… elevated valuations make the stock market more “accident prone,” and recent years (while positive on a net basis) certainly illustrate this. Consider that the last 5-1/2 years have seen three “major declines” in the S&P 500 (and significantly deeper losses for other indexes), despite the economy having been in recession for just two months out of that entire span. (P/E Multiples Still Matter, 2/7/2024)

By his calculation, the 2022 bear market ended at valuations higher than the peak of almost any bull market before it.

All great organizations have one thing in common

Over 40 years, I’ve built a lot of high-functioning programs and have studied a lot more. One factor, more than any other, distinguishes programs on a sustained upward path from those swirling around the toilet.

The leadership in high-functioning programs isn’t threatened by the success of others; they’re secure in the knowledge of their own abilities enjoy challenges and look to hire people better than themselves.

The leadership in low-functioning programs dwells in existential terror; they strut around a lot while wrought with angst, they’re afraid of being shown up and look to hire people who don’t threaten them.

Academic departments of speech or communication are generally not seen as being among a university’s elite units. “Home to the football team and the cheer squad” is the stigma. And yet at Augustana, one wannabe kingmaker’s plaintive query was, “Why does everything here run through the communication department?” We provided more Deans of the College, associate deans, division heads, senate chairs, council presidents, and program initiatives than any other academic program. That reflected a single impulse: we were relentless in pursuing new hires who were way better than we were, and adamant that we would rather find a one-year patch than hire someone who didn’t excite us.

As the longest-serving member of the department, I’m also, almost by definition, its weakest link since I’ve only been willing to hire people better than me and then people better than the ones we’d just hired.

It’s scary and exhausting, humbling and infinitely worthwhile.

All of which came to mind as I read Warren Buffett’s encomium to Charles Munger. It speaks to a profound humility, and a joyful embrace of a challenging hire, on Mr. Buffett’s part. It occupies the opening page of Buffett’s annual letter to shareholders. I’d like to quote a chunk of it for you.

Charlie Munger died on November 28, just 33 days before his 100th birthday.

Though born and raised in Omaha, he spent 80% of his life domiciled elsewhere. Consequently, it was not until 1959 when he was 35 that I first met him.

In 1962, he decided that he should take up money management. Three years later he told me – correctly! – that I had made a dumb decision in buying control of Berkshire. But, he assured me, since I had already made the move, he would tell me how to correct my mistake.

In what I next relate, bear in mind that Charlie and his family did not have a dime invested in the small investing partnership that I was then managing and whose money I had used for the Berkshire purchase. Moreover, neither of us expected that Charlie would ever own a share of Berkshire stock.

Nevertheless, Charlie, in 1965, promptly advised me: “Warren, forget about ever buying another company like Berkshire. But now that you control Berkshire, add to it wonderful businesses purchased at fair prices and give up buying fair businesses at wonderful prices. In other words, abandon everything you learned from your hero, Ben Graham. It works but only when practiced at small scale.” With much backsliding I subsequently followed his instructions.

Many years later, Charlie became my partner in running Berkshire and, repeatedly, jerked me back to sanity when my old habits surfaced. Until his death, he continued in this role and together we, along with those who early on invested with us, ended up far better off than Charlie and I had ever dreamed possible.

In reality, Charlie was the “architect” of the present Berkshire, and I acted as the “general contractor” to carry out the day-by-day construction of his vision.

Charlie never sought to take credit for his role as creator but instead let me take the bows and receive the accolades. In a way his relationship with me was part older brother, part loving father. Even when he knew he was right, he gave me the reins, and when I blundered he never – never –reminded me of my mistake.

About halfway through his long letter, Mr. Buffett makes a passionate promise that I suspect few of the quazillionaires in his circle would echo:

I believe Berkshire can handle financial disasters of a magnitude beyond any heretofore experienced. This ability is one we will not relinquish. When economic upsets occur, as they will, Berkshire’s goal will be to function as an asset to the country – just as it was in a very minor way in 2008-9 – and to help extinguish the financial fire rather than to be among the many companies that, inadvertently or otherwise, ignited the conflagration.

Our goal is realistic. Berkshire’s strength comes from its Niagara of diverse earnings … We also operate with minimal requirements for cash, even if the country encounters a prolonged period of global economic weakness, fear and near paralysis.

Your company also holds a cash and U.S. Treasury bill position far in excess of what conventional wisdom deems necessary. During the 2008 panic, Berkshire generated cash from operations and did not rely in any manner on commercial paper, bank lines or debt markets. We did not predict the time of an economic paralysis but we were always prepared for one.

Extreme fiscal conservatism is a corporate pledge we make to those who have joined us in ownership of Berkshire. In most years – indeed in most decades – our caution will likely prove to be unneeded behavior – akin to an insurance policy on a fortress-like building thought to be fireproof. But Berkshire does not want to inflict permanent financial damage – quotational shrinkage for extended periods can’t be avoided – on Bertie or any of the individuals who have trusted us with their savings.

Berkshire is built to last.

We are richer for the work, and standards, of such people. Would that there be more of them.

Speaking of Berkshire Hathaway … wow.

Professor Emerita Ruth Gottesman just changed the lives of thousands. Dr. Gottesman donated a billion dollars to the Albert Einstein College of Medicine. The college is located in one of the most impoverished parts of the city and the state of New York. Her gift quadruples the size of the college’s endowment. The school immediately announced its decision to eliminate tuition for all students. A medical newsletter walked through the implications of the gift: “This gesture is set to liberate future physicians from the daunting average medical school debt of $202,453 in the U.S., allowing them to pursue their careers unencumbered by financial strain.”

It will also increase the likelihood that smart kids who could never otherwise consider med school – first-generation college students, the children of immigrants, and the impoverished among them – might become the sort of doctors who transform communities.

NPR described her gift as “one of the largest charitable donations to an educational institution in the United States and most likely the largest to a medical school.”

The driver of the gift was her husband’s investment in Berkshire Hathaway. David Gottesman founded First Manhattan Corporation (FMC, one of whose funds we profiled), was an early investor in Berkshire Hathaway, and a partner of Mr. Buffett’s on several projects. Mr. Gottesman is described by Fortune Magazine as “a friend of Buffett for six decades, and his early investments in Berkshire Hathaway Inc. gave him a net worth of almost $3 billion as of mid-2022, according to the Bloomberg Billionaires Index.”

A quick growl at the world’s stupidest charitable contribution

Giving money to Harvard’s endowment. It’s absolutely idiotic and irresponsible. Harvard’s endowment is over $53 billion. That’s bigger than the GDP of 120 nations (CBS, 12/23/2023) and it is piling up relentlessly. It translates to an endowment of over $2.1 million per student. At a 4% draw, that’s enough for Harvard to eliminate entirely the $80,000 a year it charges.

But that’s not the way Harvard manages its budget. In consequence, it opens itself up to blackmail from rich alumni who threaten to withhold additional billions if the university doesn’t align itself with their political preferences. (Which, by the way, they have every right and reason to do.)

If there’s a “charity case” less compelling than helping Harvard build toward its 54th billion, I haven’t seen it.

And if you want to make a difference, go support the schools that support bright kids who might not otherwise make it, whether that’s the Albert Einstein College of Medicine or your local community colleges.

Morningstar recognizes top female fund managers

In celebration of International Women’s Day, Morningstar highlighted the work of 30 distinguished female fund managers. Traditionally, women have been badly underrepresented as both professional managers and individual investors (the industry assumed it just needed to confer with “the man of the house”), so we celebrate the effort.

Below is the list of managers in equity-oriented strategies. For the fixed-asset and allocation honorees, follow the link to Morningstar’s site.

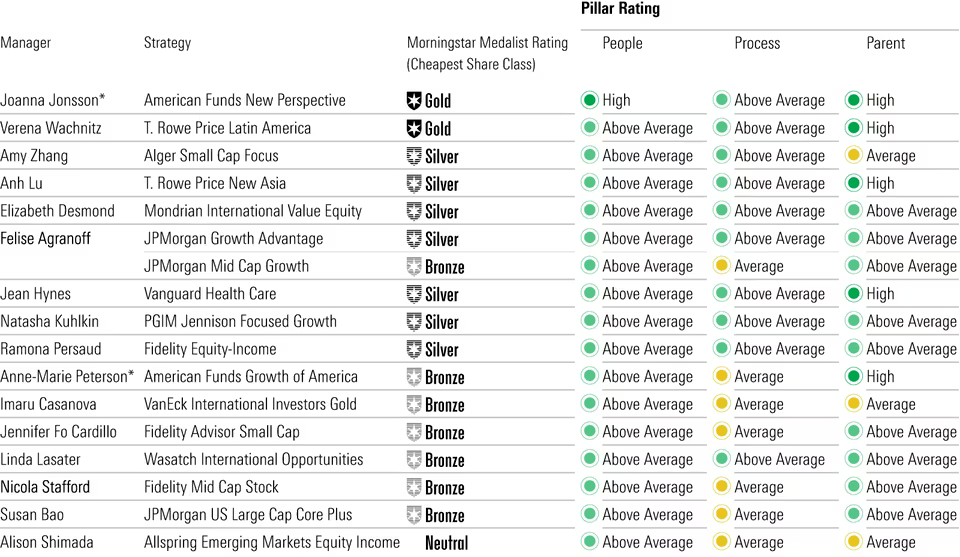
Source: Morningstar.com

The New Trillionaires

Knight Frank, a British real estate “consultancy” founded in 1896 has begun leaking to the media (the New York Times rather more than us) snippets from an upcoming report on intergenerational wealth transfer.  Knight Frank estimates that a stunning $90 trillion is at play:

Over the next decade or so, a massive transfer of wealth and assets will occur as the silent generation and baby boomers hand over the reins to millennials. The shift will see US$90 trillion of assets move between generations in the US alone, making affluent millennials the richest generation in history.

One impact will come in how financial products are packaged and sold, but a more consequential one would flow from the very different levels of climate-related awareness and anxiety between younger and older investors.

The generational differences in investing strategies will vary, but climate change is just one example through which capital will be redirected. Looking solely at the top-line question on carbon emissions from our main Attitudes Survey of wealthy individuals and their advisors, millennials appear to have got the message when it comes to cutting consumption – 80% of male and 79% of female respondents say they are trying to shrink their carbon footprints. Male boomers take a different view, with just 59% trying to reduce their impact, well below their female peers (67%).

Those impending changes make the industry’s ongoing Green Flight more galling. Sustainability commitments that were too often the product of marketing calculations are crumbling under reactionary ire. The New York Times concludes, “Now, Wall Street has flip-flopped” (2/20/24) and they share a considerable list to support the conclusion. The most recent retreat was “JPMorgan, State Street, and Pimco have recently withdrawn from Climate Action 100+, a key international coalition aimed at pushing corporations toward greener practices.” (“Wall Street Firms Retreat from Climate Commitments Amid Growing Pressures,” One Green Planet, 2/2024). Their reasoning? The climate group “had gone too far.”

Young citizens, on the cusp of inheriting trillions, might reasonably ask, “What the very F does that even mean? They haven’t done anything!”

Two modest portfolio updates

In December, we profiled the newly launched GMO US Quality ETF (QLTY). In February, Chip added it to her portfolio.

In February, consistent with a plan that I discussed in my annual portfolio review, I increased my investments in both Leuthold Core and RiverPark Strategic Income.  Irked as I am by the fact that the savings account at my bank pays 0.01% on all deposits – not to brag, but I pulled down well over $1.30 in interest last year – I’m in the process of shifting a chunk of it to David Sherman’s more conservative fund, RiverPark Short Term High Yield. Over the 13 years since its inception, David’s fund has the highest Sharpe ratio of any fund in existence: 2.52. To put this in perspective, that’s two and a half times greater than the next-best fund there is. The fund has averaged a 3.1% annual return; its lowest return in any 12 months was 0.6%. Its worst 12-month return is roughly 60X what Old National Bank has on offer, so …

Thanks, as always …

Thanks to the good folks at Gardey Financial and to Mark from Pennsylvania. (Hi, Mark! And thanks for the note. I, too, suspect that Lynn could probably muddle along pretty durn successfully without the help of a paid financial advisor. He’s really smart, but also smart enough to know his limits. I’m apt to leave full-time teaching after another year and I need to have a serious sit-down talk with one of the TIAA-CREF advisors out in Iowa City before I do. If I hear anything surprising, I’ll share.)

And, as ever, our Faithful Regulars:  S & F Investment Advisors, Gregory, William, the other William, Stephen, Brian, David, and Doug.

As ever,

david's signature

Overview of recent trends in the Options market

By Devesh Shah

Options – the hottest ticket in town

In the 4th Quarter of 2023, for the first time, the daily volume of Options traded in the US eclipsed the daily volume of Futures traded. Options are now the #2 product behind Stocks by volume.

There are two particular phenomena drawing our attention – Zero Day Options and Option Strategies embedded in Mutual Funds and ETFs.

Some investors might want to get just a rudimentary understanding of Options and recent products, while others might want a deeper dive. I have written two columns.

In this month’s column, we’ll take up three major topics:

  1. An introduction to options and their role in the market
  2. The market’s latest passion; so-called Zero Day Options, a mania in the US and India, and
  3. Options embedded in the fund and ETF strategies.

Next month, I’ll dive deeper into a few Options funds and related analyses of their performance and associated risks.

Our Introduction to Options

The simplest possible explanation

In the normal course of events, investors who want to change the risk profile of their portfolios can do one of two things. They can sell something they own or they can buy something they don’t. Easy.

But what if you’re a nervous investor who is not yet ready, or able, to sell part of their portfolio? What if you’re a bullish investor who is not yet ready, or able, to buy more for their portfolio?

Options offer a third path. They are structured financial products that for a price offer you the opportunity but not the obligation to act. You might nervously own shares at $38 but suspect that they might end up at $28. You could address your anxiety by going to an options broker to buy the opportunity (i.e., the option) to sell your shares at $35 at any point in the next three weeks. If they do fall below $35, you’re saved! If the shares don’t fall, you’re out the amount of your payment to the broker.

With me so far? You need to negotiate a price target ($35 in our example), an expiration (after three weeks), and a premium (the amount the broker will charge you). The same process applies if you think some security is going to climb in price and you’d like the opportunity to benefit from its rise.

For investors who are long stocks, anxious options are called “put options.” Greedy options are called “call options.”

Fifty Shades of Options

The options market we know today turned 50 years old last year. Modern options markets took off when Myron Scholes and Fischer Black published the Black-Scholes formula for options pricing in 1973. The Chicago Board of Trade set up the Chicago Board Options Exchange in ’73. In 1974 AMEX and CBOE set up a clearing system for options transactions, kicking off the options industry.

Options became popular with investors in the dot com boom, but have shown their dominance only over the last few years.

Why am I writing about options?

First, investors are enamored with options. Positively besotted. I wonder how much investors understand options, but I do know investors dearly love options.

Money has been flowing toward these funds in an unrelenting torrent. Morningstar’s vice president/research (and esteemed curmudgeon) John Rekenthaler writes:

It’s no secret that actively managed stock funds are on the outs. Counting both mutual funds and exchange-traded funds, they suffered $43 billion in net outflows in December 2022, $34 billion the previous month, and $31 billion the month before that. After a while, as the saying goes, such losses can become real money.

Covered-call funds, however, have attracted $65 billion in net inflows over the past three years. Through every month of that period, their net sales have been positive. (“Covered-Call Stock Funds Like JEPI Are Popular. Should They Be?” 1/24/2024)

The second reason I’m writing about options is that an MFO reader reached out to us and asked whether we thought such funds were something they should consider. This one’s for you, Kapil!

The market’s latest passion: Zero-day Options

Zero-day options, which are so named because they expire on the same day they are traded, now account for almost half of all daily Options volume. It’s akin to buying house insurance for one day or betting on same-day lotto.

Such options are attractive to a wide variety of folks. For example, speculators looking to trade based on momentum, technical analysis, and news flow. Or, professional traders looking to manage their risks around macroeconomic data or events.

A recent chart from the WSJ ( source Citibank):

Despite the fascination of same-day options, American options traders are a boring bunch compared to options traders in India.

In a Feb 26th, 2024 column, A tale of two bull markets, fund manager, author, and FT columnist Ruchir Sharma writes:

Most bull markets see excesses build up over time; in India, they are visible in subsets of the growing retail investor class. In 2023, Indians purchased more than 85bn options, or nearly eight times the volume in the US, and on average held those contracts for less than half an hour. Amid the frenzy, regulators ordered trading platforms to open with a warning that 90 per cent of retail investors are losing money on these trades. (Italics emphasis are mine).

When the holding period of an investment comes down to thirty minutes, we know that whoever is doing it, is having a lot of fun. This can’t be about financial planning. This is about getting rich yesterday.

Zero-day options do offer sharp shooter institutional customers and hedge funds a way to manage their stop losses on levered bets. Such short-term options are useful for speculators and hedgers, but they are not important to long-term buy and hold investors of stocks and bonds.

Lessons from The California Gold Rush

Perhaps the best I can do is to remind you of an interesting historical parallel.

The California Gold Rush created vast fortunes, just not among the gold prospectors. The people who made huge gains were the intermediaries, the guys who sold stuff to the prospectors. While the prospectors braved violence, hunger, life-threatening weather, disease, and failed mines, the merchants and hoteliers stayed in comfortable homes and let the money trickle in steadily for years. You surely know the story of Levi Strauss, whose Levi Strauss & Co. denims were wildly popular, and profitable, but do you know the guy who was vastly richer than Strauss?  Samuel Brannan became the richest man in California and its first millionaire by selling as much as $5,000 worth of goods a day – maybe $150,000 in current dollars – to gold miners. He ended up buying much of the Napa Valley.

The others in that coterie of ultra-rich – William Randolph Hearst’s father among them – thrived by keeping their hands clean and their cash registers full. The winning formula?

During a gold rush, sell shovels.

The same lesson applies here, dear readers. Retail investors who buy and sell options are – on the whole, over time – going to lose money. The only reliable winners in the options game are the same people who reliably win in casinos: the dealers. The wealth of casino magnates is built on the simple premise that “the House always wins” because whether you, individually, win or lose a particular bet makes no difference to them.

Why Options hold an important place on Wall Street

  1. Linear vs Non-Linear Payoffs: An option is akin to a lottery ticket while a stock is like a house. A fully paid house won’t go up or down in value over a day, a month, or even a year. But winning a jackpot can change my life. Options are the closest that retail investors get to non-linear payoffs. Retail is willing to invest time, money, and a portion of their portfolio in options. In this, they are mirroring the institutional investors who have long used options to juice portfolio returns judiciously. It remains to be seen if either institutions or retail can consistently use options to make money. No one breaks out their portfolio attribution from stocks vs options.
  2. Commissions: at most online trading shops, there is zero commission for trading stocks and ETFs. But options are not commission-free. Incentives are important.
  3. Options Education: Because options are far more complicated than stocks (and also more profitable), an enormous amount of educational tools are available online. Retail traders are investing time and energy in learning how to become options smart.
  4. Options Exchanges: In the late 1990s, all the exchanges: the CBOE, the CME, and the NYSE, were private and owned by the brokers who owned the seats at the exchange. Since then, exchanges have been demutualized and are now publicly traded enterprises. They are big businesses that benefit from volumes in futures and options. Following are four big US exchanges, their equity market capitalization, and their last 12-months profits.
    • CME: $75 Billion ($3.05 Billion in profit)
    • NYSE’s owner Intercontinental Exchange: $73 Billion ($2.4 Billion)
    • Nasdaq: $34 Billion ($1.1 Billion)
    • CBOE: $19 Billion ($709 million)

We needed the Black-Scholes, the options exchanges, the bull market in stocks, options education, market-makers, and the desire on the part of investors to be options-educated and embrace risk to arrive at a place where options are now traded more than futures (but less than stocks).

Options-based strategies in mutual funds and ETFs

The other important movement in Options is the flow of assets into fund strategies involving options.

A search in Ycharts for funds with more than $50mm in Assets, categorized as Derivative Income or Options Trading yielded 238 funds with an asset base of $181 Billion. The median fee on these funds is about 0.85% per year or a total fee income of $1.2 Billion annually. The chart below splits these 238 funds by year of inception.

The oldest of these funds (Shelton Equity Income Investor) launched 28 years ago but the vast majority have just a few years of operation. The biggest name in Options-related funds today is JP Morgan.

$76 Billion of the approx. $181 bn in options funds AUM are parked in nine JP Morgan funds. Here are the top three Options linked funds in the market and they are all JP Morgan funds.

  1. JP Morgan Equity Premium Income ETF (JEPI): $32.6 Bn AUM
  2. JP Morgan Hedged Equity (JHEQX): $17.7 Bln
  3. JP Morgan Nasdaq Equity Premium Income ETF (JEPQ): $10.7 Bln

Options funds usually engage in some combination of the following three strategies:

  1. Buy write: they buy stocks/index and overwrite with call options to collect option premium income. These funds have high distribution yields (about 6-8%).
  2. Put write: these funds sell puts collateralized by cash and hope to pocket the premium from underwriting puts.
  3. Buffered (Hedged) Notes: these funds buy and hold stocks/Index and use combinations of Puts and Calls to hedge the equity holdings.

Each fund may have a different proposal for what they intend to hold as equity risk: S&P 500 Index, Nasdaq, International Stocks, or Emerging Market Stocks

Each fund may have a different proposal for how they intend to use options to either earn Derivative Income by a. and b. above or create a Hedged Equity fund for c. above.

While some funds may be fairly programmatic in their choice of underlying stocks/index, and how they use options, it’s best to think of every options-related fund as an Active fund. They certainly charge fees in the magnitude of 0.8% per year, which is in line with active equity funds. The trading around of options and stocks generates plenty of short-term capital gains (and losses) which again is symptomatic of active funds.

Why do Options and Stocks as a combination work in Hedged Equity funds?

Investors are used to 60/40 allocation funds which hold a portfolio of stocks and bonds. In such funds, bonds act as an indirect hedge, appreciating when stocks sink. There is no guarantee that bonds will work when stocks don’t. 2022 and 1st three quarters of 2023 proved that balanced portfolios did not balance. When the bond indirect hedge does work, it requires a specific set of economic or interest rate conditions to be met (low inflation, slowing growth, Federal Reserve interest cuts, etc).

On the other hand, options can be a direct hedge. Owning a diversified US equity market portfolio, either through the S&P Index or one of the large-cap funds focused on growth or value, can be efficiently hedged through Options structures. Similarly, selling options generates income. And some marketers have equated options income to bond income. They are not the same kind of income.

Bond income comes from interest and rent. Selling options is to underwrite a part of the future distribution of a stock or an index. I might sell a put 50% lower than the current price of the stock and make pennies every month of the year betting the stock will not crash. That’s a different kind of income than one that comes from lending money to a company (a bond).

Option structures have been experimented with for decades on Wall Street with institutional customers. They are now just coming to retail investors. Each option structure (or options fund) needs a specific version of the future path of market returns to be most effective. Along with the innovation, also comes the fees, the complexity, the education involved, and the difficulty of choosing which fund to buy.

What’s the most logical case for ordinary investors to consider Options-related funds?

Some investors want to or need to be invested in stocks. Stocks have run up a lot. Even though it looks like they are still the place to be, stocks can go down by a third to a half. We experienced that during March 2020 Covid and then in 2022-2023. Some investors are willing to give up some equities in return for partial protection on the downside. This to me is the most logical case for investing in an options fund.

There are so many of them. By my crude estimate, there are over 150 funds with close to 90 Billion dollars of hedged equity funds. How should one decide what to buy? Biggest? Oldest? Highest return? This is not easy work. I hope to show one way to analyze these funds in next month’s column. The upshot is just like there’s only a handful of actively managed equity and bond funds one should be invested in, the same applies to options funds. And that is if we squint really hard in making a case for such funds.

In Conclusion

The forces that have come together over the last fifty years in popularizing options are getting bigger and stronger. It’s important to objectively consider investor needs and the stickiness of their needs – hedged or income solutions – in determining if the funds will reverse flows. The flows are here to stay. We should be aware of the trends and familiarize ourselves with the analysis required to determine if a fund is worth our money.

The guiding principles of financial planning and long-term investments are unchanged. For those who can stick to the discipline, no amount of options cleverness is a substitute for a strong and stable financial foundation.

Media Links: Devesh’s YouTube Videos on Derivatives History & Financial Times Article

A few years ago, I was highly motivated to run a YouTube channel and recorded videos on various asset classes. I made a playlist titled, (A few) People’s Story of Equity Derivatives in the USA. There are 10 videos which run from 1972 to 2004. Those looking to learn about how the options market became as big as it has will find a lot of fertile information in those videos. I no longer add videos to the channel.

Robin Wigglesworth of the Financial Times did an excellent interview with Sandy Rattray and me (ex-Goldman Sachs VIX inventors) and my friend, John Hiatt (Chicago Board Options Exchange)  on our work for the VIX Index creation, An oral history of the fear index (9/20/2023) on the 20th anniversary of the VIX Index.

We breathe rarified air

By David Snowball

As we go to press, the S&P 500 is at its highest level in history: 5137. It set a record by passing 5000 for the first time on February 12, then another record high of 5100 two weeks later.

In reality, of course, the S&P is not rocketing upward. The S&P 7-to-10 is, with the other 490-493 stocks as an afterthought. The top 10 stocks contributed 93% of the index’s 2023 gains. Goldman Sachs declares that the “S&P 500 index is more concentrated than it has ever been,” while Amundi, Europe’s largest asset manager and one of the world’s top six, claims it’s merely “at its highest level in over 30 years.” Folks trying to ease anxiety about that point to the fact that the market has been more concentrated before: in the mid-60s, the top 10 accounted for 40% of the market (which then … uhh, crashed), and at the end of the 90s  they hit 25% of the market (which then … uhh, crashed).

Torsten Sløk, chief economist at Apollo Global Management, a US private equity firm with over $500 billion in assets under management, seems to think that’s a bad sign. “The top 10 companies in the S&P 500 today are more overvalued than the top 10 companies were during the tech bubble in the mid-1990s” (Daily Spark, 2/25/2024). The Shiller CAPE ratio, which looks at the price of stocks relative to long-term earnings, sits at its third-highest level in 150 years.

For the past 15 years or so, that hasn’t been cause for alarm. The period we describe as The Great Distortion saw stocks routinely gain historically unprecedented valuations and suffer a series of relatively bloodless crashes: the market would crash by a third, then bounce promptly back. The Covid Crash took the market down 34% … and lasted just over one month. Those quick recoveries were driven by TINA: with nominal interest rates near zero, real interest rates below zero, and an infinitely inventive Federal Reserve ready with ever more innovative rescue schemes, cash was trash, bonds were losers, and There Is No Alternative to the stock market.

The Callan Table of Periodic Investment Returns offers one way to capture the effect of The Great Distortion. Here are the top-performing asset classes each year prior to The Great Distortion.

And the best asset classes in the years since. (Callan has done some relabeling, so index names in the old chart are replaced by asset class names in the new one.)

Before The Great Distortion, US large caps won once in 12 years (an 8% win rate, 1998-2009). Afterward, they won four times (a 29% win rate, 2010-present). US equities won three times (twice, small value) in 13 years (23% win rate, with two wins by small value) versus eight times in 14 years (a 57% win rate). Despite frequent crashes, US equities have been two to four times likelier to “win” than previously.

Many argue (likely, hope) that The Great Distortion is ending. Interest rates are in the vicinity of their 100-year average, and the Fed seems disinclined to reward the markets with premature reductions in them. That means that cash offers a real return (one-month Treasuries are offering a 5.5% yield in early March 2024), and bonds have the potential to challenge stocks for investors’ attention.

If you believe that the markets are normalizing, then you might attend to the implications of GMO’s recent asset class forecasts.

GMO, a Boston-based institutional investment firm founded by Jeremy Grantham, has released its latest “if only the world were normal” projections for 5–7-year asset class performance. It’s a monthly exercise, perhaps a public service, that garners some small notice in the investing community. The most recent forecast, like most of its immediate predecessors, is profoundly negative toward US equity investments and relatively positive toward investments in emerging markets.

The projections, they aver, are “based upon the reasonable beliefs of GMO” and include a projected inflation rate of 2.3%. That means that the “real” returns projected above are projected asset class returns minus 2.3%.

Two notes:

  1. Before The Great Distortion, when the US Fed found an almost-infinite array of ways to prop up the market, GMO’s forecasts were “stunningly accurate.” The correlation between GMO and reality was 0.94%, with GMO tending to be just a bit optimistic in their predictions. Mr. Grantham’s 10-year projection, from the beginning of the century through 2009, was “almost exactly right.”

    That “exactly rightness” is reflected in the performance of GMO’s strategies in the years before the Fed rushed to the rescue. Using the fund screener at MFO Premium, I pulled the relative return rankings for all GMO strategies. MFO Premium, MFO’s partner site, offers the most comprehensive set of risk and performance data available to retail investors and smaller RIAs. In this case, we asked, “How many of GMO’s strategies had top 20% returns each year in the early 2000s?” With eight strategies, on average, 1.6 of them would land in the top tier. GMO crushed that threshold almost every year. For the sake of brevity, we’ll show only the even-numbered years:

      • 2000: 4 of 8 funds had top 20% returns
      • 2002: 6 of 8 did
      • 2004: 4 of 9 (they added a new EM debt fund)
      • 2006: 1 of12 did (most were average to above-average that year)
      • 2008: 6 of 13 did

    In general, GMO was very right, very often.

  2. Since The Great Distortion, “the actual performance of the major asset classes over the past decade has been almost perfectly inverse to GMO’s predictions” (“The Perils of Long-Term Forecasting – GMO Edition,” Financial Times, 8/17/2023). US large-cap stocks, the assets most benefited by the Fed’s largesse, “smashed everything.”

    Once the Fed blew up the relationship between risk and reward, GMO’s projections became contrarian indicators: everything that was cheap got cheaper, and everything that was expensive got more so.

    It happens. Speaking with Pensions & Investments, GMO’s founder Jeremy Grantham explained:

    My estimate is something like 85% of the time the market is approximately reasonable, approximately efficient. Close enough. And then 15% of the time, it’s not. That divides something like 11% or 12% crazy optimism and 3% or 4% crazy pessimism. And that seems to be the model. (“Jeremy Grantham’s investment bubble gains extend to his venture capital phase,” PIOonline, 10/31/2023)

    Other major investors – not the Krypto Kids, certainly, but folks who have managed through a lot of storms, seem to point in the same general direction as GMO.

    J.P. Morgan is only slightly more optimistic about the next five years. They’ve plotted the five-year returns of the S&P based on how high valuations were at the start of the period.

    I would read that as “5% before inflation” as their expectation (Guide to the Markets, Q1/2024).

The fascinating Asset Allocation Interactive tool, published by Research Affiliates, offers two projections for the 10-year returns on the US stock market. If valuations matter, they expect real returns of 1.5% per year for a decade with volatility of 15.5%. If, however, valuations are not factored in, and we look only at dividends and growth, then returns soar… to 4% per year. In contrast, returns on EM equity are projected at 7.5% (valuations matter) or 6.8% (only yield and growth matters).

The Implication

The end of The Great Distortion does not mean that stocks are about to crash. It might mean that the securities that benefited the most and the longest from the era of free money and guaranteed Fed protection, US mega-cap growth stocks, have lost their grip. Other assets, not deeply undervalued relative to US large caps, might be expected to outperform with some consistency.

What to do about it?

There are no guarantees, which is the argument for diversification. Because 15 years is an eternity in investing, it’s a concept little-valued by many.

Consider an equal-weight S&P 500 index. These funds place an equal amount in each of the index’s 500 stocks. The flagship is Invesco S&P 500 Equal Weight ETF (RSP), which charges 0.20% and has outperformed the S&P 500.

Consider a fundamental-weight S&P 500 index. These are funds that weight the S&P 500 stocks based on the performance characteristics of the underlying corporation, not their stocks’ popularity. The two Great Owl funds there are Schwab Fundamental US Large Company Index (SFLNX) and Invesco S&P 500 Revenue ETF (RWL).

Consider an actively managed multi-cap fund. These are funds whose managers invest across the size spectrum, sometimes tilting toward larger stocks and sometimes toward smaller ones. Two Great Owl funds to consider are Prospector Capital Appreciation (PCAFX) and Smead Value (SMVLX).

Consider a flexible portfolio fund. These are funds whose managers have the freedom to move toward what they perceive as the market’s most attractive options at any given point. Unlike the funds above, they are often more risk-conscious and oriented toward absolute returns (that is, avoiding negative years). Two Great Owl funds to consider are FPA Crescent (FPACX, the largest single holding in Snowball’s portfolio) and Buffalo Flexible Income (formerly Buffalo Balanced, BUFBX).

Consider adding small international stocks. No funds in this realm earn a Great Owl designation. In place of that, we identified funds with a combination of the highest Sharpe ratios – the standard measure of risk-adjusted returns – and Martin ratios – a measure that strongly weighs downside performance. Three distinguished funds by those measures are Fidelity International Small Cap (FISMX), Driehaus International Small Cap Growth (DRIOX), and Pear Tree Polaris Foreign Value Small Cap.

Consider adding emerging markets stocks. Many of our preferred EM funds, Seafarer Overseas Growth & Income and Seafarer Overseas Value as examples, do not yet have 15-year records. The two most distinguished funds that have crossed that threshold are both passive funds:  SPDR S&P Emerging Markets Small Cap ETF (EWX) and PIMCO RAE PLUS EMG (PEFFX). The PIMCO fund uses a Research Affiliates index which has a distinct value tilt.

Performance comparison, 15 years (through 01/2024)

  APR Return vs peers Sharpe ratio US large cap exposure Great Owl? Morningstar
Invesco S&P 500 Equal Weight 16.0 +2.7 0.89 35 Yes Five stars
Schwab Fundamental US Large Co Index 16.4 +3.2 0.95 68 Yes Five stars
Invesco S&P 500 Revenue ETF 115.8 +2.6 0.95 67 Yes Five stars
Prospector Capital App 11.0 -2.2 0.81 38 Yes Five stars
Smead Value 16.6 +3.4 0.92 46 Yes Five stars
FPA Crescent 10.2 +1.7 0.83 31 Yes Four stars, Gold
Buffalo Flexible Income 10.9 +2.3 0.81 72 Yes Three stars, Gold
Fidelity International Small Cap 11.7 +1.6 0.65 No Five stars, Neutral
Driehaus International Small Growth 12.2 +1.7 0.66 No Five stars, Bronze
Pear Tree Polaris Foreign Value Small Cap 12.0 +0.9 0.93 No Four stars, Bronze
SPDR S&P Emerging Markets Small Cap ETF 9.5 +1.8 0.44 Yes Five stars, Bronze
PIMCO RAE PLUS EMG 11.5 +3.8% 0.47 Yes Four stars, Bronze
US Total Stock Market Index 15.7   0.96 71 No  

Source: MFO Premium data screener. Note: Lipper peer groups differ from fund to fund, so the annual return compared to peers might seem inconsistent from one row to the next. That’s simply different peer groups within the same broad theme (international smaller companies or multi-cap funds).

The Bottom Line

If you believe that The Great Distortion has ended, that inflation is real, and that interest rates will not return to the zero-to-negative range they occupied since 2008, then you might also want to take GMO’s projection more seriously.

That implies relying less on strategies that depend on Fed largesse and market mania and more on strategies that have worked well even while out of favor. We close with Mr. Grantham:

I would say that financial markets are very inefficient, and capable of extremes of being completely dysfunctional. (Stephanie Dahle, “Get Briefed: Jeremy Grantham,” Forbes.com, 1/26/2009)


Outperforming Actively Managed ETFs

By Charles Lynn Bolin

David Snowball wrote The Rise of the Active ETFs in the July 2019 Mutual Fund Observer newsletter describing actively managed exchange-traded funds as:

“Active ETFs are a sort of hybrid between more traditional ETFs and actively managed mutual funds. Like traditional ETFs, they trade on the secondary market which means that the advisor doesn’t need to keep cash on hand in order to meet day-to-day withdrawal needs. Some of the expenses traditionally borne by the advisor either don’t exist (ETFs have fewer shareholder reports than, by law, mutual funds do) or are shifted to the brokerage firm. They also offer a structural tax advantage: shareholders aren’t responsible for the yearly tax consequences (and record-keeping) of the manager’s moves; shareholders are taxed only when they sell their shares.”

Actively managed exchange-traded funds are becoming a lot more popular. This article identifies nearly one hundred high-performing actively managed ETFs. This article is divided into the following sections:

CONTAINING THE SCIENCE PROJECT

Without meaning to turn this into a large science project, I extracted 471 actively managed ETFs that had at least $10 million in assets under management, outperformed their category peers by at least 1.5 percentage points, and had expense ratios of one percent or less. There are actively managed, index, enhanced strategy, managed volatility, and Smart Beta categories with funds often overlapping multiple categories. Through a process of elimination, I narrowed the list down to less than one hundred high-performing funds separated into five tables in this article. 

Figure #1 shows that approximately 65% of the outperforming funds are less than seven years old.

Figure #1: Age of Outperforming Actively Managed ETFs

Source: Author using MFO Premium data screener

I will separate the “well-known outperforming actively managed ETFs” with over $5B and look at them separately. Figure #2 shows Assets Under Management versus Age of the remaining 362 outperforming actively managed ETFs with less than $5B in AUM. The regression line identifies 129 “up and coming” future bond and equity stars (above the blue line) that have AUM more than 71 times multiplied by the age in years.  There are twenty “unappreciated Great Owl funds” among those that have not attracted investors’ interest (below the dashed line).

Figure #2: Outperforming ETFs with Less Than $5B in AUM

Source: Author using MFO Premium data screener

From Table #1, we can see that funds that are “Smart Beta” or “Fund of Funds” have lower outperformance as measured by “APR vs Peer” than those that are. We will analyze “Fund of Funds” and “Smart Beta” as a separate group.

Table #1: Average APR vs Peer for Life of Fund

Source: Author using MFO Premium data screener

EMERGING FROM THE FOREST INTO THE TREES

The original 471 funds were pared down to 98 based on “APR vs Peer” and risk-adjusted performance over multiple periods. Table #2 contains the equity funds that investors have recognized as outperformers as reflected by having more than $5B in assets under management.

Table #2: Recognized Outperformers with More than $5B in AUM (Life of Fund)

Source: Author using MFO Premium data screener

Table #3 contains the outperforming funds that investors are recognizing as “Up and Coming Future Stars” as measured by AUM relative to age. As can be seen, most of the funds have not been in existence for more than three years.

Table #3: Up and Coming Future Stars with Less Than $5B in AUM

Source: Author using MFO Premium data screener

Table #4 contains outperforming funds classified as Great Owls by Mutual Fund Observer that investors have not committed to as measured by AUM relative to age.

Table #4: Under-Appreciated Great Owls (Life of Fund)

Source: Author using MFO Premium data screener

Table #5 contains only Smart Beta funds and Fund of Funds.

Table #5: Outperforming Smart Beta and Fund of Funds

Source: Author using MFO Premium data screener

Table #6 contains Mixed Asset, Sector, and Options Arbitrage/Strategies and Managed Futures Funds.

Table #6: Other Notable Outperformers

Source: Author using MFO Premium data screener

SHORT LIST OF GREAT OWL FUNDS

I then went through the 98 funds and selected no more than one fund per Lipper Category based on relative performance over multiple time periods with the exception of the Mult-Cap Value category which has two funds. Table #7 contains my short list of funds. Since I have already written about and like the Fidelity New Millenium Fund (FMIL), I selected Franklin International Core Dividend Tilt Index ETF (DIVI) as a fund to profile in the next section.

Table #7: Short List of Outperforming Funds (Metrics – Three Years)

Source: MFO Premium data screener

Outperformance is measured relative to peers in the same Lipper Category and does not imply that the category performed well, for example, bonds in Figure #3.

Figure #3: Short List of Outperforming Funds

Source: Author using MFO Premium data screener

FRANKLIN INTERNATIONAL CORE DIVIDEND TILT INDEX ETF (DIVI)

Franklin International Core Dividend Tilt Index ETF (DIVI) has $675 million in assets under management in 463 mid- and large-cap holdings with an expense ratio of 0.09%.  The 30-Day SEC Yield is 3.9%. The trailing price-to-earnings ratio is 13.3. Fifty-seven percent of its assets are in Europe, with 28% in Asia, and 11 percent in Australia and New Zealand. Nearly 60% of the assets are invested in Financials (23%), Health Care (12%), Industrials (11%), and Consumer Discretionary (11%). The Fund was changed in August 2022 to track Linked Morningstar Developed Markets ex-North America Dividend Enhanced Select Index and modified its principal investment strategies.

The link to the Prospectus is here. The Principal Investment Strategies are,

“Under normal market conditions, the Fund invests at least 80% of its assets in the component securities of the Underlying Index and in depositary receipts representing such securities. The Underlying Index is a systematic, rules-based proprietary index that is maintained and calculated by Morningstar, Inc. (Morningstar or Index Provider). The Underlying Index is based on the Morningstar® Developed Markets ex-North America Target Market Exposure Index (Parent Index) and is constructed by applying an optimization process to the Parent Index that aims to deliver a higher dividend yield than the Parent Index, while limiting expected tracking error to the Parent Index (i.e., to provide a “dividend tilt” through the selection and weighting of securities from the Parent Index)…”

Fred Piard, a quantitative analyst with a Ph.D. in computer science, wrote about Franklin International Core Dividend Tilt Index ETF (DIVI)  in “A Leading International Dividend Fund” on Seeking Alpha. Mr. Piard lists several competitor funds which I include in Table #8 for the past eighteen months since August 2022.

Table #8: DIVI and Comparable Fund Performance (18 months)

Source: MFO Premium data screener

PORTFOLIO OF OUTPERFORMING ACTIVELY MANAGED FUNDS

I take portfolio optimization with a grain of salt because results are based on historical data which may not represent future performance; however, much insight can be gained. I loaded twenty-five funds into Portfolio Visualizer Portfolio Optimization and through a process of elimination narrowed the list down to ten to maximize the Sharpe Ratio. The link to Portfolio Visualizer Portfolio Optimization is here. I use constraints on allocations to mimic a balanced portfolio.

Figure #4: Portfolio of Actively Managed Funds to Maximize the Sharpe Ratio

Source: Author Using Portfolio Visualizer

Table #9 shows that the Portfolio of outperforming actively managed ETFs had a higher return with lower volatility and drawdown than the Vanguard Balanced Index Fund.

Table #9: Performance of Maximum Sharpe Ratio Portfolio (18 Months)

Source: Author Using Portfolio Visualizer

I used the Portfolio Visualizer Backtest Portfolio to get the stock-to-bond ratio. The link to the Portfolio Visualizer Backtest Portfolio is here. The Outperformers portfolio is approximately 63% stock.

Table #10: Performance of Maximum Sharpe Ratio Portfolio (18 Months)

Source: Author Using Portfolio Visualizer

Figure #5 is a visual representation of the performance.

Figure #5: Outperforming ETF Portfolio vs Vanguard Balanced Index Fund

Source: Author Using Portfolio Visualizer

Closing

Actively managed ETFs have some advantages over mutual funds. This article shows that many ETFs maintain this advantage over the long term. I added the outperforming actively managed ETFs that I was not tracking to my MFO Watchlists. These will become a larger part of my fund selection going forward.

Best Wishes for Investing in 2024!

Discipline or Disruption?

By David Snowball

There are two paths that investors can follow, and pretty much only two.

Path One: Get Rich Slowly.

This involves three steps. Invest in a risk-aware strategy. Fund it regularly. Get on with life. There will be ups and downs but, with time, you’ll win.

Path Two: Get Poor Quickly.

This involves three steps. Obsess about how rich other people are getting. Impulsively chuck money at a magic solution (crypto, meme stocks, SPACs, bleeding-edge tech, NFTs). Watch your anxiety spike as the money you couldn’t really afford to invest becomes the money you no longer have.

The estimable Jason Zweig, fresh off a long sabbatical, made the point with characteristic style and grace. It turns out that about the most valuable investment you could have in 1917 were natural pearls, a string of which were bought for $1 million; that’s $24 million in today’s money. It also turns out that about the least valuable investment you could have five years later were natural pearls. Unbeknownst to investors, Kokichi Mikimoto had perfected the cultural pearl.

History shows that what happened to natural pearls happens to technologies, too. They fall victims to what the economist Joseph Schumpeter called “the perennial gale of creative destruction” … almost every previously disruptive technology has ended up being disrupted. (“Digital Gold? Or Digital Pearls?” Wall Street Journal, 2/24-25/2024).

One quick and cheeky way of testing how this plays out in the fund (open-ended or exchange-traded) world is to compare one set of funds that showcases discipline – typically quality-focused, lower turnover strategies – with another set that showcases their ability to give you access to life on the bleeding edge.

There are 37 funds that self-identify as embracing “discipline” or “disruption.” We simply searched using the MFO Premium screener for funds using one of those two terms in their names plus those from ARK Investments (whose slogan is “We Invest Solely In Disruptive Innovation”). In order to give the broadest sweep to the results, we limited ourselves to performance over the past three years.

The results are striking and unambiguous:

Measured by total returns, all of the top 20 funds are disciplined. Sixteen of the 17 worst funds – including all 14 funds with three-year losses – are disruptive.

Measured by returns relative to other funds in their individual peer groups, 15 of the top 20 funds are disciplined. Nine of the ten worst performers are disruptive. Of the 17 funds with negative peer-adjusted returns, 12 are disruptors.

Measured by the Sharpe ratio, all of the top 20 funds are disciplined. Sixteen of the 17 worst funds are disruptive.

Measured by downside deviation, a way of capturing “bad” volatility rather than all volatility, all of the 20 best funds are disciplined.

Measured by maximum drawdown, the greatest decline in value at any point over the last three years, 19 of the 20 best funds are disciplined.

Over the period in question, the only things that disruptive funds disrupted were their investors’ portfolios and sanity. Readers interested in other time periods or different strategies for constructing the comparison can construct their own metrics at the MFO Premium screener (still a screaming bargain at $120/year) which offers data back to 1926, a huge suite of metrics (correlation, rolling averages, up/downside capture, period returns and ratings, batting averages, benchmark comparisons, trend and momentum, Lipper Leaders, and Ferguson) and side-by-side comparisons of about 10,000 funds, ETFs, closed-end funds and insurance products.

Bottom Line

In general, the best way to lose money is to bet on high-glitz “story” strategies. At least since the 1960s they’ve followed the same pattern: an exciting story, a great two- or three-year run, followed – sometimes repeatedly – by crashing and burning. It was true of the Steadman Funds in the 1960s, the Van Wagoner Funds in the 1990s, and the disruptors today.

In general, the best long-term returns are generated by discipline: investing in high-quality companies, maintaining a long-time horizon, and a conviction that the best way to make money is not to lose money. Berkshire Hathaway is the poster child for such a strategy. There are 143 Great Owl funds in the US equity category, ranging in age from 5 – 64 years. Most (those at or below the median) have turnover ratios in the 20s or below; that is, most hold their securities for more than four years. The average turnover ratio for Great Owl US equity funds is 41%, driven by a handful of trading strategies. The average turnover ratio for US equity funds (1991-2020) was over 80%.

If you embrace discipline (I mean in your portfolios), two disciplined funds – highlighted in blue – earned MFO’s Great Owl designation for consistently top-tier risk-adjusted returns.

If you pursue disruption, you risk disruption. Mr. Z’s advice: “Learn a lesson from Maisie Plant (she of the $1 million pearls): If you make that bet, keep it small and hedge it if you can.”

Three-year performance, sort by Sharpe ratio

  APR APR vs Peer Sharpe Ratio Std Dev Downside Dev Max Loss
SEI Large Cap Disciplined Equity 12.49 3.99 0.59 16.70 10.70 -22.12
Columbia Disciplined Value 11.79 1.86 0.57 16.18 10.13 -16.40
John Hancock Disciplined Value 11.79 2.59 0.56 16.42 9.98 -15.66
Allspring Disciplined US Core 12.49 1.70 0.56 17.52 11.51 -23.36
Columbia Disciplined Growth 12.88 3.96 0.50 20.49 13.76 -29.18
Columbia Disciplined Core 11.48 0.69 0.50 17.65 11.69 -24.14
MassMutual Disciplined Value 10.27 1.07 0.47 16.13 10.09 -17.46
BlackRock GA Disciplined Volatility Equity 8.71 -0.50 0.47 13.08 8.53 -20.28
Amundi Pioneer Disciplined Growth 10.75 -0.04 0.42 19.36 12.81 -27.46
Disciplined Growth Investors 10.56 6.29 0.41 19.27 12.00 -24.95
John Hancock Disciplined Value Mid Cap 10.04 2.76 0.40 18.49 11.21 -18.00
American Century Disciplined Growth 10.59 1.67 0.39 20.46 14.09 -32.08
Fidelity Disciplined Equity 10.51 1.59 0.39 20.12 13.66 -31.61
CIBC Atlas Disciplined Equity 9.23 -1.56 0.39 17.11 11.62 -24.02
MassMutual Disciplined Growth 10.63 1.71 0.38 20.87 14.38 -32.26
Manning & Napier Disciplined Value 7.43 -2.51 0.30 16.03 10.19 -16.89
John Hancock Disciplined Value International 7.02 2.70 0.25 17.36 11.28 -22.65
Amundi Pioneer Disciplined Value 6.98 -2.22 0.24 18.14 12.06 -21.71
American Century Disciplined Core Value 5.64 -3.57 0.18 16.68 11.38 -21.34
Allspring Disciplined Small Cap 5.41 1.59 0.13 20.96 13.36 -23.42
T Rowe Price International Disciplined Equity 3.13 0.49 0.03 16.58 10.83 -26.51
Fidelity Disruptive Finance ETF 3.19 -3.04 0.03 22.12 14.82 -32.26
Fidelity Disruptive Automation ETF 0.38 6.80 -0.09 24.39 17.06 -39.65
Fidelity Disruptive Technology ETF -1.45 4.96 -0.14 29.71 20.45 -51.84
ALPS Disruptive Technologies ETF -2.91 3.51 -0.24 22.99 16.30 -38.69
Fidelity Disruptive Communications ETF -0.48 0.15 -0.14 22.85 16.11 -42.89
First Trust Alerian Disruptive Technology Real Estate ETF -0.60 -0.05 -0.16 20.66 14.47 -29.89
Fidelity Disruptive Medicine ETF -3.75 -3.54 -0.31 20.41 15.93 -37.33
ARK Israel Innovative Technology ETF -13.53 -7.11 -0.70 23.07 18.70 -52.14
Harbor Disruptive Innovation -7.61 -7.89 -0.39 25.98 19.49 -49.80
ARK 3D Printing ETF -18.04 -11.62 -0.80 25.93 20.92 -54.94
ARK Fintech Innovation ETF -19.56 -13.15 -0.49 44.99 31.46 -74.07
Franklin Templeton Disruptive Commerce ETF -16.76 -16.53 -0.64 30.10 23.69 -62.70
ARK Autonomous Technology & Robotics ETF -13.93 -20.43 -0.57 29.07 21.98 -52.06
ARK Next Generation Internet ETF -20.08 -24.54 -0.51 44.76 31.47 -75.39
ARK Genomic Revolution ETF -30.27 -30.07 -0.82 40.22 32.21 -75.24
ARK Innovation ETF -26.54 -31.00 -0.64 45.87 33.11 -75.93


Briefly Noted

By TheShadow

Updates

Beware of big promises! Several articles have been written recently about BOXX ETF. Alpha Architect 1-3 Month Box ETF which tries to outperform an ultra-cheap vanilla ETF by using an option swap strategy. In theory, the game will allow investors to pay the long-term capital gain rate on their games rather than the ordinary income rate.

Here’s the advisor’s description of their strategy:

is an actively managed exchange-traded fund whose investment objective is to provide investment results that, before fees and expenses, equal or exceed the price and yield performance of an investment that tracks the 1-3 month sector of the United States Treasury Bill market. To do so, the principal investment strategy of the Fund will be to utilize an exchange-listed options strategy called a box spread. In order to accomplish its investment goals, the Fund may utilize either standard exchange listed options or FLexible EXchange® Options or a combination of both. Investors have to pay long term capital gains at a time of their choosing when they sell. 

There has been a short but useful discussion of the strategy on the MFO discussion board. The short summary might be: “Yeahhhhh… depending on your tax situation and state of residence, you might get a tiny advantage here compared to a simple 1-3 month Treasury ETF.” You can check the Alpha Architect website for more information. Caveat Emptor to prospective interested investors.

Briefly Noted . . .

Crypto rolls on: Following the SEC’s surrender, a dozen bitcoin ETFs launched in February. The Wall Street Journal reports that “at least 10 firms including BlackRock and Fidelity Investments have filed applications to launch what would be the first US-listed ETFs holding ether, the second-largest cryptocurrency” (“Wall Street Expands ETF Plans to Ether,” 2/28/2024).

Green Flight rolls on: In the latest example of the dictum “our funds are run by our marketers,” WisdomTree announced that effective March 15, 2024, WisdomTree Emerging Markets ex-State-Owned Enterprises Fund and the WisdomTree China ex-State-Owned Enterprises Fund will no longer consider environmental, social, and governance (“ESG”) issues in their portfolio decisions.

Pioneer seeks the worst of both worlds: the ESG label without the ESG content. For the purposes of the Pioneer Global Sustainable Equity Fund, “ESG” considerations are limited to the exclusion of (a) tobacco companies and (b) companies making more than 10% of revenue from controversial weapons such as cluster bombs and anti-personnel mines. The last US maker of cluster bombs, Textron, got out of the business in 2016. The US production of land mines ended in 2018, according to the Landmine and Cluster Munition Monitor.

Passive overtakes active. Don’t cheer just yet. On February 13, 2024, John Rekenthaler announced that “The inevitable at last arrived. Last month, for the first time, passively managed funds controlled more assets than did their actively managed competitors” (“Index Funds Have Officially Won,” Morningstar.com, 2/13/2024). That estimation covers both traditional open-ended mutual funds and ETFs. The drivers of the passive victory include lower costs, lower taxes, and an unrelenting media blitz that treated all passive strategies as if they were the best passive strategies. It’s the equivalent of adding a “low sugar!” sticker on a can of Crisco and declaring it to be a health food.

Thoughtful people are worried about the development because active investors are more capable of policing corporate malfeasance than passive ones. If a corporation chooses to give its CEO a $50 billion compensation package to, say, cover his personal losses from an idiotic decision to buy a social media company, take it private, and ruin it (just a hypothetical, mind you), active investors might (and did) act to block the self-serving idiocy. Passive investors just go along for the ride, regardless.

Potentially, that intrinsic blindness on the part of passive funds can lead to substantial market dislocation. James Mackintosh of the Wall Street Journal argues:

A market dominated by passive investment management means little oversight of what executives spend shareholder cash on, and could lead to share prices disconnected from corporate profitability, as index trackers blindly buy. (“Passive Capitalism is Risky,” Wall Street Journal, 2/28/2024, B7)

A 2020 Boston Fed report notes that the rising dominance of passive strategies “amplify market volatility, and the shift has increased industry concentration” (because money automatically flows toward “the winners”). (Boston Fed, The Shift from Active to Passive Investing: Risks to Financial Stability? 3/15/2020)

Mr. Mackintosh frets a bit that the largest active investors that remain are national wealth funds, such as Norway’s huge investment fund. Such funds have an incentive to police behavior but they are also responsive to the political needs of their governments. That’s not ideal for those of us caught between national governments and huge corporations.

Mortimer is leaving the building. And Vanguard.

Vanguard’s CEO Mortimer “Tim” Buckley will step down by the end of the year. “By the” might mean “at the” or, I suppose, “as soon as we’ve got a new CEO.”  Morningstar analyst Sotiroff reviewed Vanguard’s recent adventures before concluding, “Whoever replaces Buckley should be up to these challenges and more, while also forging ahead on behalf of investors” (Vanguard CEO Tim Buckley to Retire, Morningstar.com, 3/1/2024). “Should be” might mean “had damn well better be” or “easy-peasy, they got The Guy revved up and ready to go.”

CLOSINGS (and related inconveniences)

None lately!

OLD WINE, NEW BOTTLES

Effective March 4, 2024, Clough Long/Short Equity ETF becomes Clough Hedged Equity ETF. The rechristened fund, so far as we can tell, continues to be long/short equity but the managers can dabble in other hedging strategies as well.

Effective February 16, 2024, Defiance Israel Bond ETF became Defiance Israel Fixed Income ETF.

Knowledge Leaders Developed World ETF will be reorganized into the AXS Knowledge Leaders ETF after a shareholder vote is scheduled to vote on the reorganization on or about April 11. From an investor’s perspective, nothing but the name changes.

Effective March 4, 2024, three Monarch index ETFs will own up to the fact that … well, they’re index ETFs. Monarch Ambassador Income ETF will become Monarch Ambassador Income Index ETF; Monarch Blue Chips Core ETF will switch to Monarch Blue Chips Core Index ETF; and Monarch ProCap ETF will be rechristened as Monarch ProCap Index ETF.

Effective February 20, 2024, TrueShares Low Volatility Equity Income ETF became Opal Dividend Income ETF.

OFF TO THE DUSTBIN OF HISTORY

Arrow Reverse Cap 500 ETF will be liquidated on or about March 1.

AXS Cannabis ETF will be liquidated on or about February 28.

Bernzott U.S. Small Cap Value Fund will be liquidated on or about March 28.

BNY Mellon Sustainable US Equity ETF, BNY Mellon Sustainable International Equity ETF, and BNY Mellon Sustainable Global Emerging Markets ETF are slated to become Former Funds this month.

Carillon Chartwell Short Duration Bond Fund will be liquidated and terminated on or about April 19, 2024.

JPMorgan Small Cap Sustainable Leaders Fund will be liquidated on or about May 21.

Frontier MFG Global Equity Fund will be closed and liquidated as a series of the Company, effective as of the close of business on the liquidation date, April 30, 2024.

Goldman Sachs Concentrated Growth Fund is slated to merge into Goldman Sachs Enhanced Core Equity Fund (apparently “enhanced” is better than “concentrated” these days) in part because “the reorganization: (i) would rationalize Funds that have the same investment objectives and similar investment strategies (albeit with some notable differences).” The implication, of course, is that the original decision must have been irrational. The reorganization is expected to close on or about April 26, 2024.

Greenwich Ivy Long-Short Fund will be liquidated on March 15, 2024.

KL Allocation Fund will merge into AXS Astoria Inflation Sensitive ETF on May 3, 2024. Put gently, the new fund has nothing to do with the old one. KL stood for Knowledge Leaders and the original plan was to invest solely in firms that fit that bill. The ETF absorbing the fund’s assets invests across asset classes in securities that might benefit from inflation. Its three largest holds are an infrastructure service company, gold, and TIPs.

Pioneer Emerging Markets Equity Fund will be liquidated on or about March 28, 2024.

Touchstone International Growth Fund will merge into Touchstone Sands Capital International Growth Equity on May 24, 2024.