Monthly Archives: April 2024

April 1, 2024

By David Snowball

Dear friends,

It’s April. I spent much of the Easter weekend wearing a t-shirt out to work in the gardens. It was glorious. Today, the forecast is for hail. Tomorrow? Snow.

Next week? Oh, I don’t know … dragon fire?

And still, it behooves us to be grateful for what we have. The world’s most corrosive force is not greed. It’s envy, which is driven by the sense that what we have just isn’t enough, and bitterness that others have more. That’s a theme that Charlie Munger reflected on repeatedly: “I have conquered envy in my own life. I don’t envy anybody. I don’t give a damn what someone else has. But other people are driven crazy by it.” How crazy? Hmmm … think Biblically crazy: “If you want to talk about future implications, a lot of what I see now reminds me of Sodom and Gomorrah. You get activity feeding on itself, frenzies of envy and imitation” (2005).

It eventually even infected his sidekick, Warren Buffett: “There is no reason to look at the minuses in life. It would be crazy. We count our blessings.” (Yes, I know. Easier said if you’re worth $90 billion.)

The joyful secret to it is that the blessings don’t have to be large in order to be meaningful. Jancee Dunn, writing in the New York Times “Well” newsletter, reflected on her anxious day at the Times when she couldn’t figure out how to log in to the company’s network, was terrified that someone could overhear her fumbling on the phone, and so snuck off to meet one of the Wizards in the IT department (Chip assures me that she hires only wizards-in-training in IT.). Adnan The Wizard fixed her problem, commiserated, and shared a thought:

He told me to imagine a jar and suggested that I add a metaphorical penny to it every time I achieved something — even a task as small as finding my way back to my desk.

Over time, he said, you will fill up the jar. You will see that you are moving forward, even when you don’t feel that you are, he added.

I still think about that jar, especially when I’m having a rough time. I still deposit “pennies.” (“Feeling Overwhelmed? Try Tallying Your Tiny Wins,” NYT.com, 3/29/2024)

And so, in the face of hail and uncertainty, I celebrate my blessings: a loving family that I work to deserve, a meaningful calling and the trust of the families that make it possible, the sight of a bald eagle spiraling lazily above the tennis courts just beyond my window, time with all of you folks, and the signs that nature will give me another chance this year.

In this month’s Observer

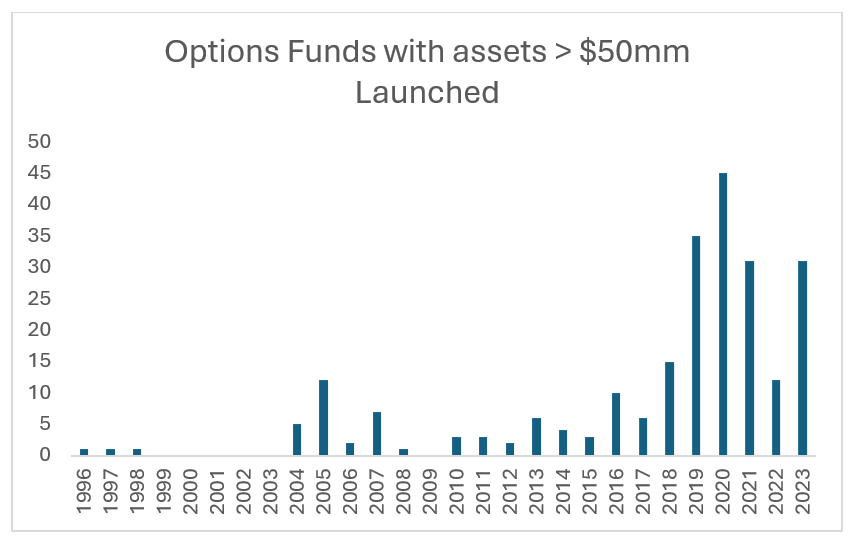
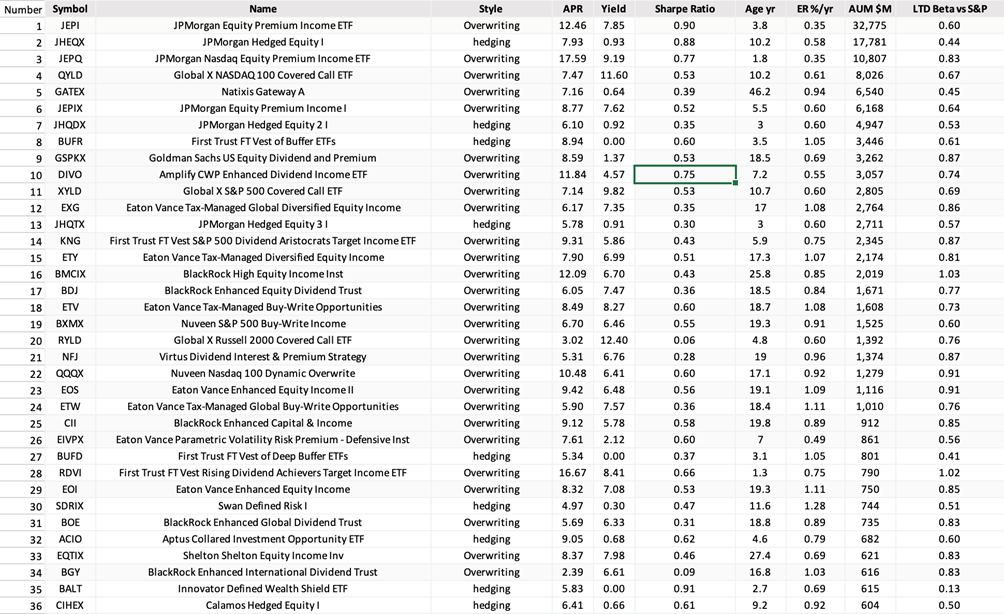
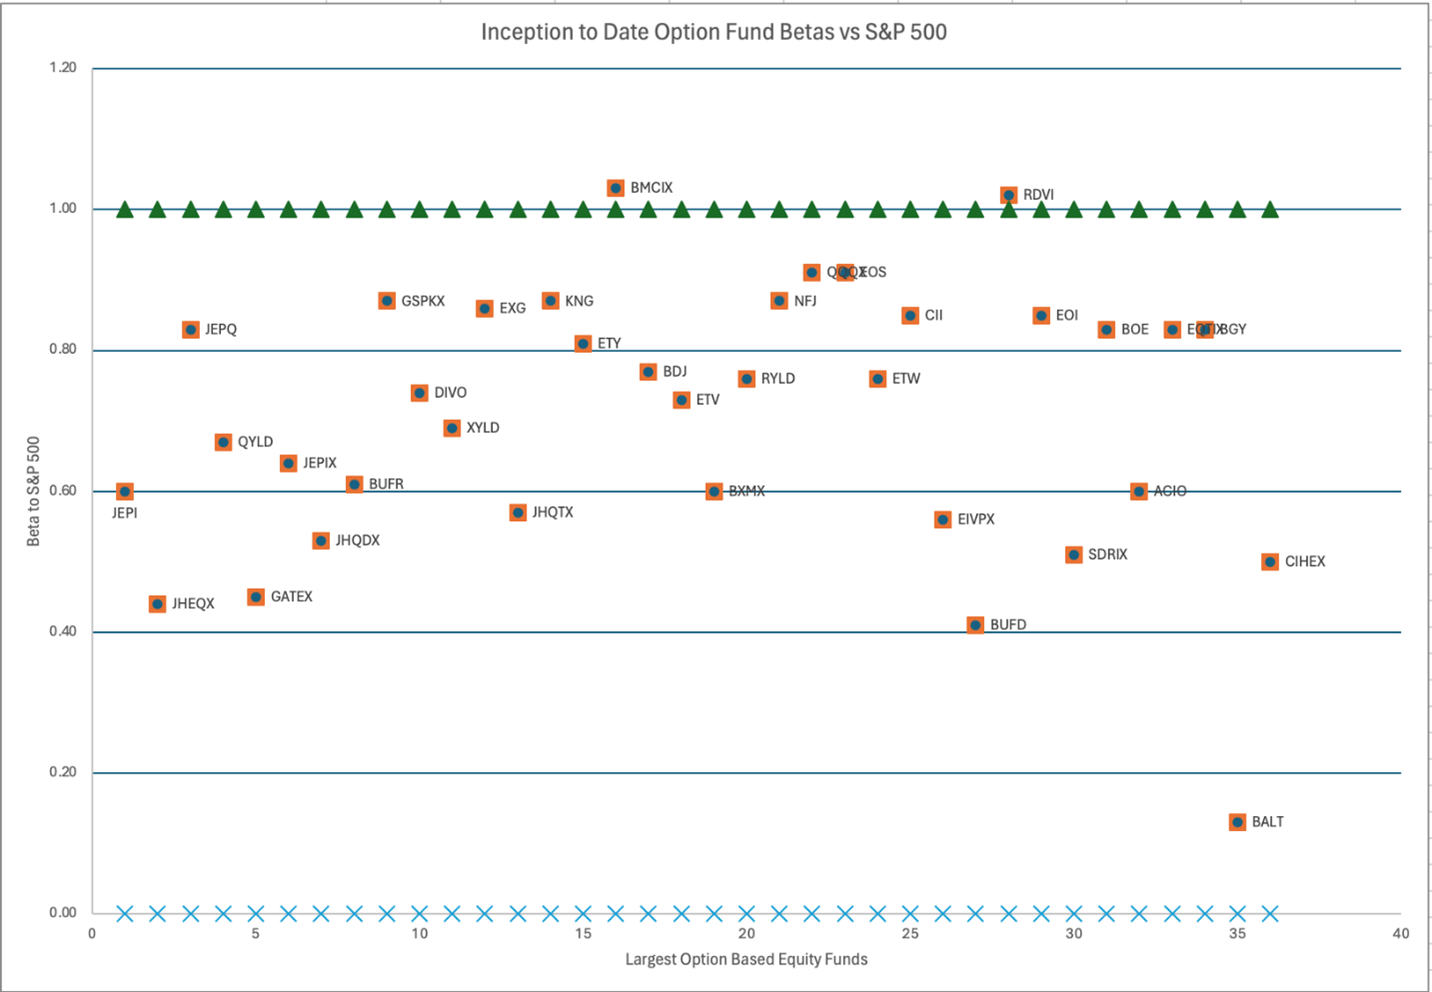
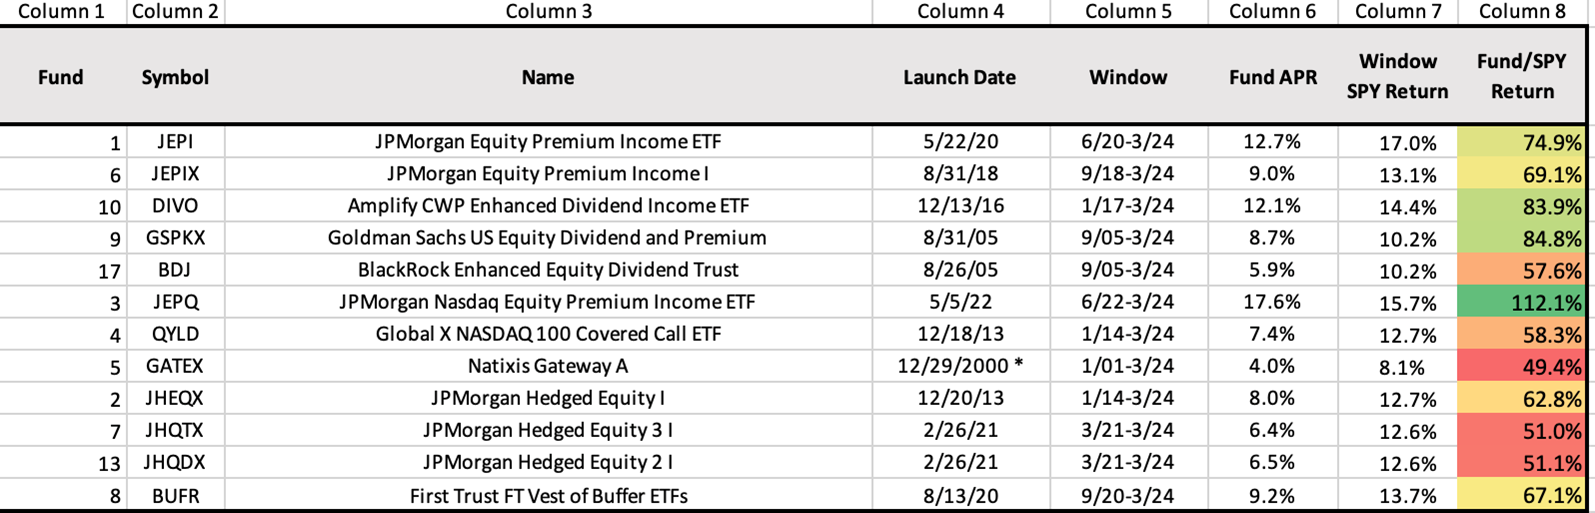
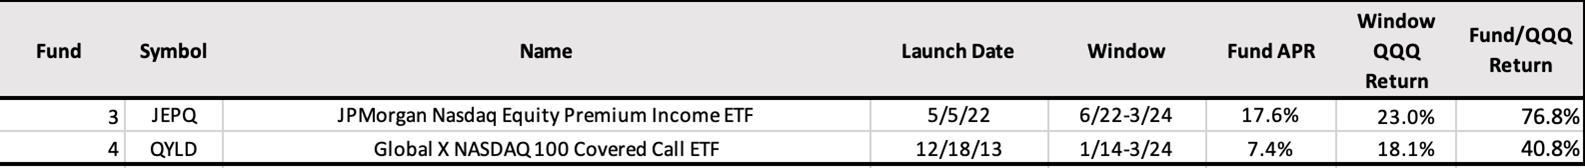
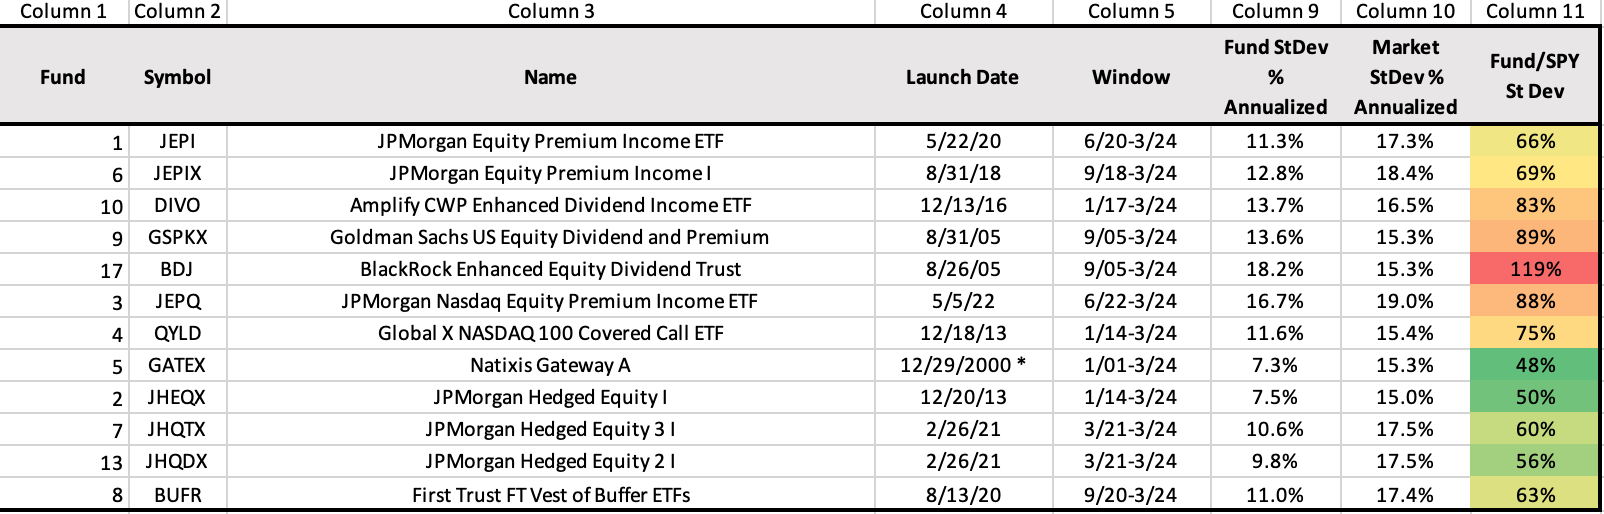
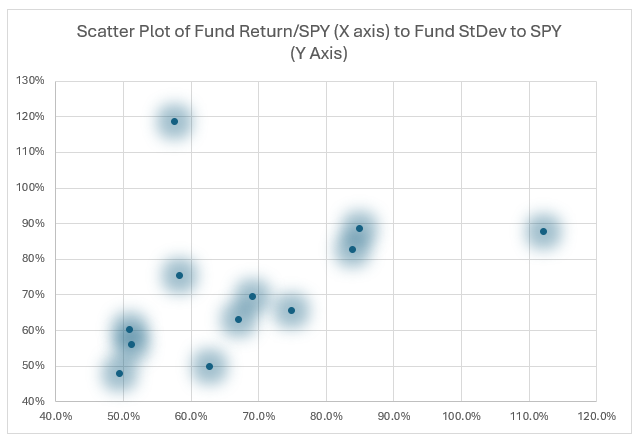
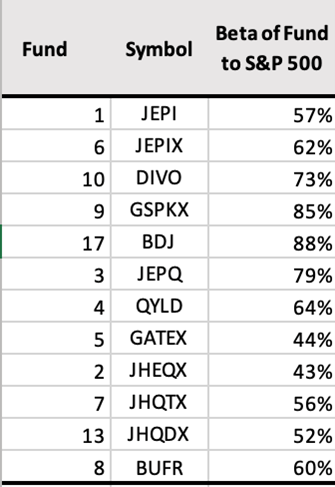
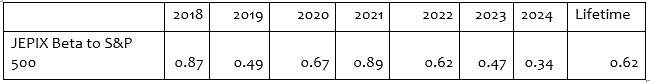
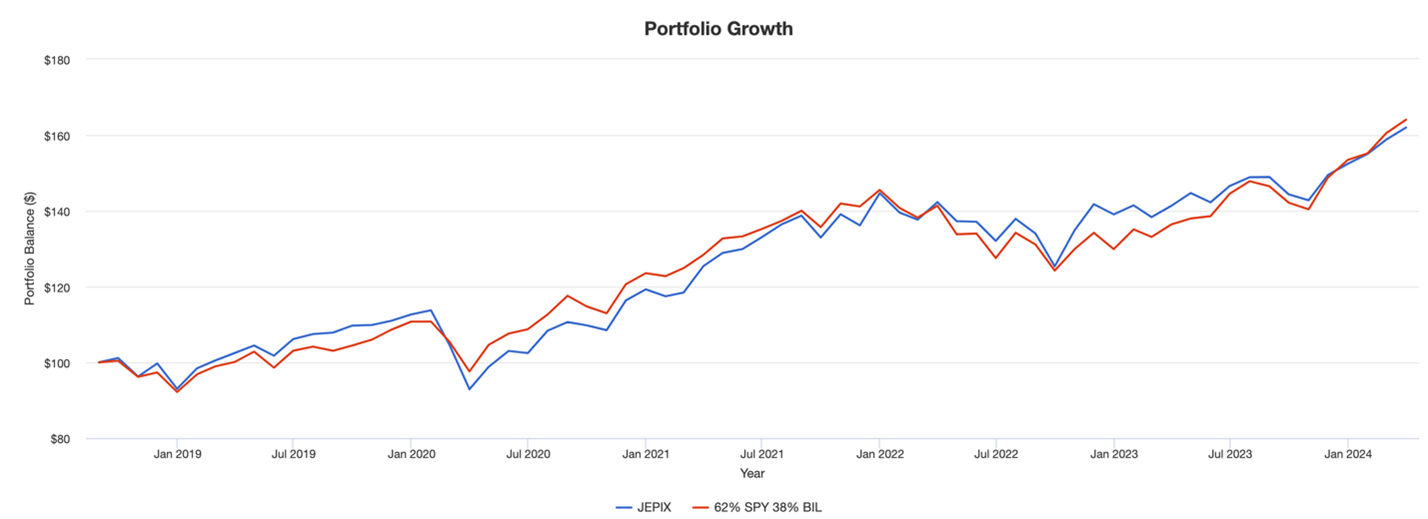
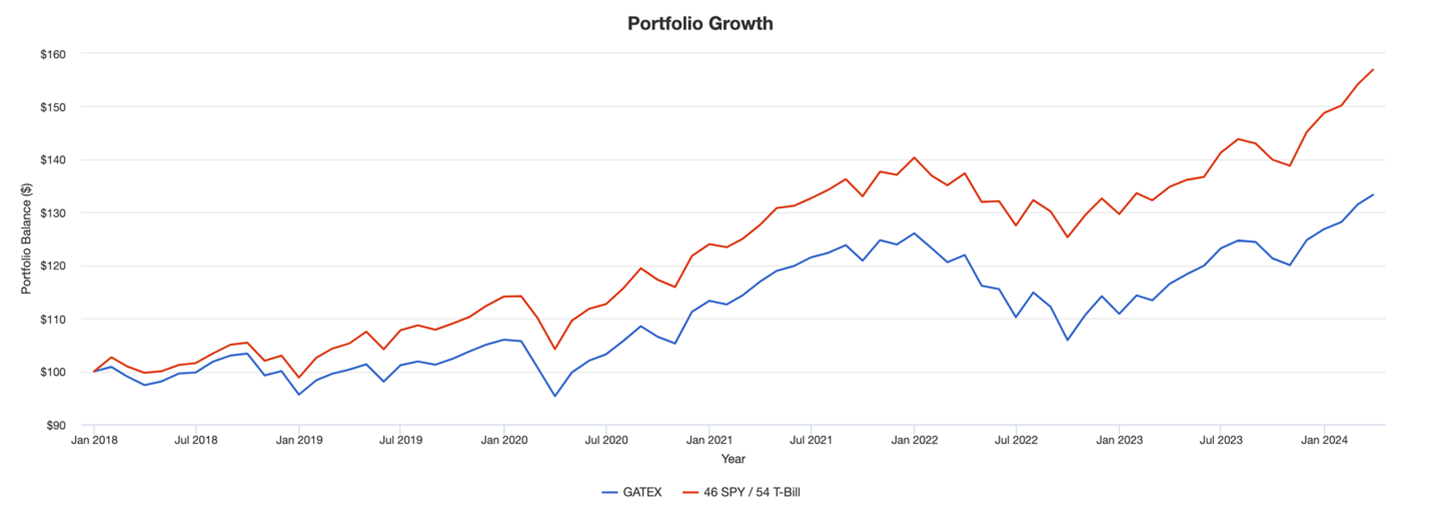
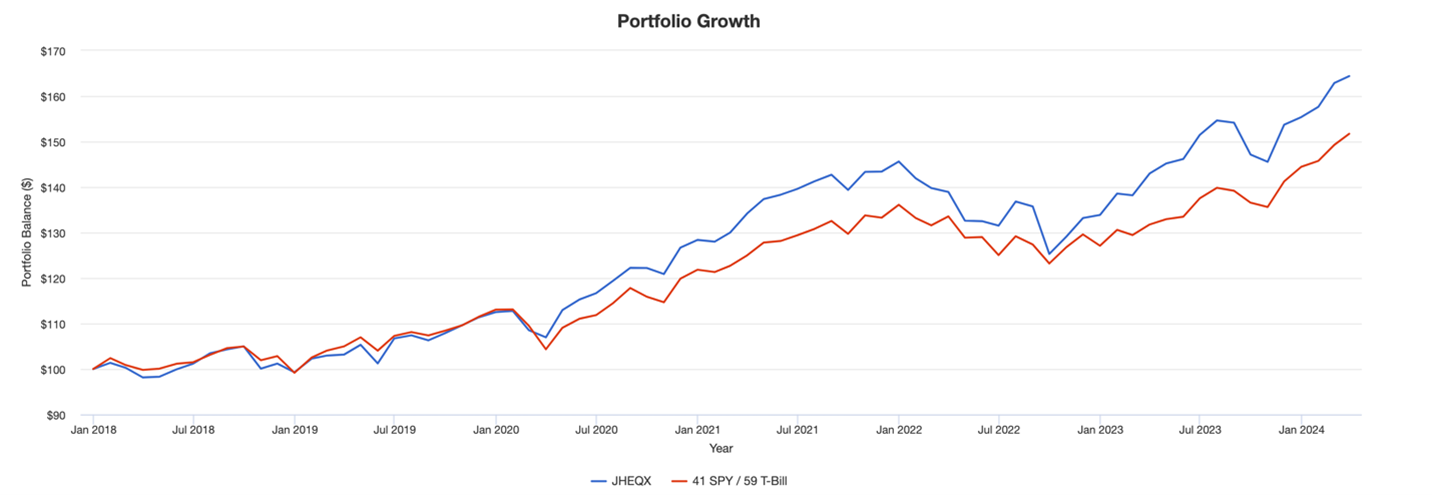
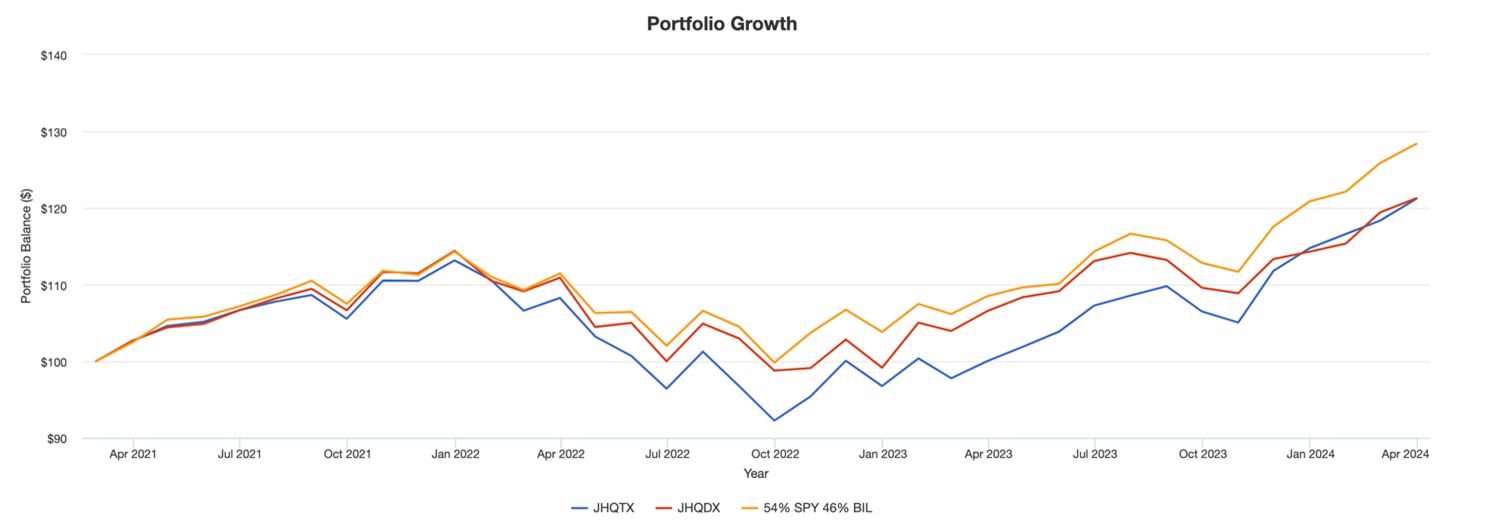
One of my special blessings is the ability to work with folks whose understanding of issues is profound and complex and whose willingness to translate that understanding for your benefit seems boundless. Devesh, having spent a professional lifetime trading billions of dollars in options, completes his Options Trilogy for you this month. In March 2024, Devesh played out recent trends in options markets as he examined the almost manic rush into such funds. This month completes the trilogy with a deeper dive into the workings of options in 10 funds and a reflection on The Options Conundrum, including the question of whether you might not profit more with a Replicant Portfolio: an ultra-low-cost equity index and T-bills. Interested readers should start with Options Based Funds – a deeper dive.

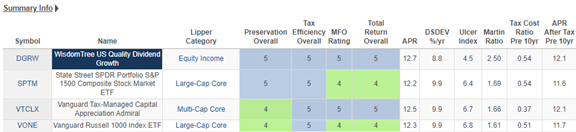
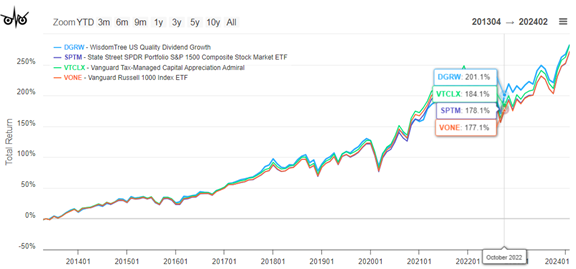
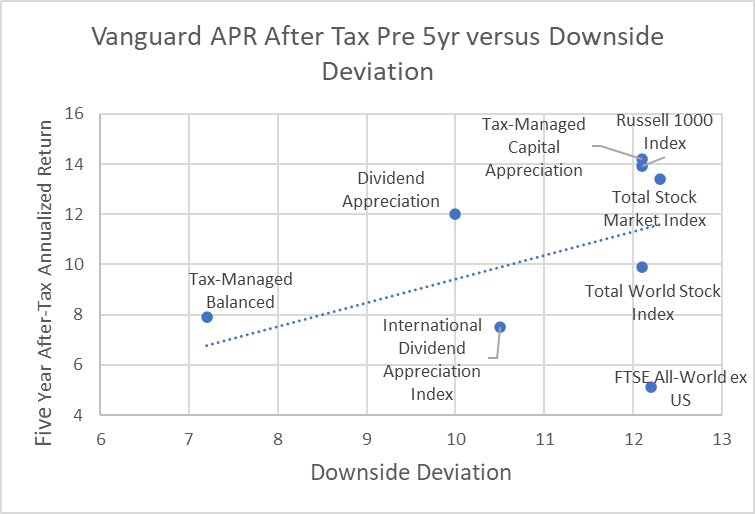
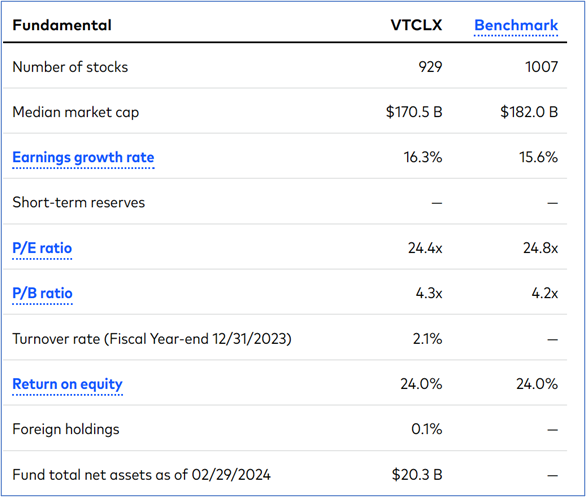
Lynn offers two pieces this month. First, he updates his profile of Fidelity New Millennium ETF (FMIL) by noting that … well, it’s gone. Fidelity launched a suite of active ETFs last month, one of which absorbed and transformed FMIL. Lynn shares his analysis of the suite on offer. Second, he analyzes the options of funds for long-term tax-efficient investing and comes up with two recommendations for you.

Finally, The Shadow brings us up to date on small victories for investors (umm, okay, a bit short there this month), the industry’s new strategies for Green Flight (rename the fund, redescribe the strategy, and, failing that, bail out), and we bid farewell to a near-record number of funds.

My contribution this month centers on this essay, where we’ll look at the market’s illusory calm, two investments you really want to explore, one you might pray to avoid, and a bunch of iterations on the same question: greed or envy, happiness or satisfaction?

I have two projects underway for you that attempt to help you think about strategies for dealing with unstable markets.

Infrastructure investing: as national governments fail to decelerate the rate of climate change, sub-national governments are increasingly planning massive infrastructure expenditures to mitigate some of the effects on human communities. Infrastructure expenses tend to operate in a rhythm independent of the stock market, which makes them useful for diversification. I’ve reached out to teams with three of the most promising funds. So far, I’ve got one “we’ll get back to you” and two dead silences. (Really, guys, take down the d**med “media contact” link if you’re incapable of even a polite “no thanks.”) I’ll continue those outreach efforts.

Quality investing: “quality at a reasonable price” reflects a remarkable market anomaly. The stocks of high-quality firms tend to be underpriced, solid in up-markets, and exceptional in volatile ones. The net effect is higher long-term returns with lower short-term volatility, which (theory says) shouldn’t happen. And it definitely shouldn’t happen consistently. But it does. An easy case can be made for the new GMO US Quality Equity ETF; as a matter of fact, we have made it, Chip was convinced to buy it, and it has easily outperformed its five-star, $10 billion sibling. We’ve been working with a Morningstar strategist who identified ten exceptional funds with an emphasis on quality investing. He shared commentary on each, and we’re still working out an understanding of what is directly quotable and attributable.

Rather than share half-complete projects, we’ve moved both to be featured stories in our May 2024 issue.

And why, you ask, worry about investments for unstable markets when the current market is eminently stable and rising? (Well, except that the Magnificent Seven have been reduced to the Fabulous Four.)

“Markets have a false sense of security”

The Wall Street Journal might be channeling their inner Devesh. They note that there’s been a flood of money into options-backed funds and ETFs, but the news is not all good. Jon Sindreu (3/8/2024) writes:

If you bought so-called structured products recently, you have plenty of company. But is precisely their popularity that could make them – and perhaps the entire stock market – riskier than they seem … The bargain often appeals to less-sophisticated investors who otherwise might not dabble in complex derivatives. For banks they bring in fat fees.

There follows a discussion of one class of derivatives called “autocallables.” At base, banks are the counterparties in the autocallable trade, so they have the incentive to hope for market stability, which, in part, is caused by their own need to buy “insurance” against their exposure to these options. Sindreu summarizes:

So autocallables look attractive because the stock market is calm, but the market is calm because people are buying so many autocallables. The feedback loop is reminiscent of the one created by funds that directly wagered against volatility back in 2017 and 2018. When a bout of selling broke the cycle, banks stopped hedging, volatility exploded and the market tanked.

His conclusion: you shouldn’t trust the Vix as a gauge of potential trouble. Quoting Jeffrey Yu of BNY Mellon, “Low volatility begets low volatility. Until something goes wrong.”

A week later, a second Journal writer echoed the warning:

The stock market is calmer than it has been in years. Some worry that a popular strategy is contributing to the tranquility.

Measures of market volatility have fallen to levels last seen in 2018 …

Investors are seeking protection from potential losses by pouring money into [covered-call ETFs] … assets in such funds has topped $67 billion, up from $7 billion at the end of 2020.

Their argument is that this sort of herd trade (in volatility ETFs) “blew up in spectacular fashion six years ago.” The options trade now exceeds stocks in value, with every covered-call position necessarily matched over an opposite position in “call overwrites.” The concern is that this is a complex, leveraged structure that might be catastrophically vulnerable to an external shock that causes a cascading rush to the exits. (See Charley Grant, “Popular bet weighs on volatility,” WSJ, 3/26/2024, B1. It’s online with a paywall and a slightly different title.)

Both are good pieces and remind us that the best time to patch the roof is before the rain begins. Our May features are aimed in that direction.


Good news, good guys, GoodHaven

Morningstar Magazine featured GoodHaven Fund, which we profiled in July 2023 (“The Rise of GoodHaven Fund“), in their March 2024 issue. Our quick summary:  remarkable turnaround. Distinctive portfolio. Disciplined manager.

We, and they, both note the manager’s principled decision to revamp his strategy in late 2020. The idea was to focus more on “special situations” only if they were demonstrably “special” and “quality at a reasonable price” strategy rather than focusing on purely statistical measures of cheapness.

It’s working.

Comparison of 3-Year Performance (April 2021 – March 2024)

  APR Max drawdown Downside deviation Ulcer
Index
Sharpe
Ratio
Sortino
Ratio
Martin
Ratio
GoodHaven 17.3% -17.8 10.1 6.6 0.86 1.44 2.19
Multi-Cap Value peers 8.6 -18.0 10.8 6.4 0.35 0.55 1.06
S&P 500 11.5 -23.9 11.6 10.0 0.50 0.75 0.88

Source: MFO Premium fund screener and Lipper Global data feed

How to read that?

Returns: APR means the annual percentage return for the period

Risks: the maximum drawdown and downside deviation (called “bad deviation”) measure downside volatility for the period. In those cases, lower is better.

Risk-return balance: the Ulcer Index measures how far an investment falls and how long it takes to rebound. Smaller (as in “it gave me a smaller ulcer”) is better. The Sharpe, Sortino, and Martin ratios assess an investment’s returns against an increasingly high risk-management bar; that is, Martin is much more risk-averse than Sharpe. In each case, higher is better.

By those measures, GoodHaven has been a uniform and consistent winner. Morningstar frets that the fund “may not have broad appeal” because it doesn’t fit neatly into a box. So I guess if you care about boxes, you might turn to The Container Store. If you care more about performance, you might add GoodHaven to your due diligence list.

Microcap equity funds worth attention

I contributed, in partnership with Mark Gill, to a piece entitled “Microcap Funds” in the March 6, 2024 issue of Bottom Line. Bottom Line is a sort of cool “a bit of this and a bit of that” newsletter that covers personal topics from finance to nutrition and scholarship sources. I contribute occasionally. Mark and his editors assess reader interest in various topics, and one of the writers reaches out to talk with me. We talk. I share thoughts and data. He drafts, I revise.

The premise is that microcaps are profoundly undervalued relative to a bunch of measures and tend to perform exceptionally well when interest rates begin to fall since that often signals a period of economic acceleration. The MFO Premium screens identified about ten options, and Mark picked up on three.

With a bit more space, I would have urged him – and you – to investigate Pinnacle Value (PVFIX), which is a five-star fund managed by John E. Deysher. The fund embodies a low turnover, absolute value strategy that enables the manager to hold substantial cash when compelling opportunities are few.

Shallow observers will say, “he’s been in the bottom 10% of his peer group four times in the last ten years.” Those who look closer might note that John’s market cap is one-twentieth of his peer group’s, and he’s posted double-digit absolute returns in three of those four years. 2017 is the only actually bad year. In every period we track – whether 3/5/10 year windows or market cycles – Pinnacle’s Sharpe ratio ranges from “much higher” than its peers (50% higher since inception) to “ridiculously higher” (400% higher over the past three years). The fund’s standard deviation is half of the group’s.

One measure of the success of an absolute value strategy is the fund’s vast outperformance, measured in APR or annualized percentage rates, during the recent bear markets.

  2007-09 GFC 2020 Covid bear 2022 bear Full cycle – 2022 bear + subsequent bull
Pinnacle Value -24.8% -23.3 -7.7 12.5
Small value average -53.6 -38.0 -18.0 4.7

John manages about $34 million in assets, barely above where he was in 2015 when we profiled the fund. Our conclusion, then and now, is the same:

Mr. Deysher would prefer to give his investors the opportunity to earn prudent returns, sleep well at night, and, eventually, profit richly from the irrational behavior of the mass of investors. Over the past decade, he’s pulled that off better than any of his peers (2015).

“Irrational behavior of the mass of investors”? Where have I heard that before? Hmmm…

John is a laconic soul, so reading his 2023 Annual Report takes modestly less time than finishing your morning cup of coffee.

Trump in your portfolio

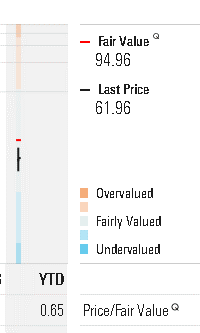
More correctly, Trump Media (DJT). Mr. Trump’s company, formerly Truth Social, is now publicly traded on the Nasdaq exchange. Over the week preceding April 1, 2024, it had a share price of between $43-73, giving it a somewhat volatile market cap. Its peak capitalization was $8 billion. It spent much of the last week of March at around $7 billion and began April at $5.5 billion. In terms of market cap, that’s in the neighborhoods of Etsy, Hasbro, Voya, or Invesco. About 5,000,000 shares a day have been trading hands. In 2023, the company had sales of $4 million (giving it a price/sales ratio of 1200) and lost $58 million (giving it a negative p/e ratio of minus 70). By comparison, the median annual sales of a McDonald’s location in 2020 was $2,908,000.

Because accounting is magical, the company reported a $50.5 million profit in 2022 on $1.5 million in revenue.

Because computers are magical, Morningstar’s algorithms have calculated a fair market value for DJT at $94.96 (as of April 1, 2024).

Not interested, you say?

You might not have a choice. The listing criteria for stocks in the Russell 3000 index are:

  • Listing on a US stock exchange
  • A share price above $1.00 on a ranking day at the end of May
  • A market cap above $30 million
  • A free market float of more than 5% (that is, more than 5% of the company’s total shares must be trading on the open market)

We have reached out to FTSE Russell, part of the London Stock Exchange Group, to understand their inclusion process but have not yet received a response.

Professional athletes and the economics of envy

There’s been a lamentable lot of commentary lately about National Football League players on $40 million/year contracts who deserve $60 million contracts. Their insistence on holding out for those last few millions reflects the fact that “they gotta take care of their families.”

Really?

The average American “takes care of their family” on $51,480 a year. (The Census reports household rather than individual incomes; the median there is $75,000 in 2022.) Loves them, hugs them, goes to their Little League games and piano recitals, cleans up their messes, and binds their wounds, psychic and physical. A 2014 study by the Georgetown Center on Education and the Workforce concluded, “Overall, the median lifetime earnings for all workers are $1.7 million,” with substantially higher payouts for folks with a BA ($2.3M), MA ($2.7M), PhD ($3.2M, and really I’ve got to find someone to sue over the gap between me and what I’m apparently owed) and MD/JD ($3.6M).

I am, as many of you know, a kid from Pittsburgh. In 1977, in the midst of a span in which the Steelers won four Super Bowls, future Hall of Fame players Joe Greene and Lynn Swann made $60,000 / year, approximately four-and-a-half times the average income for all Americans that year. Of course, they played for a guy, Art Rooney Sr., who walked to work every morning. In 2024 terms, a future Hall of Fame player making four and a half times the average income would be hauling in a cool $230,000 a year!

In reality, $40 million contracts reflect that you and I are much more interested in watching sports events than in participating – a parent-coach, sponsor, ref, athlete – in one. Our rapt attention to their fantasy world underwrites vast contracts and, occasionally, delusional behavior. You might not be more happy getting out to the (local) ballfield, but at the end of the day, you might find yourself rather more satisfied. Which cues …

In memoriam … Daniel Kahneman (March 5, 1934 – March 27, 2024)

Dr. Kahneman passed away at the age of 90 after a life well and fully lived. He was recognized by The Economist as the world’s seventh most influential economist. That’s striking because (a) our fetish for meaningless rankings makes me smile, and (b) he wasn’t an economist.

By “wasn’t an economist,” I mean “never even took a single Econ course in college.”

Kahneman was a professor of psychology whose work, along with Amos Tversky, laid the basis for the disciplines of behavioral economics and behavioral finance. His fundamental achievement was to categorize the consistent patterns of cognitive weirdness; others then found ways to make uncounted billions by exploiting those patterns. His book Thinking: Fast and Slow (2011) contains findings central to my teaching on propaganda and mass manipulation, but it’s also central to the curriculum of business programs across the country. Dr. Kahneman received the Nobel Prize in 2002, the Presidential Medal of Freedom in 2013, two dozen honorary doctorates, and countless professional awards, including the Leontief Prize for contributions that “support just and sustainable societies.”

His less-known work on happiness and satisfaction aligns with my opening reflections in this letter. Kahneman and colleagues did rather a lot of work on the subject, only to discover that most people don’t want to be happy. They want to be satisfied. Happiness, he concluded, was the fleeting sensation of joy in a particular moment. It was evanescent. Satisfaction, he argued, “is a long-term feeling, built over time and based on achieving goals and building the kind of life you admire.”

Charlie Munger would, I think, understand. Stepping through the doorway of your million-dollar home and basking in the awe of your friends might make you happy. Living in an unassuming home and spending part of each week building shelters for others – as Lynn Bolin does and Jimmy Carter did – might be a surer road to satisfaction.

Thanks!

Thanks to Tom & Mes from TN, our old friend Gary in PA (I’ll share a bit more in May, but I’m very confident this will be a great year), and John of Honolulu.

To our faithful subscribers: Wilson, Gregory, William, William, Stephen, Brian, David, and Doug. The monthly reminders of your support mean a lot.

In the May Observer, I look forward to the case for infrastructure funds, quality investing, two fixed-income options, and general merriment. We hope to see you there!

david's signature

Funds For Long-Term Tax-Efficient Investment (VTCLX, DGRW)

By Charles Lynn Bolin

It’s a good practice to take a thorough review annually of investment performance including fees and taxes. A dual-income household may accumulate a half dozen or more accounts because of tax characteristics, ownership, and goals. A good way to start is to list the accounts in order of planned withdrawals. The next step is to make sure that each account has the appropriate amount of risk and that the assets within are tax-efficient for the type of account. I am in the process of converting Traditional IRAs to Roth IRAs and the conversion is taxed as ordinary income. Municipal Bonds are included in Modified Adjusted Gross Income and may impact Medicare Premiums (IRMAA). In after-tax accounts, income is taxed while stock appreciation is not until sold and then often at lower capital gains rates. This is known as the Bucket Approach.

Our review found that we were paying over one percent of assets to have one special purpose, after-tax account managed with a 50% Stock to 50% Municipal Bond Ratio. It is a relatively small, but significant account that I had set up during uncertain times to be tax efficient. In the hierarchy of withdrawals, it will be the last account tapped. The appropriate goal for this account is for capital appreciation and simplicity while minimizing taxes. I use Fidelity and Vanguard wealth management services for some of our investments, and in the context of overall portfolio management, I am looking for a single tax-efficient equity fund to “buy and hold” for this account.

This article is divided into the following sections:

Investment Objective

Collectively, my investments resemble a 60% stock/40% bond diversified portfolio, in part because I have pensions and Social Security to cover most living expenses and can withstand down markets. I concentrate Bucket #1 (Living Expenses) on short-term cash equivalents such as municipal money markets and bonds. Bucket #2 is mostly Traditional IRAs where taxes are yet to be paid and which have higher allocations to taxable bonds. Long-Term Bucket #3 consists of Roth IRAs and After-Tax Accounts which are concentrated in equities that are tax-efficient if held for the long term or using tax loss harvesting.

My goals for this one fund are 1) to have high after-tax returns, 2) to minimize income and taxes, and 3) to have respectable risk-adjusted returns as measured by the MFO Rating. This typically means an equity fund that pays low dividends and has low turnover.

Search Criteria

Table #1 shows the criteria that I used for the initial search. I restricted the mutual funds to Fidelity and Vanguard. While volatility is not a major consideration for this fund, I wanted to eliminate the most volatile funds.

Table #1: Search Criteria For Tax-Efficient Funds

Source: Author using MFO Premium Fund Multiscreener & Lipper Global Data Feed

Summary Of Lipper Categories

After a process of elimination, the search resulted in 32 mutual funds, and eighty-four exchange-traded funds in twenty-three Lipper Categories as shown in Table #2. The categories are sorted from the highest five-year After-Tax Annualized Return/Ulcer Index. The Ulcer Index is a measure of the depth and duration of drawdowns. The top section shaded in blue contains the Lipper Categories that I am most interested in, but I also want to consider global funds from the middle section.

Table #2: Tax-efficient Lipper Categories

Source: Author using MFO Premium Fund Multiscreener & Lipper Global Data Feed

Short List of Tax-Efficient Funds – Five-Year View

I then went through the funds in each of the Lipper Categories and selected one or two based on after-tax return, fund family rating, and tax efficiency, among other criteria. The nine funds in Table #3 are outstanding tax-efficient funds.

Table #3: Short List of Tax-efficient Funds – Five Years

Source: Author using MFO Premium Fund Multiscreener & Lipper Global Data Feed

Figure #1 shows the five-year performance of these funds. The two global funds have underperformed, but this doesn’t concern me because of stretched valuations in the US.

Figure #1: Performance of Short List of Tax-efficient Funds – Five Years

Source: Author using MFO Premium Fund Multiscreener & Lipper Global Data Feed

Final List of Tax-Efficient Funds – Ten-Year View

I then looked at the funds over a ten-year period. All of the funds in Table #4 are outstanding, but I favor Vanguard Tax-Managed Capital Appreciation (VTCLX) and WisdomTree US Quality Dividend Growth (DGRW). Figure #2 shows the ten-year performance of these funds.

Table #4: Final List of Tax-efficient Funds – Ten Years

Source: Author using MFO Premium Fund Multiscreener & Lipper Global Data Feed

Figure #2: Performance of Final List of Tax-efficient Funds – Ten Years

Source: Author using MFO Premium Fund Multiscreener & Lipper Global Data Feed

Vanguard Tax-Managed Capital Appreciation (VTCLX)

I decided to invest in the Vanguard Tax-Managed Capital Appreciation Admiral Fund (VTCLX). The link to the documentation is here. Figure #3 shows how VTCLX compares to other Vanguard funds for After-Tax Returns versus Downside Deviation. It has high after-tax returns but roughly matches the total market for volatility.

Figure #3: APR After-Tax Pre-5Year Versus Downside Deviation

Source: Author using MFO Premium Fund Multiscreener & Lipper Global Data Feed

Product Summary

“As part of Vanguard’s series of tax-managed investments, this fund offers investors exposure to the mid- and large-capitalization segments of the U.S. stock market. Its unique index-oriented approach attempts to track the benchmark while minimizing taxable gains and dividend income by purchasing index securities that pay lower dividends. One of the fund’s risks is its exposure to the mid-cap segment of the stock market, which tends to be more volatile than the large-cap market. Investors in a higher tax bracket who have an investment time horizon of five years or longer and a high tolerance for risk may wish to consider this fund complementary to a well-balanced portfolio.”

Fund Management

Vanguard Tax-Managed Capital Appreciation Fund seeks a tax-efficient total return consisting of long-term capital appreciation and nominal current income. The fund tracks the performance of the Russell 1000 Index—an unmanaged benchmark representing large- and mid-capitalization U.S. stocks. The advisor uses portfolio optimization techniques to select a sample of stocks that, in the aggregate, reflect the characteristics of the benchmark index. The technique emphasizes stocks with low dividend yields to minimize taxable dividend distributions. In addition, a disciplined sell process minimizes the realization of net capital gains and may include the realization of losses to offset unavoidable gains. The experience and stability of Vanguard’s Equity Index Group have permitted continuous refinement of indexing techniques designed to minimize tracking error and provide tax-efficient returns.

Table #5 contains the fundamentals for VTCLX and Table #6 contains the sector allocations.

Table #5: VTCLX Fundamentals

Source: Vanguard

Table #6: VTCLX Sector Allocation

Source: Vanguard

Closing

Over the next ten years, converting this 50% Stock/50% Bond account to DIY with one equity fund should result in saving thousands of dollars in fees, increase returns, and reduce taxes. It fits into an overall balanced portfolio and meets my objectives of keeping it simple. Currently, this account has a mixture of quality ETFs. I will gradually convert them over to the Vanguard Tax-Managed Capital Appreciation (VTCLX) when market conditions are favorable.

Options Based Funds – a deeper dive

By Devesh Shah

Introduction:

In the March 2024 MFO, I introduced the two main developments in Options in recent years.

Zero-Day Options and Options-Based Funds. We learnt about the history of options, the market players involved and benefitting from Options, and started getting deeper into the Funds.

In April MFO, through the 2nd and 3rd articles in the series, I hope to dive deeper into Options-based funds.

In this article, I want to understand the motivations of the investors in these funds and of the fund managers involved. We want to look at a small selection of these funds qualitatively so we can appreciate the diversity within the Options Based Fund universe.

From Stocks & Options to Options-based Funds

Options buyers have one of two goals in mind: leverage or protection.

Option sellers are on the other side of this coin. By underwriting protection or leverage, option sellers are rewarded with option premium, which is repackaged and called “income” by some. 

Options-based funds have two components:

  1. The first is to pick an equity sleeve: S&P 500 Index, Large Caps, Value stocks, Nasdaq, Actively Managed or Passive, etc.
  2. The second is to repackage the three themes of options market players: leverage, protection, and income.

Every Options fund is a combination of an Equity Sleeve and an Options strategy.

A Twist in Time

Equities are considered permanent instruments. If a company survives in its current form, the stock lives on permanently. Once an investor buys a stock, there is nothing further to do to preserve the status as a partial owner of the enterprise and earn its profits and dividends.

Not so with Options. Each Option comes with a time frame. Zero-day options literally expire the same day (0 days). A 1-year option expires after a year, etc.

A Twist in Strike/Price

An investor is a long stock at whatever price they buy the stock.

Not so with Options. Each Option comes with a Strike Price. At the Option expiry, one compares the Strike price of the Option vis-à-vis the then Stock price to determine if the Option expires in-the-money or out-of-the-money.

Options-Based Funds: All this activity must mean Options Funds are Active Funds

Options-based funds have to make 4 choices (maybe 5 choices)

  1. What’s the equity sleeve going to be?
  2. Is this fund going to provide leverage, offer protection, or earn income?
  3. What’s the maturity of the options expiry the manager chooses?
  4. What’s the strike price of the options the manager chooses?

The 5th choice: Should the options traded match the Equity sleeve?

But why do we need Options Based Funds? (a) Financial Democratization

Despite the exponential increase in options volumes over the decades, many investors have not participated in options. The jargon, the pricing, the trading and execution, and a host of other obstacles have kept investors away.

The goal of the management teams offering Options-based funds is to continue on the journey of options democracy. If professional fund managers can offer their options skills, end investors might get the benefit from the power of options without paying the cost of education. Instead, the cost is paid through a fund management fee. This is not much different than Active or Passive Funds charging investors a fee to put together a long Equity or long Bond portfolio we call a “fund”.

As the chart below shows us, Options-based funds have picked up momentum starting in 2018. The Y-axis shows the number of Options funds with current assets greater than $50mm started in each year.

But why do we need Options Based Funds? (b) A different way to achieve Portfolio Smoothing

Many of the readers will be familiar with a 60/40 Stock-Bond portfolio. When Stocks zag, the hope is that Bonds will zig. Together, the portfolio will be smoother. By diversifying across asset classes (stocks and bonds), and within asset classes (portfolio of stocks), an investor hopes to earn the risk premium embedded in asset classes while smoothening the ride.

Options Based Funds offer yet another approach to Portfolio Smoothing: 10 funds close-up

I asked @yogibearbull to define Beta of an ETF/(stock portfolio) to our readers.

He wrote, “beta of an ETF comes from linear regression of monthly returns with monthly benchmark returns (SP500 for US equity funds). Beta is the slope, or short-term volatility; alpha is the intercept, or manager’s magic. An ETF with beta of 0.80 means that if SP500 went up +1% that day, the ETF will likely go up +0.80%.”

Broadly speaking, the lower the beta of a portfolio, the lower the volatility. While a 60/40 lowers the portfolio’s overall beta through the negative correlation between stocks and bonds, Options funds lower the beta through the selection of the Active Sleeve and the Options strategy.

For example, JHEQX, the JP Morgan Hedged Equity Fund, an $18 Billion fund, has been around for 10 years. Here are the annual betas of this fund according to Portfolio Visualizer:

Year 2014 2015 2016 2017 2018 2019 2020 2021 2022 2023 2024 ytd
Beta 0.56 0.48 0.61 0.24 0.39 0.53 0.30 0.45 0.41 0.55 0.43

The Beta of JHEQX to the S&P 500 has never been higher than 61%. In fact, the average Beta of the fund since 2014 has been 43%.

Thus, this fund would never make 100% of the returns of the S&P on the way up AND would never lose as much as the S&P on the way down.

For many investors, this lower beta is IMPORTANT. Why?

To be candid, investors want to both be in US equities and not fully committed. Investors are willing to trade off some return for a smoother path.

Options Based Funds thus offer the promise of smoother returns.

The Many Shapes and Sizes of Options Funds:

  On S&P 500 On NDX On Singles On Global
Overwriting/Income JEPIX/JEPI, GATEX, GSPKX, DIVO JEPQ, QYLD TSLY, NVDY, YieldMax ETFs EXG, ETW, BOE
Hedged Equity JHEQX, JHQDX, BUFR CIHEX    
Put underwriting GLSOX, IRONX      

This table is another way to show the different strategies employed by Fund managers and the different equity sleeves. There are over 300 funds, so, this is just a gross classification. Each fund is built differently. 

By Size

These are 23 funds with over $1bn USD AUM. I’ve created a table with the top 36 funds with assets of $600 million and higher.

Take a close look at the 4th column labeled APR (Annualized Percent Return).

Some funds like RYLD (Fund #20) have returned only 3.02% a year.

Others like JEPQ (Fund #3) have returned 17.59% per year.

We also see that Yields (5th column) and Sharpe ratios (6th column) vary dramatically across funds.

Options funds are quite different enough in their make-up, which explains the differences in Returns, Yield, and Sharpe Ratios.

One thing we can rely on to be similar for all these funds is an Expense Ratio that’s more in line with Actively Managed funds. 83bps average of all the funds in the group excluding the largest ETF, JEPI (Fund #1), which has a reasonable expense ratio of only 0.35%.

Let’s take a closer look at some of these funds. I’ve tried my best to capture the essence of the funds. I am taking a little liberty with the details to keep us moving:

  1. JEPI and JEPIX: JP Morgan Equity Premium Income (#1 and #6 above)

The Open-ended fund, JEPIX was launched in Sep 2018, and the ETF, JEPI, in May 2020. Together they hold almost $39B in assets. While the stock portfolios are slightly different between the fund and the ETF, they are the same to us. JEPI has a lower Exp. Ratio than JEPIX.

The funds hold a low beta, low volatility stock portfolio. They intend to pick stocks actively and hold about 130 stocks (not the 500 stocks in the S&P 500). Each week, the fund sells an ~2% Out-of-the-money call on the S&P 500 on ~ 20% of the Notional portfolio.

Such a fund employs a strategy known as “Covered Call Overwriting”. By selling calls on 80% of the portfolio at any given time, they hope to earn income from the option premiums. Along with the dividend earned on the underlying stocks, these funds have a high distribution rate of between 8 to 12% since inception.

Why does this fund attract money: Investors like steady distributions from dividends and call premiums. They like the idea of picking stocks that have a lower beta than the SPX. Investors understand their upside is capped in exchange.

  1. DIVO: Amplify CWP Enhanced Dividend Income ETF (#10 above)

DIVO with $3B in Assets also uses a Covered Call Overwriting. It has even fewer stocks in the portfolio (28 stocks). DIVO writes 1month call options on some of these stocks (about 7 or 8 stock options).

We start seeing how these products differ. One writes calls on the S&P 500 Index, and the other writes call options on some individual stocks.

One holds a low beta portfolio of 130 stocks, the other holds only 28 stocks.

  1. GSPKX: Goldman Sachs US Eq Dividend and Premium (GSPKX) (Fund #9)

Been around since 2005 with assets of about $3.5B. This fund is a Covered Call Overwriting similar to JEPI/JEPIX. It holds 280 actively picked stocks and sells Call Options on the S&P 500 Index. The fund tries to preserve the upside by overwriting ~40% of the Notional portfolio. When future volatility is high, and call prices are thus higher than average, the fund may sell as little as only 15% of the Notional in call options.

  1. BDJ: Blackrock Enhanced Dividend Trust (Fund # 17)

This is one of various Blackrock funds that offers call overwriting along with long equities. 80% of the $1.7 Bn fund is invested in US Equities and the remaining 20% in the UK and Europe. This fund’s equity sleeve holds more than just US stocks, which makes it different than the funds above. The fund overwrites a part of the portfolio by selling 1-2 month calls on a fraction of the stocks. Like many other overwriting funds, Blackrock’s Investment approach for this fund is built on 3 pillars: Portfolio built on Dividend growth, Focus on High-Quality Companies, and Seeks to Reduce Portfolio Volatility.

  1. JEPQ: JPMorgan Nasdaq Equity Premium Inc ETF (Fund #3)

As the name says, the fund is the Nasdaq 100 equivalent of JEPI and JEPIX (Fund #1 and Fund #6). The underlying stocks are Nasdaq 100 stocks (it actually holds 87 stocks and Nasdaq futures) and it writes call options on the Nasdaq 100 Index. The fund has $11.4B in assets.

  1. QYLD: Global X NASDAQ 100 Covered Call ETF (Fund #4)

Similar to JEPQ in that the fund holds Nasdaq 100 stocks. It sells a 1-month Nasdaq At The Money Spot calls (that is, each month it sells a call on the Nasdaq close to the level of the market at the time of trading the call option). QYLD has $8.1B in assets.

Each of these funds is a painting. The fund manager decides which underlying stocks to buy, hopes they have some alpha in stock picking (or they might own the passive index), collects dividends, decides whether to sell call options on the S&P 500, on the Nasdaq 100, or on a small section of the stocks, what percent of the notional portfolio to overwrite, and the length of these options. Given the Assets held by these funds, it’s safe to assume that people want to invest in these call overwriting, income-generating, funds.

I’ve only pointed out a few of the larger buy-write funds focused on US stock portfolios. There are similar funds on Emerging Markets, on International Indices, and on Global Indices. Almost every bank offers their clients direct exposure to buy-write strategies through Over-the-counter structured products. The sizes involve dwarf the sizes in these listed funds. Before we close out the buy writes, I’d like to point out a fund strategy that is starting to accumulate assets quickly.

  1. YieldMax ETFs: TSLY, NVDY, APLY, CONY, OARK… (not in the table above)

These funds own just one stock or ETF each – Tesla, NVIDIA, Apple, Coinbase, ARKK, etc. Each week they write out of the money call options expiring on the coming Friday.

Their idea is to take the call overwriting and the distribution from option income to the extreme. As an example, NVDY, YieldMax™ NVDA Option Income Strategy ETF, a $ 300mm fund holds $300mm of NVIDIA stock and sells $300mm of weekly calls. Over a year, if volatility stays high, the fund will overwrite NVIDIA 52 times (52 weeks). The distribution rate will be 109.59% (that is if you take what the fund pays out in income from options sold and multiply by 12).

TSLY, YieldMax™ TSLA Option Income Strategy ETF, has an annualized distribution rate of 62.7%.

What’s going on here? There is a lot of options speculation. Billions are being spent on Options by all stripes of investors. This fund wants to sell to those buyers. There’s now over $2B in the over 15-20 ETFs offered by this fund family.

A recent article pointed to 2 approved ETFs that will overwrite Zero-day options daily. If you like weekly overwriting, you are going to love daily!

Moving on, we next look at some Hedged Equity Funds now.

How is a Hedged Equity fund similar to and different than the Call Overwriting funds?

The similarity is in the Equity sleeve, or the underlying stocks, indices, or baskets held by Hedged Equity Options fund. Just as the Overwriting funds could own either the S&P 500, or the Nasdaq, or a small group of stocks, or an international index, the same goes for Hedged Equity funds. They could be passive or actively picked stocks.

The difference is how the two categories use Options. Overwriting funds only sell calls. Hedged Funds use Options to provide a downside buffer. Many funds are buying Puts or Put Spreads to control the losses of the Equity Portfolio. Most of these funds will sell Calls to finance some or all of the costs associated with buying the Puts or Put Spreads.

By adding Puts/Put Spreads, the fund manager hopes to dampen the effects of selloffs on an equity portfolio. For some investors, smooth returns are more important than large returns. Although it is the job of equities to generate volatility on the way to earning compounded returns, not everyone can take the volatility punches.  

  1. GATEX: The Natixis Gateway Fund has been around since 2001 (Fund #5)

This $ 6.5B AUM fund owns 219 actively picked Stocks + a put collar. A put collar is a combination of long put and short call.

The fund sells ~ 2-month S&P 500 call options, which are ~2% out of the money (that is, 2% above the market level at the time of selling the options), and it does so on 95% of the notional value of equities held.

The fund also holds Put Options on about 95% of the portfolio. The fund has bought puts on the S&P 500 Index, which are ~ 2 ½ months out and ~ 6.5% below the market level.

  1. JHEQX/JHQTX/JHQDX: JPMorgan Hedged Equity, Hedged 2, & Hedged 3 Fund (Fund #2, #7, and #13)

These are three different JP Morgan funds, very similar to each other, and separated only by a small twist. Together, they have $25 Billion in Assets, making them one of the biggest strategies in the market. All 3 funds hold around 170 US large-cap stocks (thus, actively managed).

If we dive deeper into one of the funds, JHEQX, which has been around since 2014, we see the fund owns a “Put-Spread-Collar” (PSC). The fund owns a 3-month hedge by buying a 95% Put, selling the 80% Put, and financing this Put-Spread with a Call so the out-of-pocket is zero at the time of the trade. This Strike of the call depends upon the cost required to purchase the 95-80 Put Spread.

The idea is that an investor in this fund:

  1. Holds Actively Managed Large Cap Equities (more or less like the S&P 500)
  2. Earns the dividend
  3. Takes the stock market risk for the 1st 5% of the portfolio
  4. Is protected starting 5% all the way to 20% sell-off in the market
  5. Then, takes all of the downside once again after 20%
  6. Caps Equity upside at approximately 6% from the current level

JHEQX executes this Put Spread Collar every 3 months in Dec, March, June, and Sep.

The other funds, JHQTX and JHQDX, do it Jan, April, July, October and Feb, May, Aug, Nov respectively. There are no other conceptual differences between these funds.

Having $25 Billion in a strategy is no joke. This tells us that the market yearns for a product like this. Thus, we now see hundreds of funds that offer some kind of “Hedged”, “Buffered”, “Capped”, “Protected” in their investment mandate.

  1. BUFR: First Trust FT Vest of Buffer ETFs (Fund #8)

A final example of a Hedged fund is BUFR. The ETF itself is made up of 12 monthly ETFs, so it’s a fund of funds. It owns an equal 8.33% weight in funds FJAN, FBEB, FMAR….FDEC.

FJAN is itself made up of only four 1-year options. If we peel the union FJAN is:

  1. Long the S&P 500 Index (it does this through options)
  2. Long a 100-90 Put Spread (as opposed to the 95-80 Put spread we saw above)
  3. Short a Call 13-14% above the market

Because it holds no stocks at all and replicates its long S&P 500 Index exposure through Options, there are some funky things this FJAN and thus BUFR can do which improve tax treatments for a very specific group of investors.

FJAN alone has $750 million in Assets and BUFR has $3.5 Billion in assets.

The same fund manager offers Buffer, Moderate Buffer, and Deep Buffers for every single month and tens of other ETFs.

Diversity of the Many

Each of these funds is a painting. The fund manager decides which underlying stocks to buy, hopes they have some alpha in stock picking (or they might own the passive index), collects dividends, decides whether to sell call options on the S&P 500, on the Nasdaq 100, or on a small section of the stocks, what percent of the notional portfolio to overwrite, and the length of these options. In the Hedged funds, the manager will want to own puts or put spreads along with all of the above.

Conclusion

The goal thus far in the article was to pick out some large funds and show how they are similar and different to each other. I hope the reader has a sense of the diversity in these funds.

Diversity and variety are a good idea, but does it make money? Is it financially good? How can we compare such different funds to decide if they are a smart investment?

We hope to look at that in the 3rd article.

The Options Conundrum: Fund Comparisons, Performance, and Risk

By Devesh Shah

Having looked at the qualitative rationale for why options-based funds are offered by fund managers and sought by some investors, it behooves us to quantitatively analyze options funds’ performance. There is no ONE BENCHMARK that can be used to compare ALL the options funds. That may be a good thing. It’s made me think of what a good way to create a customized benchmark for each fund might look like. The benefit of keeping things focused on the small picture is we can look at one fund at a time, in detail, without drawing too many generalizations.

Challenges with option fund performance comparisons

The majority of option funds have only been around for a few years. This creates challenges in evaluating their performance. For example:

  1. It’s not possible to run 10, 20, or 30-year analyses on a large enough sample of these funds and we cannot evaluate the funds as an Asset class.
  2. Diversity within the options-based funds makes it difficult to compare any 2 funds. One of the goals of the accompanying article was to point out the different types of Equity sleeves and the differing choices made by fund managers. We can’t compare Large-cap Tech stocks to small-call International value stocks any more than we can compare option income/premium funds to hedged equity funds. Add the funky new class of funds that carry just one stock and overwrite daily or weekly options. There is NO PEER group here. Peer Averages mean nothing.
  3. The last major 50% equity market crash was in 2007-2009. Most of these funds didn’t exist in that crash or the 2000-2002 50% crash. We don’t know how these funds will perform in the next major crash. (PS: There will always be a next major crash no matter how good everything looks at the moment).
  4. The importance of observing active option portfolios through a stock market crash (even bearish portfolios) is to learn how the fund manager deals with coincident problems of illiquidity, high transaction costs, and volatility to get in and out of stocks and options. Derivative markets need deep liquidity in underlying stocks. In crashes, when this liquidity disappears, derivative market makers simply walk away or show absurd prices. How will that affect options funds? We don’t know yet.
  5. When funds have a young age, their performance records are dictated by the timing of the launch and not necessarily the long-term merit of a strategy. There is no need to get too excited about every new options strategy. Active equity picking, high fees, and the burden of trading a large number of derivative contracts all add up as costs. Options exchanges and options market makers are raking in tons of revenue. Who’s paying for it? Don’t look around. It’s all the money going into Zero Day options and options funds.

Challenges with option fund performance comparisons: the S&P 500 is an unbeatable index

When I am introduced to any new US Equity linked fund, my first instinct is to compare it to the S&P 500. Is the fund unique in any way that can help my portfolio grow?

Comparing equity options funds to the S&P 500 (or the Nasdaq 100 where applicable) yields predictably disappointing total results.

To understand why, we must focus on Fund Betas.

The S&P 500, that is, the market in US equities, by definition has a Market Beta of 1.

The Betas of most of these options funds (orange squares in the chart) are lower than 1 (the S&P 500 marked by the Green mountain range).

Since US equity markets have gone up over the years, a lower beta = lower market exposure = lower total returns.

It’s important to capture the proper window for calculating returns. I’ve tried to do that below.

Using the narrow list of funds we qualitatively described in the accompanying article, I show each fund’s launch date (Column 4) and the evaluation window (Column 5). Then, in Column 6, I look at the Annualized return of the fund since that date and compare it to the Annualized Return of SPY in that window (Column 7).

Comparing Columns 6 and 7 should point out that other one fund, JPMorgan Nasdaq Equity Premium Income (JEPQ), no other large options fund beat the simple passive SPY. What a bummer!

Column 8 compares the Fund’s annualized returns to the SPY’s to show what % of the SPY the fund earned.

Table 1

On average, this small selection of funds mostly underperformed SPY.

(Fund #3) JEPQ earned 112.1% of SPY while (Fund #5) GATEX earned only 49.4% of the SPY.

Why did JEPQ make money? Because the Equity sleeve is the Nasdaq 100 type names. Nasdaq beat the S&P massively since the 2009 bull market started.

However, QYLD did not succeed. Why? Reason #1, while JEPQ sells out-of-the-money calls on the Nasdaq to earn Income, QYLD sells At-the-money calls. In an index going straight up, how we use options matters. Reason #2, QYLD has been around since 2013 while JEPQ is younger. It’s another lesson to wait and slow down. New funds have a timing good luck/bad luck factor.

Take a truer comparison. For JEPQ and QYLD, let’s use QQQ instead of SPY and we get this:

Table 2

JEPQ no longer looks like a star and QYLD looks like a total dud.

In any case, this analysis in incomplete. Looking only at the Total Return does a disservice to the options funds. There are other metrics like the fund’s relative St. Dev to the SPY, Betas, or the Sharpe ratios, the worst drawdowns, etc. Let’s take one of those metrics and stretch our analysis.

Comparison to the S&P 500: Standard deviation matters

Investors’ expectation is not that options funds would earn higher returns. Rather, investors hope the funds will exhibit lower volatility and make the ride smoother. The investors hoped to still earn some of the equity returns with lower volatility than the market.

Table 3

In fact, that’s very much the case. In the above table, calculated using Portfolio Visualized, I’ve highlighted our small group of funds, this time, in Columns 9 and 10, I’ve presented how volatile the fund has been during the window on an annualized basis versus the volatility of the Market. We’ve used % Annualized Standard Deviation as a measure. In Column 11, we show the St. Dev of the fund as a % of the SPY.

We can see that all except (Fund #17) BDJ had a lower standard deviation than the SPY with the triplets of JHEQX/JHQTX/JHQDX (Fund 2, 7, 13) showing the lowest Std. Deviation compared to the SPY.

BUFR (Fund 8) is not far behind.

These funds are common in that these last 5 funds in that table are “Hedged”, “Protected”, or “Buffered” and intend to provide downside protection. The ones above tend to be Income providers and provide no downside protection.

In layman’s terms, this is a vindication of the fund managers’ advertisement pitch and the investor’s hopes: Lower returns accompanied with lower volatility.

Combining the two tables above, I’ve plotted the Return % of these funds and the Std Dev of these funds compared to the SPY. In short, returns between 50-90% with a volatility of 50-90% of the SPY.

Chart 1

Creating a replicating portfolio to push our analysis even further:

Why should we allow options funds an easy pass? In financial markets, there are multiple way to get to the same end point. We now know that options funds have a lower Beta to the S&P 500 (as calculated through Portfolio Visualizer)

Table 4

Let’s take just one fund, JEPIX, which is the Mutual Fund equivalent to JEPI. Together they hold a combined $39 Billion in assets. Using Portfolio Visualizer, I checked the Beta of JEPIX for each calendar year since its inception in Fall of 2018.

Table 5

JEPIX Betas change dramatically from year to year and seem to be on a downward trend recently.

Why does the Beta move so much year to year? It could be the Equity Sleeve and which stocks go in the portfolio. Perhaps the fund managers have a lower volatility portfolio of stocks in 2024 compared to 2013. It could also be the interaction of the options used with the Equity Portfolio and their combined effect.

It doesn’t matter. These funds are constantly changing their underlying characteristics because they are Actively managed. We can’t tell what the Fund manager is thinking. What we CAN DO is tell what the historical Betas have been.

In the case of JEPIX, the story is that this Fund has a lifetime of 0.62 to the S&P 500 Index.

Proposal: Create a Replicating Portfolio

We know that the beta of the S&P 500 (which stands for the market index in the USA) is 1 and we know the Beta of T-Bills is 0. T-Bills have zero beta because these under 1-year Government instruments have nothing to do with the Stock Market. They are short-term obligations of the US Government issued by the Department of Treasury to fund the Government.

We can combine a simple 2 fund portfolio of SPY and T-Bills with the ratio of 61% SPY and 39% BIL (the T-Bill ETF). They won’t have a Beta exactly of 0.62 (in fact, according to Portfolio Visualizer), the 2-fund Replicating Portfolio has a Beta of 0.59 during our Replicating window of Sep 2018 to March 2024. That’s fine. We are shooting for simplicity.

Furthermore, we can choose an option for Annual Rebalancing in portfolio visualizer so the SPY+BIL portfolio rebalances to 62% SPY every calendar year. (If we don’t do that, SPY will keep becoming a bigger % of the portfolio. We want to match the approximate Beta of JEPIX on average over its life).

I ran that simple 2-fund portfolio in Portfolio Visualizer alongside JEPIX. Charts and statistics:

Chart 2

Do you see the difference between the blue line JEPIX and the red line, Replicating portfolio?

NO? Because there isn’t any. The two charts look almost the same. Maybe a little more return in some periods and give back in others, but the differences are minuscule.

Table 6

$100 invested in JEPIX and the 2-fund portfolio would be equal just about the same 5 ¼ years since launch.

For some investors, it might not matter that JEPIX is no better than a simple 62/38 SPY/BIL portfolio. That it’s earned 9% annualized is good enough. My goal is not to get investors to buy or not buy a fund. It is to help simplify and demystify a fund.

Our analysis brings us as close to home as we can expect to be. If we can take all the magic provided by all the financial products and simplify it so we can understand how we can reconstruct that magic ourselves, then we might feel a little more confident in our decision-making process.

Let’s take a case where the results are NOT equal: GATEX

Step 1: Determine a window to calculate Beta. Let’s go with 7 years

Table 7

Step 2: Equivalent Portfolio = 46% SPY 54% T-Bill for period 2018 to 2024 March. Choose Annual Rebalancing in Portfolio Visualizer

Step 3: Output 1: Chart3

Output 2: Metrics: Table 8

GATEX underperforms the Replicating Portfolio by 2.77% per year with a higher Standard Deviation than the Replication.

By all metrics, GATEX cannot beat a passive replicating portfolio. It has a larger max drawdown and a worse Sharpe Ratio.

Let’s take a case where the options fund works well: JPMorgan Hedged Equity Fund (JHEQX).

Step 1: Determine a window to calculate Beta. Let’s go with 7 years

Table 9

Step 2: Equivalent Portfolio = 41% SPY 59% T-Bill for period 2018 to 2024 March. Choose Annual Rebalancing in Portfolio Visualizer

Step 3: Output 1: Chart 4

Output 2: Metrics

Table 10

JHEQX had a higher annualized return of 1.4% over the last 7 years than its Replicating Portfolio, albeit also slightly higher standard deviation.

JHEQX is a good example of an option fund that has so far worked.

Proper evaluation is hard work

We only studied a small number of the over 300 funds dedicated to this space, evaluated an even smaller number, and so we don’t want to make too much out of our analysis.

Evaluation requires some work for each fund. It’s not plug-and-play because the Replication portfolio for each fund needs to first be determined based on the past Beta of the options fund.

We need a history for each fund. We can’t do this analysis for a new fund until we’ve seen its beta versus the S&P.

Since I cannot do this for 300 options funds, (and new funds are starting every day), my goal was to set a framework that others can build on.

Let’s talk about the fund that looks decent: JPMorgan Hedged Equity Fund (JHEQX)

JHEQX is a low-beta fund. At the 0.41 beta, it did a good job outperforming the equivalent SPY and T-Bill portfolio. An interesting follow-up here would be the newer JHQTX and JHQDX, designed in the same vein as JHEQX. As Chart 5 below shows, the Replicating Portfolio’s Orange line beat them both. Maybe the funds need more time? Every time we think options funds might outperform, we peel the onion, and the evidence calls for more time or more analysis.

Chart 5

The Equity Sleeve

Before we conclude, I want to point out that choosing the right Equity Sleeve is very important. A long Nasdaq equity sleeve was so powerful over the last 10-years that it washed away any crimes committed on the options legs.

On the other hand, choosing EM or Developed Market Passive Equity sleeve could have been a terrible choice. No amount of options cleverness would have dissolved the crime of being invested in a passive EM ETF.

Coming to an end: There is a reason why people buy/hold these funds

We took a disparate group of options-based funds and united them. We showed that Total Returns and standard deviation had to be looked at in sync and we accomplished this through the fund’s historical betas, created replicating portfolios, and used the fund’s return series to compare to the replicating portfolios. Our results are important because they are grounded in simplicity, and anyone can replicate the results. Anyone can determine if “their” fund holds water.

While analyzing quantitatively is important, we should remember people buy these funds for at least a few different reasons:

  1. Their brokers/advisors sell them the funds
  2. Investors are not interested in creating low-beta portfolios and rebalancing
  3. Earning income used to be important in a zero-rate world. Options funds had a place. With T-Bills at 5.25%, maybe the options for Income funds need to be rethought. But once invested, the inertia to take money out is great. Investment products are sticky.
  4. Tax bills are always a hindrance.

If we visit David Snowball’s thesis, “30% Equity Allocation gets you a majority of the stock market’s returns but skip most of the volatility”, we can appreciate the beauty of low-beta portfolios (the success of JHEQX). Some options Funds promise and deliver the low beta portfolios. Some funds do it better than others (= GATEX) and it’s our job as end investors to pick the good ones and ignore the poor ones.

While options-based funds hold no magic bullets, and a majority of their returns can be replicated by simple SPY+T-Bill portfolios, there will always be a demand for options funds. For as long as investors have been invested in risky assets, they have wanted a smoother ride.

Mystery Solved: Fidelity Actively Managed ETFs (FMIL >= FFLC)

By Charles Lynn Bolin

I wrote Outperforming Actively Managed ETFs last month in the Mutual Fund Observer Newsletter and described Fidelity New Millenium Fund (FMIL) in my “Short List of Great Owl Funds”, but before the newsletter was published, FMIL just up and disappeared! Several members brought it up in the Discussion Board – FMIL Confusion. Fortunately, Charles Boccadoro has solved the mystery by finding “Q&A: Fidelity to Introduce Fundamental Active ETF Suite”.

Fidelity New Millennium ETF (FMIL) has gotten a new name, “Fidelity Fundamental Large Cap Core ETF (FFLC)” under new management with lower fees. FFLC is also transparent which means that you can see what it is invested in daily while FMIL was not. FFLC is part of the new Fidelity Fundamental suite which seeks to “deliver new opportunities and value… while also expanding our investment options to help meet demand for access to equity strategies…”

Upon a little more research, Fidelity rolled out the new “Fundamental” Suite of funds on February 14th. The purpose of creating this new suite was described by Greg Friedman, Fidelity’s Head of ETF Management and Strategy as, “This launch builds on our legacy of active management through the ETF wrapper, as we continue to leverage both our fundamental approach along with quantitative construction techniques.”

I trust Fidelity to develop new technology and products; however, I am not satisfied with this rollout. I wrote Fidelity Actively Managed New Millennium ETF (FMIL) for the September 2022 MFO newsletter which compared FMIL to its mutual fund counterpart, FMILX. One of the drawbacks as noted by Morningstar is that the FMILX strategy is “contrarian, valuation-conscious approach is distinctive but lacks consistency over time and warrants an Average Process rating…” Okay, there is room for improvement in FMIL.

Change is good – that is good change is good while change for the sake of change is often disruptive. I have changed my investment strategy over my investing lifecycle, some for the good and some not so good. I now invest through Fidelity and Vanguard and use their wealth management services to manage over half of our investments. In particular, I have rationalized taxes as part of my bucket approach. My allocation to stock has increased, and I do less trading and more investing for the long term. This past month, I added to my positions in American Century Avantis All Equity Markets ETF (AVGE) to get closer to my desired allocation. I like the diversification of AVGE.

I had FMIL on my short list of funds that I may want to buy for the long term. As bond ladders mature, I may be looking for an additional fund such as FMIL – Oops! – FFLC to add. What is this new creature?

Fidelity Fundamental Large Cap Core ETF (FFLC)

Fidelity Fundamental Large Cap Core ETF seeks long-term growth of capital. The ETF will normally invest at least 80% of assets in equity securities of companies with large market capitalizations, which for purposes of the fund, are those companies with market capitalizations similar to companies in the Russell 1000 Index or the S&P 500 Index.

Okay, this description is not very helpful. What does Fidelity say about the “Fundamental” suites?

The Fundamental ETFs are designed to provide investors access to Fidelity’s industry leading active management and bottom up research capabilities across the equity investment universe. The investment process applies a quantitative portfolio construction process that seeks to extract and combine the highest conviction investment ideas from multiple Fidelity portfolio managers within a respective asset category, market cap, or style and then optimize the portfolio to ensure style box consistency through a defined risk management process. These investment options not only look to capture Fidelity’s highest conviction ideas within these areas, but also look to deliver strong risk-adjusted returns over the long-term while serving as core equity building blocks.

Again, this description is not informative enough for me to invest my hard-earned money, but it has piqued my interest. Let’s take a look at the Prospectus.

Using an investment process that starts with fundamental analyst research and security recommendations, and reference portfolios managed by Fidelity Management & Research Company LLC (FMR) (the Adviser) that are based on fundamental analysis, and then applying a quantitative portfolio construction process designed to emphasize securities in which the Adviser has high conviction subject to appropriate security and portfolio-level risk, liquidity, and trading characteristics.

 …Prior to February 26, 2024, the fund was named Fidelity ® New Millennium ETF, and the fund operated under certain different investment policies. The fund’s historical performance may not represent its current investment policies.

But I liked FMIL! Will I be disappointed in FFLC or like it better? I compared data from the MFO MultiSearch tool for FMIL that I had saved to FFLC. Even though the fund has changed, the history of FMIL has transferred to FFLC with the update for fund fees and managers. The Fundamental suite also offers growth, value, and small-cap versions, but as someone trying to simplify, I prefer a core approach, but a tilt toward value has potential.

From “Outperforming Actively Managed ETFs”, I used Portfolio Visualizer to create a portfolio of actively managed ETFs to maximize the Sharpe Ratio (volatility adjusted returns) as shown below. To select my next fund, I will consider FFLC among other actively managed ETFs but will take into account that only the information after February 2024 is representative of the new strategy.

So, the mystery of the disappearance of FMIL has been solved. I would have preferred more advance notice of impending changes. Perhaps it was kept quiet as part of a competitive strategy? I will follow its replacement, FFLC, with interest, but as always, a cautious skepticism.

By the way, I did sign up for the Fidelity Newsroom Alerts.

Briefly Noted…

By TheShadow

Updates

The marriage is off: the planned merger of BlackRock Capital Appreciation Fund and BlackRock Large Cap Focus Growth Fund has been canceled. No word on why.

Morningstar Magazine featured GoodHaven Fund, which we profiled in July 2023 (“The Rise of GoodHaven Fund”), in their March 2024 issue. Our quick summary: remarkable turnaround. Distinctive portfolio. Disciplined manager. “May not have broad appeal,” because it doesn’t fit neatly into a box. Still, it’s drawing attention.

Briefly Noted . . .

Carillon Chartwell Income Fund has become the Carillon Chartwell Real Income Fund; with subsequent changes to its investment strategies to incorporate the “real” income stuff.

On February 2, 2024, Guardian Capital Group Limited announced that it had entered into a unit purchase agreement to acquire 100% of the ownership interests of Sterling Capital Management. The closing is expected to take place in the second quarter of 2024. Guardian has indicated that, following the closing, it plans to operate Sterling Capital as a standalone entity, led by the current team of management and senior professionals, providing continuity, stability, and continued excellence for Sterling clients.

Hartford Schroders Sustainable International Core Fund, Hartford Sustainable Income ETF, and Hartford Global Impact Fund will no longer automatically exclude certain companies from the investment universe but will continue to use sustainability criteria to determine the funds’ investment universe.

RWC Asset Advisors has terminated its expense limitation agreement for Redwheel Global Emerging Equity Fund, as a consequence of which expenses pop from their capped limit (1.25%) to a range from 1.3% (Institutional) to 1.64% (no-load retail).

Effective April 3, 2024, WisdomTree Enhanced Commodity Strategy Fund and WisdomTree Managed Futures Strategy Fund both gained the right to invest in bitcoin through exchange-traded products.

Old Wine, New Bottles

Effective May 1, 2024, the American Beacon Bridgeway Large Cap Growth Fund becomes American Beacon Man Large Cap Growth, with the attendant loss of its Bridgeway managers.  The Large Cap Value Fund undergoes the same transformation, and a team from Numeric Investors takes over.

Several Alliance Bernstein funds are in the process of becoming Alliance Bernstein ETFs. “Trans funds” of a short, we suppose.

AB Short Duration Income Portfolio AB Short Duration Income ETF June 7, 2024
AB Short Duration High Yield Portfolio AB Short Duration High Yield ETF June 7, 2024
AB International Low Volatility Equity Portfolio AB International Low Volatility Equity ETF July 12, 2024

As a yet-undetermined moment in the third quarter of 2024, two Aquila funds will become two Cantor Fitzgerald funds.

Disappearing fund Surviving fund
Aquila High Income Fund Cantor Fitzgerald High Income Fund
Aquila Opportunity Growth Fund Cantor Fitzgerald Opportunity Growth Fund

“Effective on the Effective Date,” AXS First Priority CLO Bond ETF will be renamed Alternative Access First Priority CLO Bond ETF. While the advisor changes from AXS to AAF, for all material purposes the fund will remain the same.

Community Capital Management is now the advisor for the CCM Affordable Housing MBS ETF (OWNS), which was previously sub-advised by Impact Shares. Investments in OWNS include home loans in census tracts where more than 50% of the population is non-white and at least 40% of the population is living at or below the poverty line. Additionally, OWNS includes loans in counties where 20% or more of the population has lived in poverty for more than 20 years and loans to minority borrowers or loans originated in a census tract where more than 50% of the population is a minority.

As of June 1, 2024, Columbia International ESG Equity Income ETF and Columbia U.S. ESG Equity Income ETF each ditch the term “ESG” in their names becoming Columbia International Equity Income ETF and Columbia U.S. Equity Income ETF, respectively.

On June 10, 2024, the First Trust Mid Cap US Equity Select ETF, which you likely don’t know exists, becomes the First Trust SMID Capital Strength Index ETF. At base, it will track an index that “provides exposure to well-capitalized small and mid-sized companies with strong balance sheets, a high degree of liquidity, the ability to generate earnings growth, and a record of financial strength and profit growth.”

On or about May 22, 2024, Franklin MicroCap Value Fund will become Franklin Mutual Small-Mid Cap Value Fund with attendant changes of strategy.

Effective March 29, 2024, the $60 million Inspire Faithward Mid Cap Momentum ETF will change its name to Inspire Momentum ETF. The fund has a fine performance record, fwiw.

As of April 1, 2024, Global X Emerging Markets ETF (which has no direct exposure to China) has been rechristened Global X Emerging Markets ex-China ETF, and Global X Data Center REITs & Digital Infrastructure ETF has become Global X Data Center & Digital Infrastructure ETF (DTCR), with a new ticker.

Janus Henderson seemed to have found a new way to play the “green flight” game. Janus Henderson Sustainable Corporate Bond ETF will soon become the vanilla Janus Henderson Corporate Bond ETF. But (nudge, nudge, wink, wink) it’s still an ESG fund. The key is “the Repositioning” of the fund away from “giving special consideration” to ESG factors to “instead, integrating ESG factors as part of its investment process only.”

Umm… one wonders what qualifies as “special consideration”? Under the original mandate, were the managers acting to incorporate considerations that did not contribute positively to the fund’s performance? That is, after all, the ESG argument: such factors are “material.” In that case, shame on them.

Or is this just a shell game, lowering the public profile of the ESG factors in order to dodge political heat while still considering the factors as they always did?

On June 21, 2024, Charles Schwab will make what appears to be utterly inconsequential tweaks to the names of five of its funds. It does not appear that there are any substantive changes following the tweaks.

Current Names New Names
Schwab Fundamental US Large Company Index Fund Schwab Fundamental U.S. Large Company Index Fund.  It appears they added periods after U and S.?
Schwab Fundamental US Small Company Index Fund Schwab Fundamental U.S. Small Company Index Fund. Okay, more periods!
Schwab Fundamental International Large Company Index Fund Schwab Fundamental International Equity Index Fund. Equity subs for Large Company.
Schwab Fundamental International Small Company Index Fund Schwab Fundamental International Small Equity Index Fund. Equity subs for Company.
Schwab Fundamental Emerging Markets Large Company Index Fund Schwab Fundamental Emerging Markets Equity Index Fund. Again, equity subs for Large Company.

On May 1, 2024, Voya Global Multi-Asset Fund becomes Voya Global Income & Growth Fund with a revised management team and a target allocation of 33% high yield, 33% convertibles, and 33% equities and/or call options.

Off to the Dustbin of History

AAM/Phocas Real Estate Fund will be liquidated on or about April 26, 2024.

AGF Global Infrastructure ETF, AGF Global Sustainable Equity Fund, and AGF Emerging Markets Equity Fund will all be liquidated on April 30, 2024.

AXS Multi-Strategy Alternatives Fund and AXS Sustainable Income Fund will be liquidated on or about April 26, 2024.

abrdn Emerging Markets Sustainable Leaders Fund will be reorganized into its abrdn Emerging Markets ex-China Fund, The reorganization is expected to be completed sometime during the second quarter of 2024.

Anfield Diversified Alternatives ETF will be liquidated and dissolved on or about April 26, 2024.

Astor Macro Alternative Fund will be liquidated on or about April 29, 2024.

BlackRock Global Impact Fund spares us further tales of woe, as of April 29, 2024. The fund, with about $8 million in AUM, has a record of startlingly consistent underperformance.

BNY Mellon US Equity will be terminated on May 17, 2024.

The Castle Has Fallen! Castle Focus Fund was leveled, effective March 7, 2024.

The ClearBridge All Cap Growth ESG ETF is merging into the ClearBridge Large Cap Growth ESG ETF. The transaction is currently expected to be completed on or about June 14, 2024.

The Defiance Pure Electric Vehicle ETF turned off its lights forever on March 28.

A bunch of Delaware funds are transitioning in phases. Phase One: fund mergers. Phase Two: year-end rebranding.

The disappearing fund The surviving fund The surviving fund’s new name, as of 12/31/2024.
Delaware Ivy Accumulative Fund Delaware Ivy Large Cap Growth Fund1 Macquarie Large Cap Growth Fund
Delaware Select Growth Fund Delaware Ivy Large Cap Growth Fund1 Macquarie Large Cap Growth Fund
Delaware Mid Cap Growth Equity Fund (formerly, Delaware Smid Cap Growth Fund) Delaware Ivy Mid Cap Growth Fund2 Macquarie Mid Cap Growth Fund
Delaware Small Cap Growth Fund Delaware Ivy Small Cap Growth Fund3 Macquarie Small Cap Growth Fund
Delaware Ivy Core Bond Fund Delaware Diversified Income Fund4 Macquarie Diversified Income Fund
Delaware High-Yield Opportunities Fund Delaware Ivy High Income Fund5 Macquarie High Income Fund
Delaware Ivy Value Fund Delaware Value Fund6 Macquarie Value Fund
Delaware Global Equity Fund Delaware Ivy Global Growth Fund7 Macquarie Global Growth Fund
Delaware Global Equity Fund II (formerly, Delaware Global Value Equity Fund) Delaware Ivy Global Growth Fund7 Macquarie Global Growth Fund
Delaware International Equity Fund (formerly, Delaware International Value Equity Fund) Delaware Ivy International Core Equity Fund8 Macquarie International Core Equity Fund
Delaware International Equity Fund II (formerly, Delaware Ivy International Value Fund) Delaware Ivy International Core Equity Fund8 Macquarie International Core Equity Fund

Fidelity Latin America Fund will be reorganized on a tax-free basis with and into Fidelity Emerging Markets Fund on September 13, 2024.

Fidelity Global High Income Fund will merge with Fidelity High Income Fund on September 13, 2024.

Franklin Global Dividend Fund is expected to cease operations pursuant to the liquidation of the fund on or about April 12, 2024.

Global X MSCI Next Emerging & Frontier ETF (EMFM) crossed its final frontier on March 15, 2024, while its sibling Global X MSCI Nigeria ETF went to meet the oil prince of its dreams on March 25, 2024.

Homestead Rural America Growth & Income Fund will be liquidated on or about June 12, 2024.

There’s a plan to liquidate and terminate Janus Henderson Adaptive Global Allocation Fund, effective on or about June 12, 2024.

Janus Henderson will liquidate its Mid Cap Value Fund’s class “L” shares on or about May 29, 2024.

MassMutual Main Street Fund will be liquidated on or about August 23, 2024.

Neuberger Berman International Equity Portfolio and Neuberger Berman U.S. Equity Index PutWrite Strategy Portfolio, owing to insufficient assets to operate economically, will be liquidated on April 24, 2024. Neither is a mutual fund.

Northern Multi-Manager Emerging Markets Debt Opportunity Fund was subject to an accelerated liquidation. The original date-of-date was May 3, 2024, but someone got an itchy trigger finger and the fund was liquidated on March 27, 2024.

Subversive Cannabis ETF, Subversive Decarbonization ETF, Subversive Food Security ETF, and Subversive Mental Health ETF were liquidated on March 28, 2024, because “marketing efforts have not proven effective.” MFO note: don’t blame your marketing team. Every one of the liquidated funds had lost money for its investors since launch. And every one of them had a benchmark with had made money in the same period.

TCW Relative Value Dividend Appreciation Fund is merged into the TCW Relative Value Large Cap Fund on or about June 17, 2024.

VanEck Future of Food ETF faces imminent “liquidation, winding down, and termination of the Fund, which is expected to happen on or about Tuesday, April 9, 2024.”

VanEck Environmental Sustainability Fund will be liquidated on April 24, 2024.

Effective March 15, 2024, Virtus Seix High Yield Income Fund was merged into Virtus Seix High Yield Fund.

Effective March 8, 2024, Virtus Vontobel Foreign Opportunities Fund was merged with and into Virtus SGA International Growth Fund and Virtus Vontobel Global Opportunities Fund disappeared into Virtus SGA Global Growth Fund. “The Funds,” they helpfully note, “have ceased to exist.”

Voya International High Dividend Low Volatility Fund will be liquidated on April 26, 2024.

Weiss Alternative Multi-Strategy Fund was liquidated on or around March 29, 2024.