


It has taken me nearly two decades to unlearn what I thought I had learned during my first two decades of investing. I started studying business cycles about 15 years ago which helps me determine how aggressive or defensive I want to be based on risks and trends in the economy and investment environment. This month, I describe how to create a Ranking System that requires about one or two hours per month to update and evaluate funds. The May results and composition of the Model Portfolios can be found in my last Seeking Alpha article, “Low Risk Fund Portfolios In A High Risk Environment” for interested readers.
I have traditionally controlled risk by considering relative valuations of stocks and other assets, the likelihood of a recession, financial stress, and quantifiable factors not picked up on the regular indicators. Here is what I see:
-
-
- Valuations are very high on a forward earnings basis
- Recession odds are 100%.
- Outside risks are extremely high.
- Stock market strength has provided a false sense of security.
- Additional restrictions may be coming.
-
Weighing The Week Ahead: Sustaining A Fragile Recovery, Jeff Miller
Portfolios and Changes
Because we are in a recession with COVID-19 and its unknown effects, I choose to be defensive. I follow four model portfolios that I track in Mutual Fund Observer and Seeking Alpha. Each month, I extract about a thousand mutual funds, exchange-traded funds, and closed-end funds using the Mutual Fund Observer screens to access the Lipper Global Database. I only include funds available at Charles Schwab, Fidelity, and/or Vanguard as no-load, with minimal transaction fees, and low investment minimums. Funds available at Charles Schwab or Fidelity are listed as either “Charles Schwab” or “Fidelity” rather than “Other” as I did in earlier articles.
The performance of baseline funds and the model portfolios are shown below. Ulcer Index is a measure of risk and is the depth and duration of drawdowns. Martin Ratio is the risk-adjusted return and is the risk-free return divided by the Ulcer Index. The data shows that conservative funds are outperforming aggressive funds year to date.
Table #1: Baseline Funds and Model Portfolios – As of the end of May, Metrics are for 2.5 Years
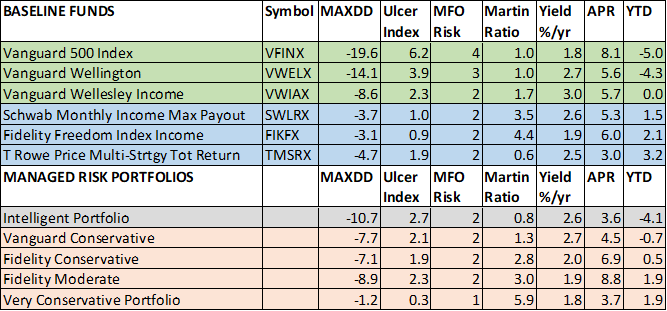
Source: Created by the Author Using Lipper Global Datafeed and the MFO Premium screener
Below is my personal allocation with 26 percent in stocks, 53 percent in bonds, 15 percent in Short-Term investments (including money market funds and certificates of deposit), and 6 percent in gold (Other).
Figure #1: Personal Allocation
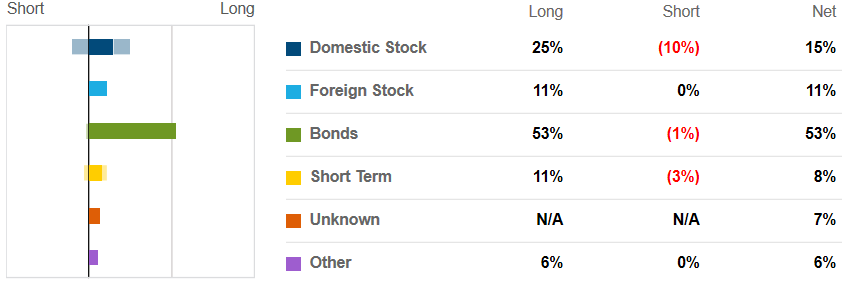
Source: Created by the Author Using Fidelity
This month, I exchanged the Fidelity International Real Estate Fund in the Model Fidelity Moderate Portfolio (because it had the highest Ulcer Index in the Portfolios) and replaced it with the more conservative Fidelity Freedom Index Income Fund (FIKFX) while the market is up. I also exchanged money market funds in the “Very Conservative Portfolio” with the Sit US Government Securities (SNGVX) and Schwab Short-Term Bond Fund (SWSBX). The funds are shown in Table #2 below.
Table #2: Funds Traded or Considered in June
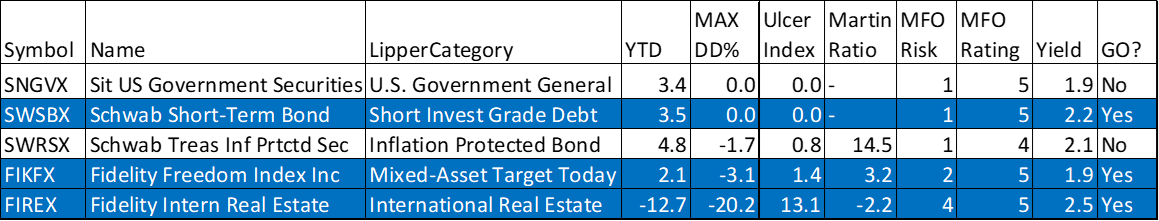
Source: Created by the Author Using MFO Premium screener
The Ranking System
Charles Boccadoro does an incredible job of improving the MFO data and screens available. As someone who prefers to use spreadsheets to select funds rather than screens, this causes problems when the spreadsheet columns are changing. The “Calculations Section” at the end of this article describes how to set up a spreadsheet to be independent of the data format.
Ranking Systems reflect the personal beliefs of the investor. I use the following six Factors: Return, Risk, Momentum, Valuation, Quality, and Income. I use the Excel formula PERCENTRANK to assign a value of 0 to 1 for each of the thousand funds each month for the components of the six factors as shown below. The advantage of the Ranking System is that each fund gets a final value of 0 to 100 with 100 being the “best” fund. (NOTE: the PERCENTRANK value is multiplied by 100 to be on a scale of 0 to 100).
| Return: | MartinRatio, SortinoRatio, APR%/yr, MFORank % |
| Risk: | AlarmRating, UlcerIndex, MFORisk, Average of DownCycle 4, 5, and 6 |
| Momentum: | Trend3 mo, Trend10 mo, 3Months, Fund Flow%AUM, MFORating |
| Valuation: | P/C, P/S, P/E, PremDiscHigh %, PremDiscLow % |
| Quality: | FamilyRating, ERRating, Ageyr, CompositeMFO Rating, Junk, %, Cash %/yrGrowth, Quality |
| Income: | Yield%/yr |
The devil is in the details:
- PERCENTRANK assigns a 1 to the fund with highest value and 0 to the lowest. If the metric is set up where the lowest value is best then “1-PERCENTRANK” can be used.
- MFORisk and MFORating have values from 1 to 5. PERCENTRANK may only assign a value of 0.8 to a value of 5 so I apply a multiplier to normalize the highest value to 1.
- NULL Values “-“ can present problems, such as a Money Market fund has a Martin Ratio of “-“ which causes an error when averaging. I write formulas to either replace the “-“ or ignore it.
- The components of the Factors are averaged to get a temporary factor value which may range of 0.1 to 0.8 as an example so I use PERCENTRANK to convert the temporary average to a value from 0 to 1.
- I use a time period that starts close to January 2018 to reflect the start of the late stage of the business cycle.
Table #3 shows the author’s ranking system for baseline funds. The funds shaded green are the highest ranked funds and suitable for most conservative investors. The funds that are shaded red are ranked very low and should be avoided, in my opinion.
Table #3: Author’s Rank for Baseline Funds
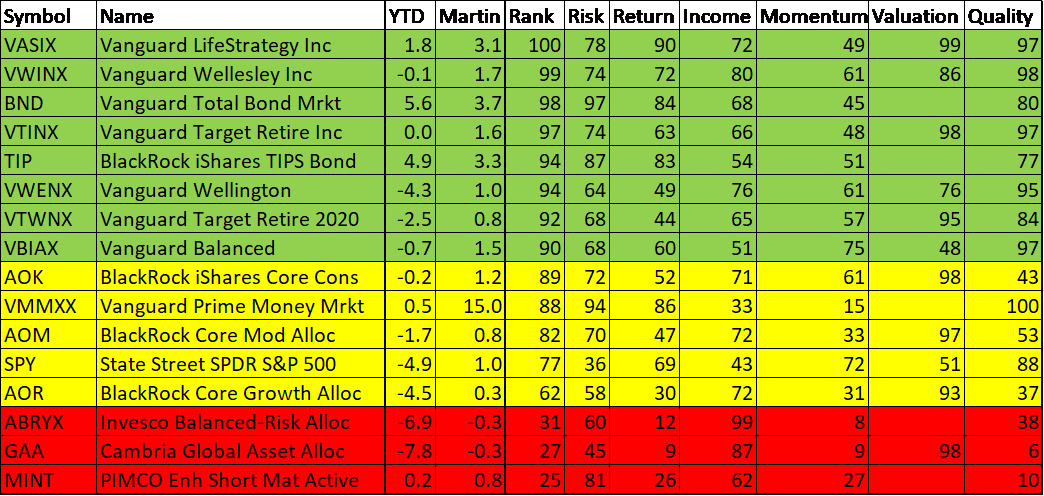
Source: Created by the Author Using MFO Premium
The Bucket System
Investors use the Bucket approach to match market risk with withdrawal needs. I use a four Bucket Approach based on the Ulcer Index with “1” having the risk of money markets and short term treasuries and “4” having the risk of the S&P 500 or higher. For diversification purposes, I have a bucket set up for International/Global Bonds and one for International/Global stocks. I have a separate bucket for Income because high-income funds usually come with their own set risks. Finally, I have two buckets set up to track the business cycle as “Inflation” and “Defensive”. The following table shows the automated results for the top Lipper Category for each of the buckets. By comparison, the Ulcer Index of the S&P 500 is 6.2 and the Martin Ratio is 1. As a general observation, the top-rated funds have an Ulcer Index less than the S&P 500 and a Martin Ratio close to 1.0 or higher.
Table #4: Top Ranked Lipper Categories
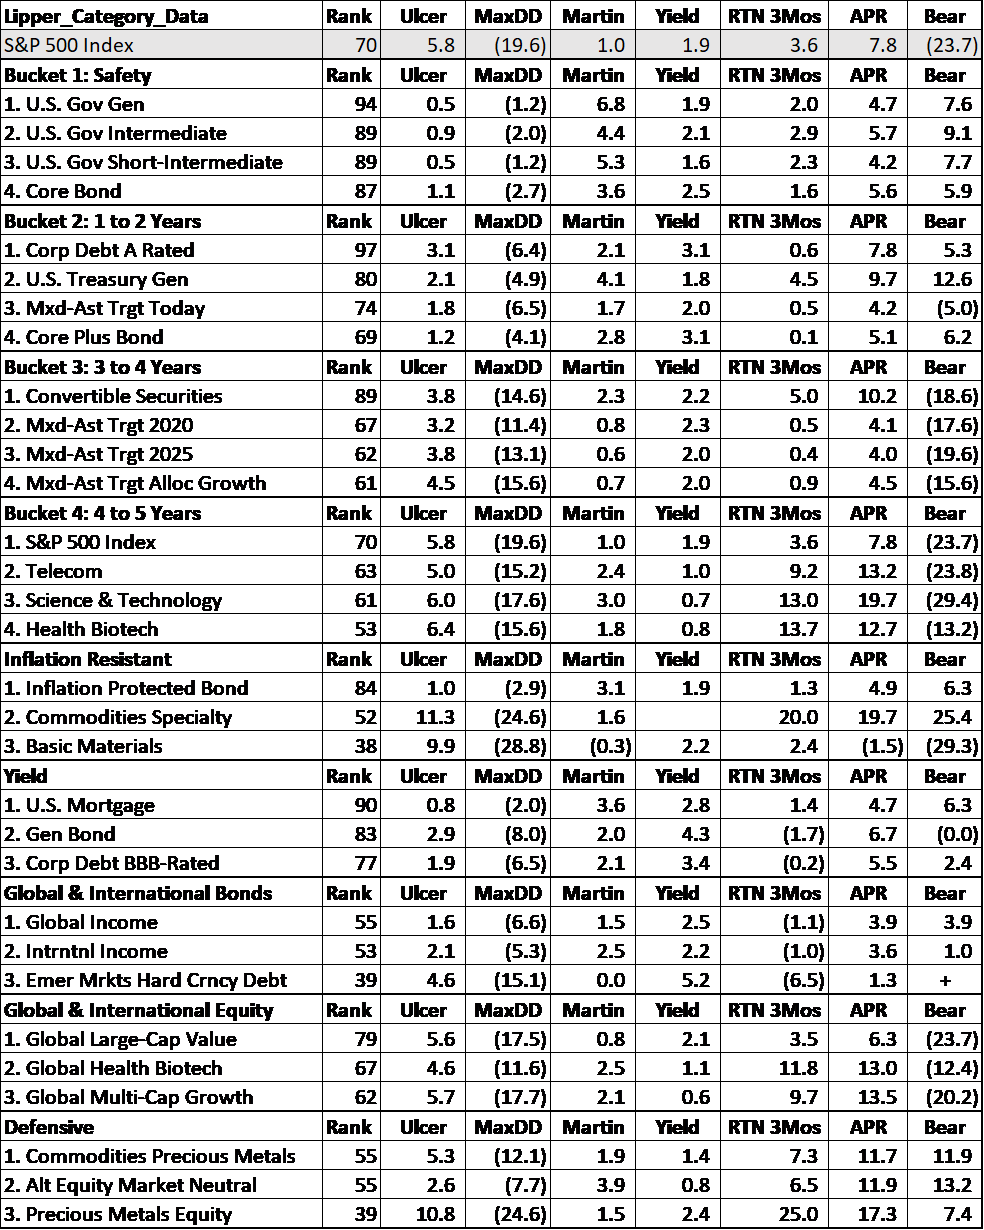
Source: Created by the Author Using MFO Premium
To determine the Top Lipper Category, I put each of the Lipper Categories into one of the nine buckets and sort them by average rank. The Lipper Categories in Bucket #1 (Safety) are shown below. Count is whether Charles Schwab, Fidelity, Vanguard, Exchange Traded Funds or Closed End Funds have a fund in that category. As an example, my Ranking System assigns a rank of 94 (on a scale of 0 to 100) to “U.S. Government General Bonds” and 49 to “Municipal Intermediate Debt”. Only the top three categories are shown in the table for each bucket.
Table #5: Lipper Categories in the Safety Bucket
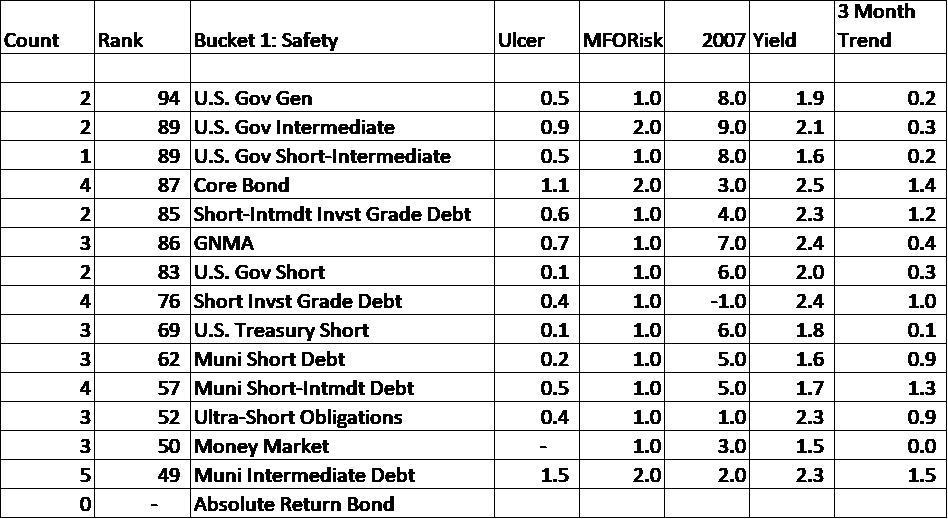
Source: Created by the Author Using MFO Premium
There can be cross over between the buckets as shown in the INCOME Bucket. I use the INCOME Bucket to identify funds with higher yield which is usually associated with higher risk.
Table #6: Lipper Categories in the Income Bucket
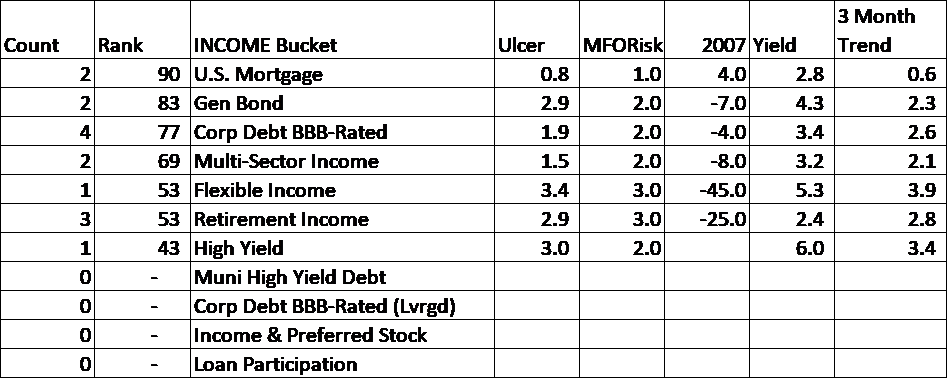
Source: Created by the Author Using MFO Premium
Closing
These are not rosy scenarios. The International Monetary Fund projects that global growth will contract 4.9 percent in 2020 and grow at 5.4 percent in 2021. The Organisation for Economic Cooperation and Development (OECD) describes the uncertainty in the world economy. They describe that the world economy may contract 7.6 percent in 2020 and recover 2.8 percent in 2021. Global GDP will most likely be lower at the end of 2021 than at the end of 2019. This will most likely result in high volatility for the next two years. Volatile times have higher risk and more opportunity for the investor who adjusts portfolios according to the investment cycles.
The Ranking System is built upon the foundation that past trends and behaviors over the recent history and during past market downturns are representative of future behavior. Since history does not repeat itself, but it does rhyme, the Bucket approach is a guideline to diversification. The Ranking System is revised as I have time to review the Mutual Fund Observer metrics.
APPENDIX: The Calculations
In the screenshot below, these funds are pasted into the range starting with CE6. The green cells are metrics that I include in the Return Factor: Martin Ratio, Sortino Ratio, Return during the period, and MFO Rank. Note that the name of the metric is on line 5, while the column titles of the data are on line 6. Cell Z4 contains the equation MATCH which finds “MartinRatio” in line 6 and returns that “MartinRatio” is found in the 92nd column just like “MFORank%” is found in the 134th column.
The equation below then gets the Martin Ratio for VASIX by creating an Excel address for the current row (found by Row “$CE7”) and the 92nd column as described above.
=INDIRECT(ADDRESS(ROW($CE7),Z$4))
In this way, the data that I am interested in is put into known columns independent of the format of the data. Average (Column Y) is the average PERCENTRANK of the metrics. Return Factor (Column X) applies PERCENTRANK to the Average Column. Rank Temp is the average of all six Factors, and Rank (Column M) is my final Rank.
Table #7: Creating a Table Independent of Formatting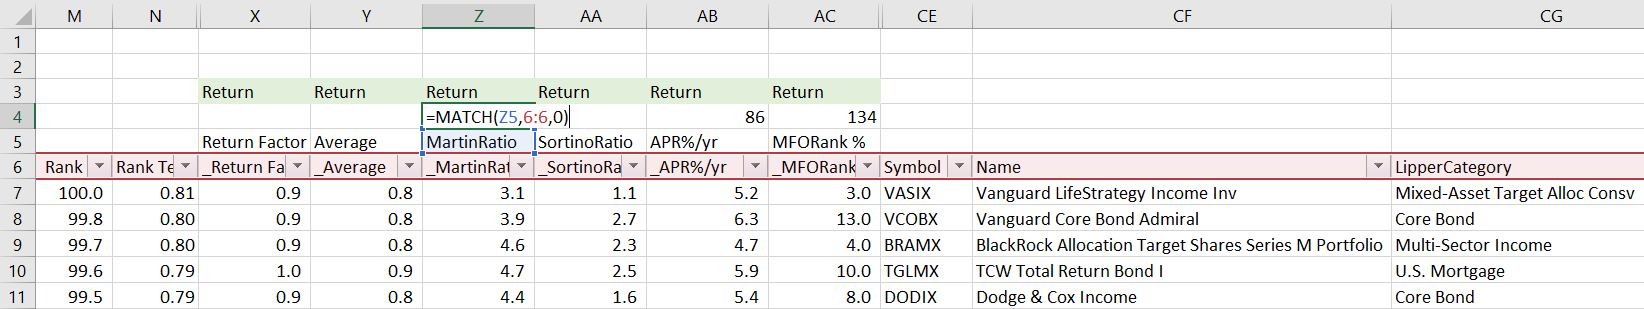
Disclaimer
I am not an economist nor an investment professional. I became interested in economic forecasting and modeling in 2007 when a mortgage loan officer told me that there was a huge financial crisis coming. There were signs of financial stress if you knew where to look. I have read dozens of books on business cycles since then. Discovering the rich database at the St. Louis Federal Reserve (FRED) provides most of the data to create an Investment Model. The tools at Mutual Fund Observer provide the means for implementing and validating the Investment Model.