


Since retiring two months ago, I purchased the actively managed Fidelity New Millennium ETF (FMIL) for diversification. It is one of four actively managed equity ETFs offered by Fidelity that has more than $50M in assets. My introduction to FMIL came from an article by Tezcan Gecgil, “3 Fidelity ETFs To Diversify Your Portfolio In August,” at Investing.com, in which she highlighted that FMIL has done relatively well year-to-date. I then read “ETF of the Week: Fidelity New Millennium ETF (FMIL)” by Aaron Neuwirth from VettaFi, formerly known as ETF Database, which summarizes a podcast by ETF Trends CEO Tom Lydon in “ETF of the Week” with Chuck Jaffe on the MoneyLife Show.
- The Wrapper: A non-transparent ETF clone of a mutual fund
- The Manager and Strategy: Multi-cap growth with value
- Rubber hits the road: Fund performance
The Wrapper: A non-transparent ETF clone of a mutual fund
While FMIL is a new (two-year-old) fund, FMILX is the mutual fund counterpart which is nearly thirty years old and has been managed by John Roth since 2006. Mr. Roth joined Fidelity in 1999 and also manages FMIL. The Fidelity website describes FMIL as:
The fund seeks long-term growth of capital. Normally investing primarily in equity securities. Identifying early signs of long-term changes in the marketplace and focusing on those companies that may benefit from opportunities created by these changes by examining technological advances, product innovation, economic plans, demographics, social attitudes, and other factors, which can lead to investments in small and medium-sized companies. (Fidelity New Millennium ETF)
I favor actively managed funds where the manager has flexibility. Actively managed ETFs are relatively new, but the trend is rising because they offer the benefits of ETFs along with an active management approach. Actively managed ETFs are defined in Investopedia as:
An actively managed ETF will have a benchmark index, but managers may change sector allocations, market-time trades, or deviate from the index as they see fit. This produces investment returns that do not perfectly mirror the underlying index. (James Chen and Charlene Rhinehart “Actively Managed ETF”, Investopedia, June 2022)
The particular twist here is that FMIL is a non-transparent ETF. That is, it does not disclose its holdings daily. That’s a protection offered to the manager who might need a week to either build or unwind a portfolio position; if their activity was disclosed too soon, hedge funds and others would front-run the fund’s trade, driving up costs and driving down returns. Fidelity honestly warns investors about the price that comes with non-transparency:
Traditional ETFs tell the public what assets they hold each day. This ETF will not. This may create additional risks for your investment. For example: You may have to pay more money to trade the ETF’s shares. This ETF will provide less information to traders, who tend to charge more for trades when they have less information. The price you pay to buy ETF shares on an exchange may not match the value of the ETF’s portfolio. The same is true when you sell shares. These price differences may be greater for this ETF compared to other ETFs because it provides less information to traders. These additional risks may be even greater in bad or uncertain market conditions.
VettaFi provides a handy list of active ETFs (“Actively Managed ETFs”). The largest actively managed equity ETF is JPMorgan Equity Premium Income ETF (JEPI) with $12B in assets. Fidelity is relatively new to active managed equity ETFs and has Fidelity Blue Chip Growth ETF (FBCG), Fidelity Blue Chip Value ETF (FBCV), along with Fidelity New Millennium ETF (FMIL). VettaFi classifies FMIL as a “Large Cap Blend Equity” developed markets fund while Factset classifies it as a “Global Broad Thematic” sector fund. Morningstar classifies FMIL as a Large Cap Value Fund and Lipper classifies it as a Multi-Cap Value Fund. The composition will change with the investment environment. FMILX is currently about 85% invested in domestic equities and 11% invested in international equities.
The Manager and Strategy: Multi-cap growth with value
Fidelity Actively Managed New Millennium ETF (FMIL) is a clone of the four-star Fidelity New Millennium Fund, so the shape of that fund and its manager can help us anticipate the ETF’s prospects.
We can see in Figure #1 that the mutual fund (FMILX) and ETF (FMIL) versions have performed very closely since the inception date of FMIL. We can learn how FMIL might perform over the longer-term by looking at the mutual fund version, New Millennium Fund (FMILX).
Figure #1: Comparison of Fidelity New Millennium Mutual Fund and ETF
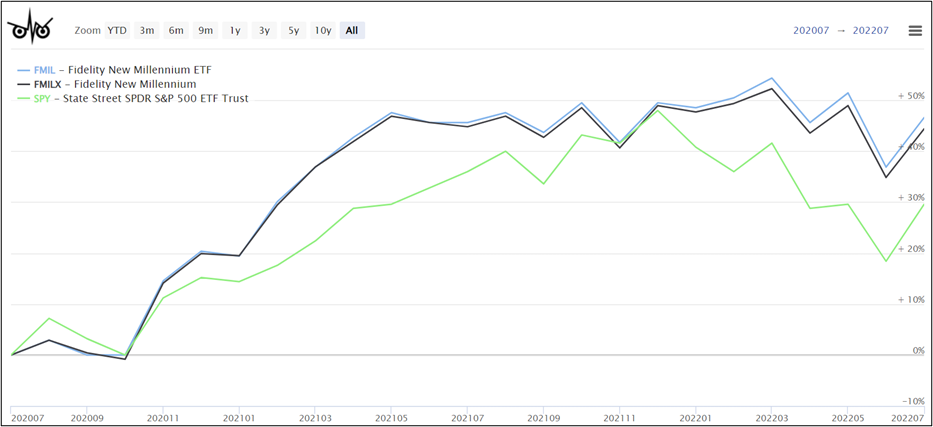
Source: Created by the Author Using the MFO Premium Multi-search Tool
John Roth joined Fidelity in 1999 and has managed Fidelity New Millennium Fund (FMILX) since 2006. He has been part of the management team on a wide array of funds including balanced, mid-cap stock, sector, consumer discretionary, multimedia, chemicals, and utility funds. Fidelity describes the fund’s approach this way; it takes:
- … an opportunistic approach, investing across all sectors, market capitalizations and styles.
- Philosophically, we believe a company’s stock price reflects the market’s collective view of its future earnings power, but the collective view is often wrong.
- We believe bottom-up, fundamental analysis can identify those opportunities where our earnings forecasts deviate from consensus, and where the potential reward for being right is high.
- We look for investment opportunities in emerging growth stocks, where we have a differentiated view on the magnitude of the growth rate; compounders, where we have a differentiated view on the sustainability of the growth rate; and mean-reversion stocks, where we have a differentiated view on the timing, duration or magnitude of the cycle.
- In constructing the portfolio, we size positions by assessing our conviction in the differentiated view on future earnings power versus its potential payoff.
Morningstar agrees that the strategy is distinctive and evolving, but frets that the process has been applied inconsistently,
- Manager John Roth pursues a blend of growth, economically sensitive, and cyclical companies.
- The name count has gradually come down during Roth’s tenure. The number of stocks in the portfolio peaked at nearly 300 in mid-2007, but since mid-2014 it has stayed mostly in the 150-170 range. Roth tends to trade infrequently. Annual portfolio turnover in the past five years has ranged from 22% to 44%.
- This strategy’s contrarian, valuation-conscious approach is distinctive but lacks consistency over time and warrants an Average Process rating…
Morningstar praises Mr. Roth’s “long tenure, overall experience, and access to Fidelity’s vast analyst pool [which] earn this strategy an Above Average People rating…Roth has more than $1 million invested in both this fund and Fidelity Mid-Cap Stock. He draws on Fidelity’s well-resourced equity team, which includes around 60 domestic-focused analysts.”
Shortly after Mr. Roth assumed management of FMILX, it had a maximum drawdown similar to the S&P 500 during the 2008 Global Financial Crisis of just over fifty percent; however, this was better than most multi-cap value funds. The management style of FMILX has changed significantly since then and the analysis in this article focuses more on the past three to eight years.
The ETF has $56M in assets under management, holds 125 companies, and the top ten companies comprise 26% of the investments. Mr. Roth is responsible for the investment strategy and Andy Browder is responsible for trading and execution. The style box from Morningstar shows that FMIL is a diversified multi-cap fund with a “tilt” towards large cap value. Lipper concurs. Over 35% of the fund is in small-cap and mid-cap companies which tends to increase volatility. The manager having the flexibility to select funds across style and size was a factor in my selection of FMIL.
Table #1 shows the sector allocation for FMILX. My Defensive Portfolio is heavy in Consumer Staples, Healthcare and Utilities. I wanted a fund that is tilted toward other sectors but “light” on Technology and Consumer Cyclical. There is an overlap on Healthcare.
Table #1: Sector Allocation of Fidelity New Millennium Fund (FMILX)
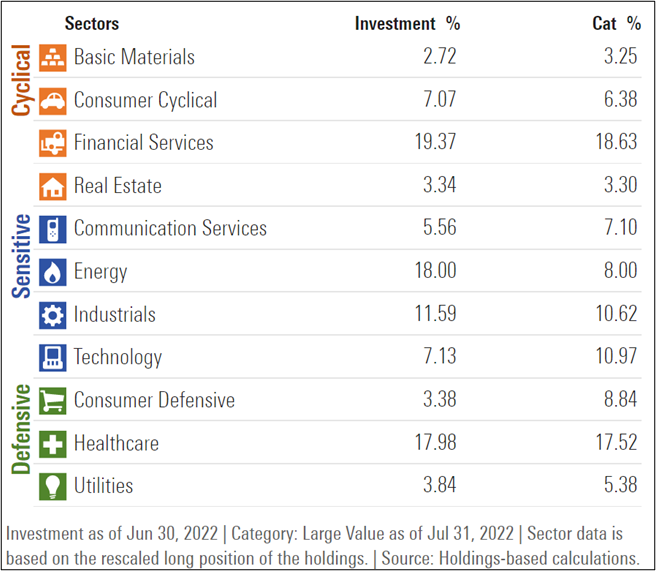
Source: Morningstar
The Rubber Hits the Road: Fund performance
I used my Bullish ETF Screen at Fidelity, which I modified to include only Actively Managed ETFs, to identify the actively managed ETFs in Figure #2 since July 2020. I added the State Street SPDR S&P 500 ETF (SPY) as a baseline, and FMIL which only has $56M in assets under management whereas one of my normal criteria is a minimum of $100M. The eleven actively managed ETFs have done relatively well compared to the S&P 500. The fund with the lowest total returns over the past two years is the Invesco S&P 500 Downside Hedged ETF (PHDG) and the best performing fund is the State Street SPDR SSgA Multi-Asset Real Return ETF (RLY) which has benefited from higher inflation. Both of these funds perform well under specific situations.
Figure #2: Selected Actively Managed ETFs Since July 2020
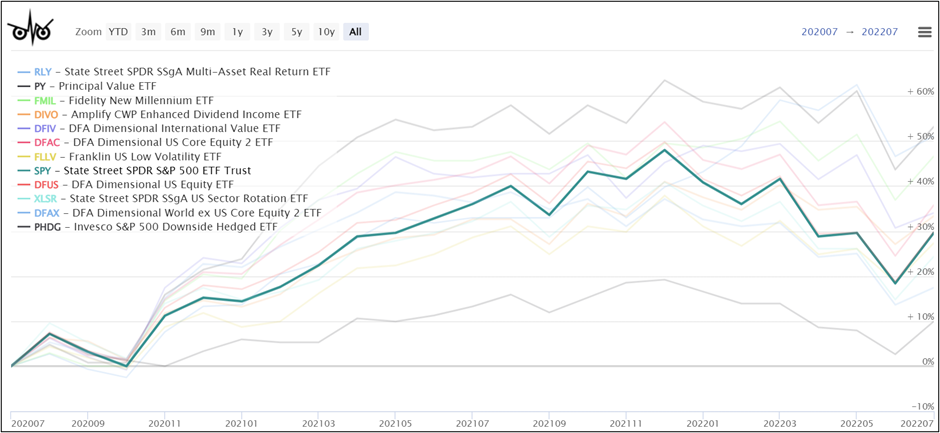
Source: Created by the Author Using the MFO Premium Multi-search Tool
Let’s take a look at the better performing funds year-to-date as of the end of July. The S&P 500 (SPY) is the worst performing of the remaining nine funds followed by State Street SPDR SSgA US Sector Rotation ETF (XLSR). Not surprising with high inflation, State Street SPDR SSgA Multi-Asset Real Return ETF (RLY) is the best performing fund. Fidelity New Millennium ETF (FMIL) is the second-best performing fund nearly breaking even.
Figure #3: Top Performing Actively Managed ETFs Year-To-Date
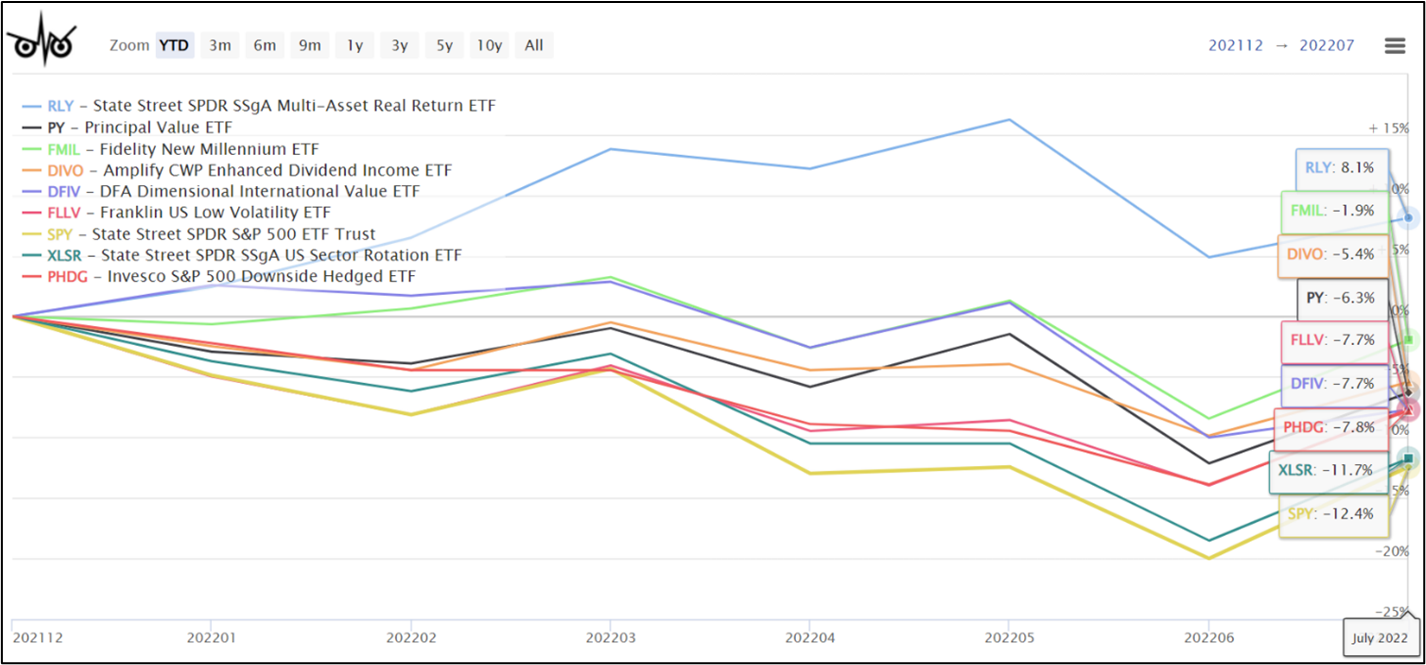
Source: Created by the Author Using the MFO Premium Multi-search Tool
Risk vs Reward
I used eight years to analyze the performance of multi-asset value funds available to individual investors, to see how FMILX compares since Mr. Roth became established as the manager. The blue rectangle in Figure #4 highlights those with higher returns and lower risk as measured by the Ulcer Index which is based on the depth and duration of drawdown. Notice the high risk adjusted performance of VictoryShares US EQ Income Enhanced Volatility Wtd ETF (CDC) which I have owned in the past. I had sold CDC last year when simplifying portfolios. Both are great funds, but recently I decided to buy FMIL based on its performance this year. I may consider adding CDC again at a later date.
Figure #4: Multi-Cap Value Funds Reward vs Risk (Eight Years)
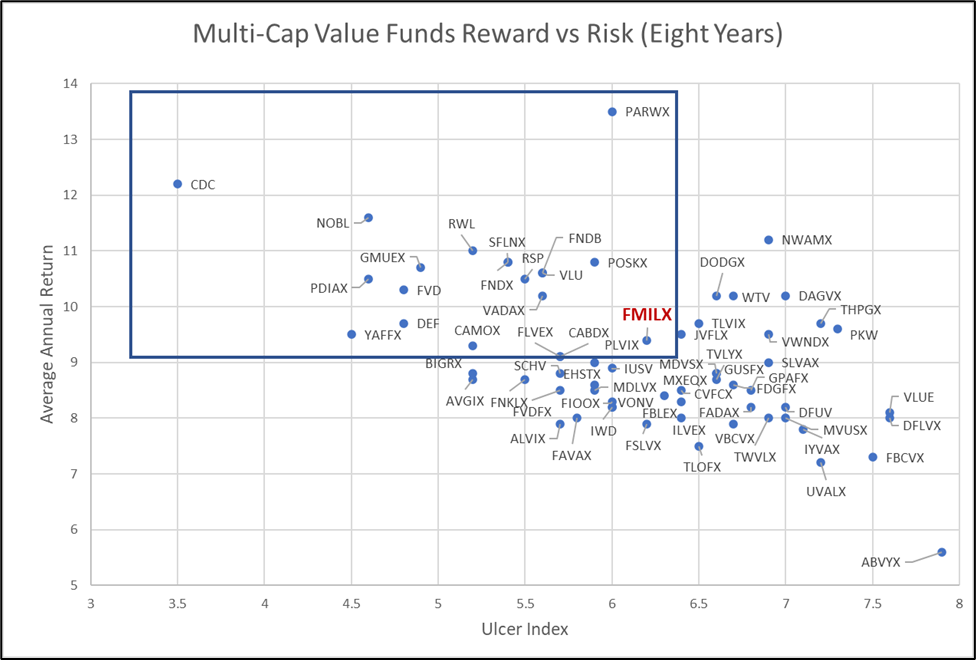
Source: Created by the Author Using the MFO Premium Multi-search Tool
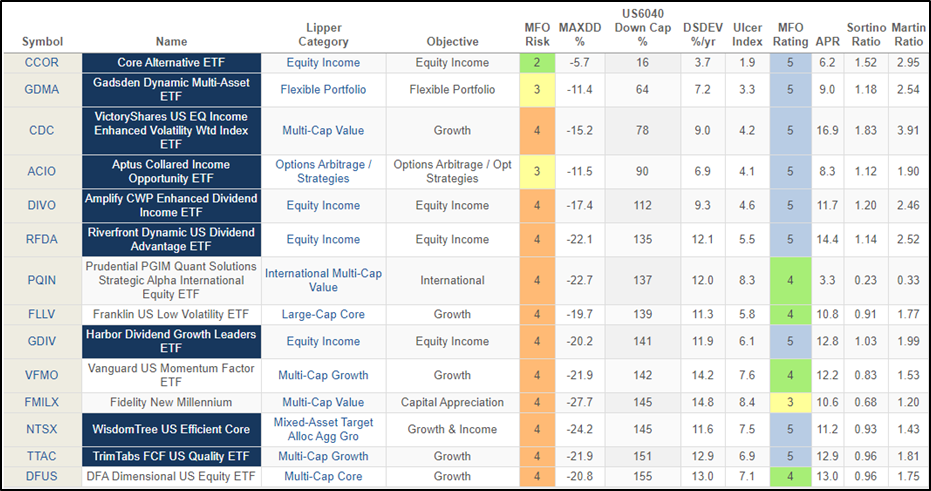
Table #2 compares some of the best multi-cap value ETFs over the past five years. The names in blue indicate funds that are classified as “Great Owls” by Mutual Fund Observer. These Great Owl Funds “delivered top quintile risk-adjusted returns, based on Martin Ratio, in its category.” With the exception of SPY, used as a baseline, Lipper classifies each of these funds as “Active”, but only FMIL, DIVO, and FLLV are not considered Index funds. The Five-Year Tax Efficiency Rating is low for FMILX because the turnover can sometimes be high so tax-advantaged accounts may be ideal locations for the Fidelity New Millennium fund.
Table #2: Top Multi-Cap Value ETFs Compared to FMILX (Five Years)
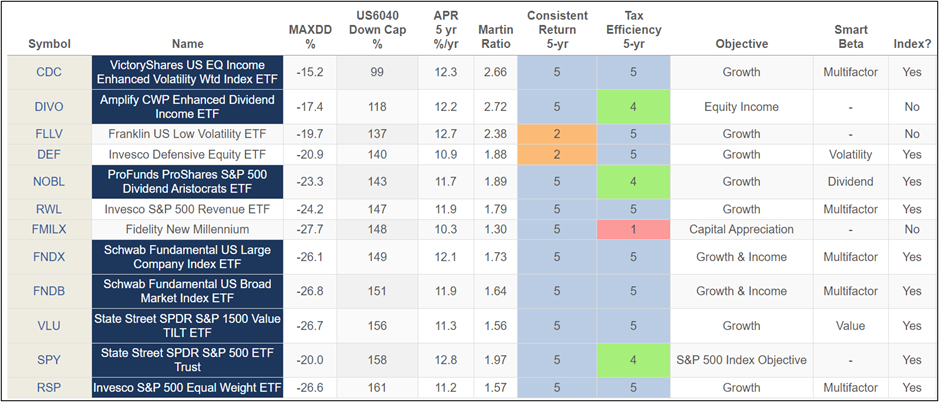
Source: Created by the Author Using the MFO Premium Multi-search Tool
I then compared how these funds performed year-to-date against their downside deviation as a measure of risk. VictoryShares US EQ Income Enhanced Volatility-Wtd Index ETF (CDC) has been the best performing multi-cap value fund with lower volatility. New Millennium ETF (FMIL) has had a similar return, but has been more volatile.
Figure #5: Top Multi-Cap Value ETFs Reward vs Risk YTD With Objective
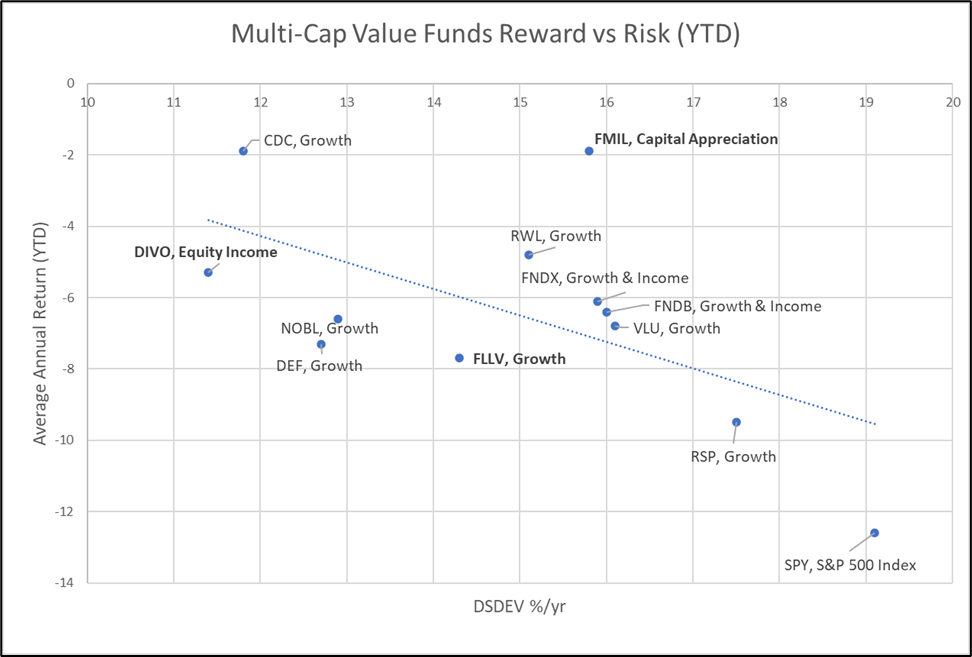
Source: Created by the Author Using the MFO Premium Multi-search Tool
A graphical representation of the funds year-to-date is shown in Figure #6. The S&P 500 (SPY) is included as a baseline fund.
Figure #6: Top Multi-Cap Value ETFs (YTD)
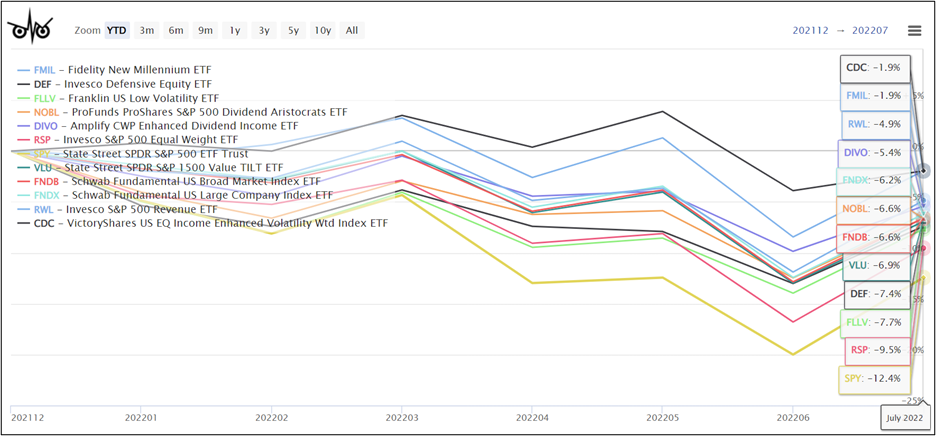
Source: Created by the Author Using the MFO Premium Multi-search Tool
Comparison to Low Volatility Funds
After Jerome Powell gave his speech on Friday following the Jackson Hole Conference, the S&P 500 fell 3.37% and FMIL fell 2.31%. When I saw the composition of the iShares MSCI USA Min Vol Factor ETF (USMV) contained 18.6% in Technology, I did a comparison to see how FMIL faired against some low volatility funds on Friday: CDC (-2.08%), SPLV (-2.17%), DEF (-2.82%), FLLV (-2.41%), and USMV (-2.63%). Table #5 shows the comparison for one year. For risk, I showed Downside Capture compared to a 60/40 fund, Downside Deviation, Maximum Drawdown, and Ulcer Index. For return, I show Total Return (APR) and Risk Adjusted Return (Martin Ratio). The Martin Ratio is the total return divided by the Ulcer Index. CDC, FMIL, and SPLV had the best performance for the past year by most measures.
Table #3: Comparison of Low Volatility Funds to FMIL (One Year)
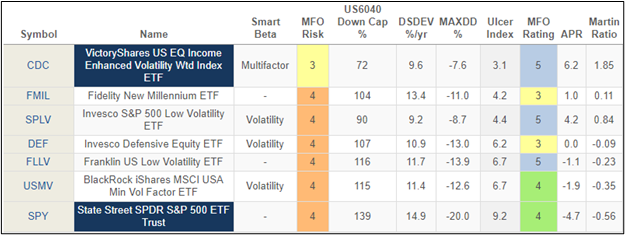
Source: Created by the Author Using the MFO Premium Multi-search Tool
FMIL does not have an objective of reducing volatility, but has performed better than many low volatility funds for the past year. The funds are shown graphically for the past year in Figure #7. FMIL is more volatile on a month-to-month basis reflecting the high allocation to energy, among other reasons.
Figure #7: Comparison of Low Volatility Funds to FMIL (One Year)
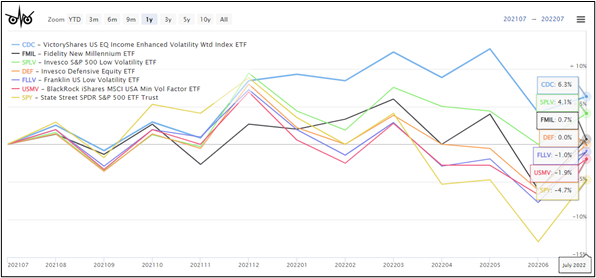
Source: Created by the Author Using the MFO Premium Multi-search Tool
Why did I buy FMIL if I believe that a recession is approaching? I’ve followed the Bucket Approach by having pensions and Social Security to cover most living expenses:
- Safety Bucket for living expenses and emergencies for several years,
- Defensive Bucket for Traditional IRAs where taxes have yet to be paid and which is overweight in consumer staples, health care, and utilities,
- a Tax Managed Account, and
- Growth Bucket for Roth IRAs where taxes have already been paid. I use Fidelity Wealth Services to manage the longer-term portfolios.
Mr. Powell’s hawkish speech and response by the markets does not impact my long-term strategy. A bear market will be an opportunity to do a Roth Conversion and increase allocations to stocks at lower valuations. I bought FMIL as a potential long-term investment in which I increase allocations as we move through the contraction phase of the business cycle.
I continue to buy CD ladders as interest rates rise, and will reduce allocations to stocks slightly in favor of bonds as interest rates rise. I reduced allocations to the Columbia Thermostat Fund (COTZX/CTFAX) as interest rates rose, and am now increasing allocations gradually as I expect interest rates to plateau next year and the probability of a recession continues to rise. For those of you not familiar with Columbia Thermostat, the Prospectus shows that it increases its allocation to stocks as the market falls.
Closing
Buying the Fidelity New Millennium ETF (FMIL) is a small adventure for me in my Defensive Portfolio which is set up to balance the risks of inflation and recession while being the least volatile of my portfolios. My Defensive Portfolio contains Real Return, Multi-Asset, Multi-Alternative, Multi-Strategy, Managed Futures, and defensive sector funds. FMIL adds diversification in sectors and styles that I have low exposure to. I chose FMIL because of the active management style which was rewarded this year with lower volatility. The lack of transparency is an issue for investors used to traditional passive ETFs. Short-term investors may want to avoid the fund because of the low assets under management and low volume.
FMILX and FMIL have performed relatively well against multi-cap funds on a risk-adjusted basis over various timeframes. I like the adaptive investment style that adjusts to market conditions, even though it has been described as “inconsistent”. When market conditions change, I expect allocations in my investments to reflect these changes. I expect FMIL to be a longer-term equity holding.
For readers who may be interested in a broader selection of actively managed ETF Categories, I extracted the following actively managed funds with high MFO ratings for risk-adjusted performance for the past three years. FMILX is included for comparison purposes.
Figure #8: Best Risk Adjusted Actively Managed Equity Funds (Three Years)
Source: Created by the Author Using the MFO Premium Multi-search Tool