


VictoryShares Enhanced Volatility Weighted ETF (CDC), a Great Owl with an Eye on Volatility
Each month, I sift through funds in my Ranking System, as well as trending funds, using the Mutual fund Observer MultiSearch screen. I search for high risk-adjusted returns across many asset classes for diversification. In March, I discovered VictoryShares Enhanced Volatility Weighted ETFs right under my nose. In this article, I look at the difference between low volatility funds and funds with high-risk adjusted returns.
This article is divided into sections for those who wish to skip to particular sections:
-
- Track Record of Low Volatility Funds
- VictoryShares US EQ Income Enhanced Volatility Weighted ETF (CDC)
- Building a Portfolio with High Risk-Adjusted Returns Based on 3 Year Performance
- Performance During the Past Year
- A Closer Look at FMSDX, TMSXR, CDC, and ARBIX
- A Glancing Look at RPAR, HNDL, and DIVO
- Recent Performance of Favorite Funds
1. Track Record of Low Volatility Funds
Key Point: Most low volatility funds have lower risk adjusted returns over time.
I downloaded all of the low volatility funds in existence for the past six years from Mutual Fund Observer and eliminated those that don’t reference volatility or risk in the name. The remarkedly shortlist is shown in Table #1. As expected, the S&P 500 has the highest return with one of the highest standard deviations. Ulcer Index is a better measure of risk than standard deviation (volatility) because it measures the depth and duration of drawdown. Surprisingly, the Ulcer Index and maximum drawdown of low volatility funds are nearly as high or higher than the S&P 500. Also surprising is that the Martin Ratio, which measures the risk adjusted return, is higher for the S&P 500 for the past six years than for the low volatility funds.
The explanation that I have is the low volatility funds often seek funds that do better during certain stages of the business cycle. Searching for funds with high-risk adjusted returns often leads to rotation strategies. Notice that there are three VictoryShares Enhanced Volatility Weighted ETFs in Table #1, in particular, VictoryShares US EQ Income Enhanced Volatility Weighted ETF (CDC). The funds are sorted from the highest risk-adjusted return (Martin Ratio) to the lowest.
Table #1: Six Year Performance of Low Volatility Funds
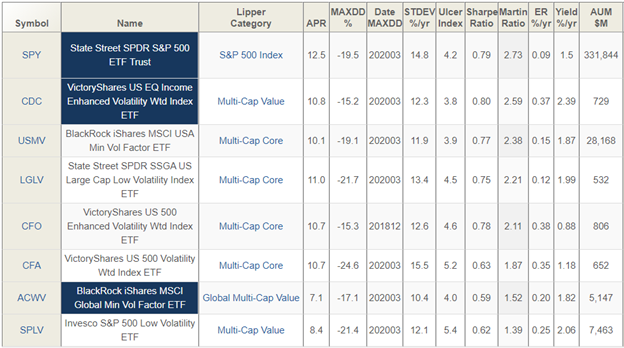
Source: MFO Premium database and screener
2. VictoryShares US EQ Income Enhanced Volatility Weighted ETF (CDC)
Key Point: CDC offers a disciplined and balanced investment approach that manages risk by automatically reducing exposure to stocks during periods of significant market declines
According to VictoryShares, CDC is suitable:
- For exposure to high-dividend-yielding, large-cap U.S. stocks that have at least four consecutive quarters of net positive earnings
- Offers a disciplined and balanced investment approach that manages risk by automatically reducing exposure to stocks during periods of significant market declines
- The Long/Cash Index tactically reduces its exposure to the equity markets during periods of significant market declines and reinvests when market prices have further declined or rebounded.
The strategy employed
- Selects the highest 100 dividend-yielding stocks in the Nasdaq Victory US Large Cap 500 Volatility Weighted Index, which first:
- Screens for profitability (four quarters of net positive earnings)
- Selects the largest 500 stocks by market capitalization
- Weights stocks based on risk/volatility (standard deviation over the last 180 trading days)
- Reconstitutes twice a year (March and September)
- Automatically reduces its exposure to the equity markets during periods of significant market declines and reinvests when market prices have further declined or rebounded
Table #2 contains summary information from Mutual Fund Observer about VictoryShares US EQ Income Enhanced Volatility Weighted ETF (CDC). Mutual Fund Observer classifies CDC as a “Great Owl” fund which means that it is in the upper quintile for risk-adjusted-performance.
Table #2: VictoryShares US EQ Income Enhanced Volatility Weighted ETF (CDC)
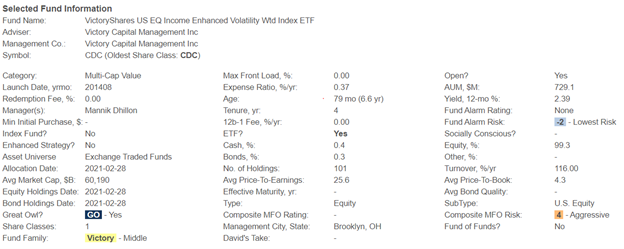
Source: MFO Premium database and screener
Seeking Alpha gives CDC a Factor Grade of A+ for Risk and B+ for Momentum.
Table #3: Seeking Alpha Factor Grades
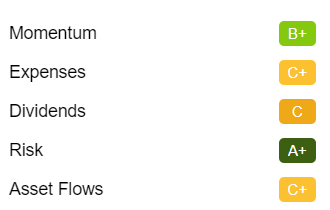
Source: Seeking Alpha
Figure #1: Total Return of VictoryShares US EQ Income Enhanced Volatility Weighted ETF (CDC)
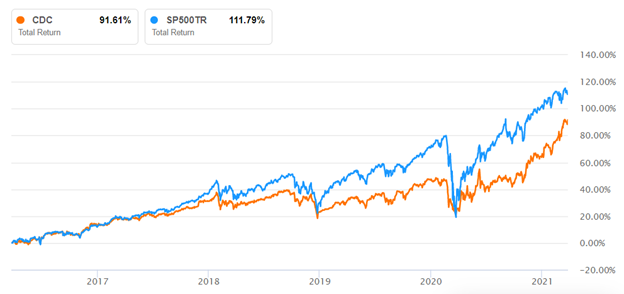
Source: Seeking Alpha
Morningstar, gives CDC Five Stars, a Neutral Rating, and its new Crowd Sense measurements are “High Attention” and “Medium Appeal”. According to Morningstar:
This share class, has had a strong short-term track record. Narrowing in on the past three-year period, it beat the category index, the Russell 1000 Value Index, by an annualized 2.9 percentage points, and outperformed the category average by 3.8 percentage points. And more importantly, when looking across a longer horizon, the strategy came out ahead. On a five-year basis, it led the index by an annualized 1.3 percentage points. Although the overall rating does not hinge on one-year performance figures, it is notable that this share class returned 38.8%, an impressive 16.5-percentage-point lead over its average peer, placing it within the top 10% of its category.
The risk-adjusted performance only continues to make a case for this fund. The share class had a higher Sharpe ratio, a measure of risk-adjusted return, than the index over the trailing five-year period. This strategy’s investors did not have to take on more risk for this fund’s strong risk-adjusted performance. The strategy delivered a smooth ride for investors with a relatively low standard deviation, 12.7%, compared with the benchmark’s 16.2%. Finally, the share class proved itself effective by generating positive alpha, over the same period, against the category group index: a benchmark that encapsulates the performance of the broader asset class.
3. Building a Portfolio Based on 3 Year Performance
Key Point: Portfolio Visualizer is used to model a portfolio with high risk-adjusted returns.
With valuations so high and yields so low, I evaluated low-risk funds to build a diversified portfolio. I used Portfolio Visualizer to create a portfolio to maximize returns for the past three years at 8% volatility. The link to Portfolio Visualizer is provided here. Fidelity Multi-Asset Income (FMSDX) and T. Rowe Price Multi-Strategy Total Return (TMSRX) are two of my larger holdings.
Figure #2: Portfolio with High Risk-Adjusted Return (Three Years)
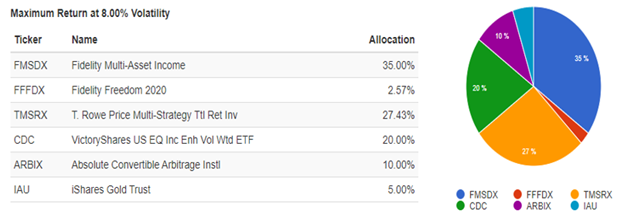
Source: Portfolio Optimization (Portfolio Optimization (portfoliovisualizer.com))
I use the Vanguard Wellesley as a conservative baseline fund. The recent trends were a factor in selecting these funds.
Table #4: Portfolio Visualizer Performance Metrics
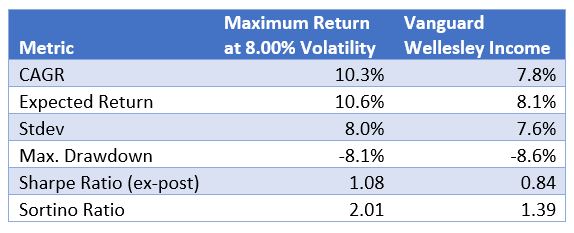
Source: Portfolio Optimization (Portfolio Optimization (portfoliovisualizer.com))
Figure #3 is the Efficient Frontier which compares the Risk Free Return against Volatility.
Figure #3: Efficient Frontier
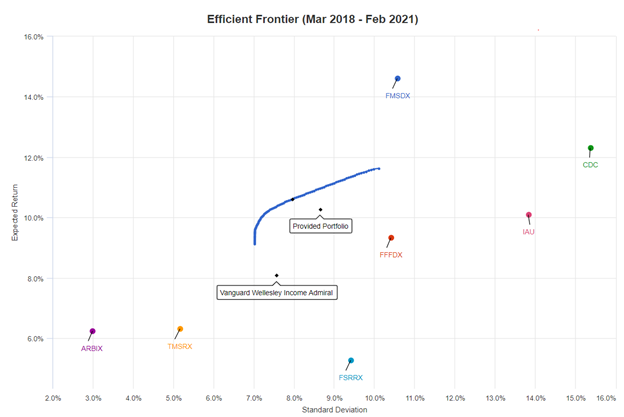
Source: Portfolio Optimization (Portfolio Optimization (portfoliovisualizer.com))
Figure #4 shows that the model portfolio compares well against the Vanguard Wellesley Income Fund, but recently began outperforming in the current environment.
Figure #4: Portfolio with High Risk-Adjusted Return (Three Years)
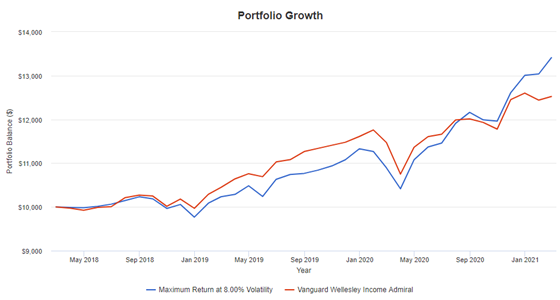
Source: Portfolio Optimization (Portfolio Optimization (portfoliovisualizer.com))
4. Performance During the Past Year
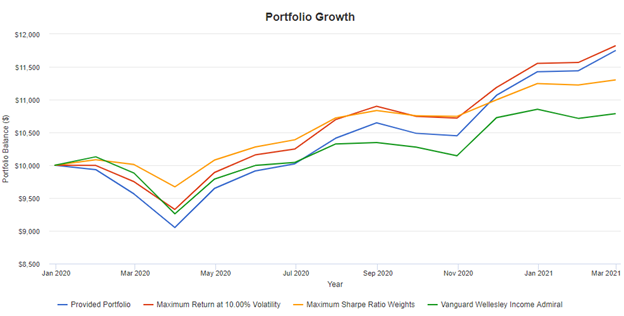
After reviewing the funds in the previous section over the past three years, I compared my preferred portfolio to one that maximizes return at 10% volatility and one that maximizes the Sharpe Ratio. The link to Portfolio Visualizer is provided here.
Figure #5: Portfolio Performance During Past Year
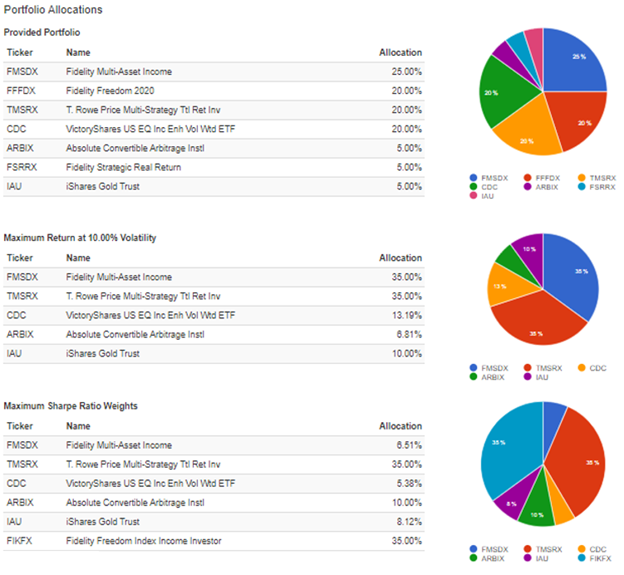
Source: Portfolio Optimization (Portfolio Optimization (portfoliovisualizer.com))
The preferred portfolio performs in a similar manner as the one that maximizes return for 10% volatility. Given that future returns are guaranteed to be different than the past, I prefer more diversification.
Figure #6: Portfolio Performance During Past Year
5. A Closer Look at FMSDX, TMSXR, CDC, and ARBIX
Key Point: Funds are compared for the possible purchase of ARBIX.
The role of Fidelity Multi-Asset Income (FMSDX) and VictoryShares US EQ Income Enhanced Volatility Weighted ETF (CDC) is to add high risk-adjusted returns while the role of T. Rowe Price Multi-Strategy Total Return (TMSRX) and Absolute Convertible Arbitrage (ARBIX) is to add stability.
Figure #7: FMSDX, TMSXR, CDC, and ARBIX
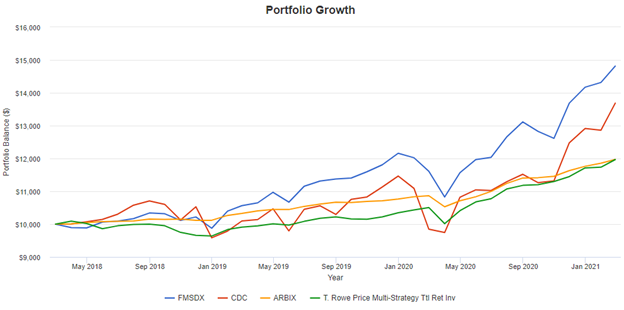
Source: Backtest Portfolio Asset Allocation (Backtest Portfolio Asset Allocation (portfoliovisualizer.com))
6. A Glancing Look at RPAR, HNDL, TMSRX, and DIVO
Key Point: Funds are compared for the possible purchase of RPAR.
Risk Parity ETF (RPAR) is a one-year-old fund but has attracted $1B in assets. In Figure #8, I wanted to compare RPAR with funds that I own, Amplify CWP Enhanced Dividend Income (DIVO), Strategy Shares Nasdaq 7HANDL (HNDL), and T. Rowe Price Multi-Strategy Total Return (TMSRX). Each of the funds has advantages, and I particularly like the upward trend of TMSRX and DIVO.
Figure #8: RPAR, HNDL, TMSRX, and DIVO
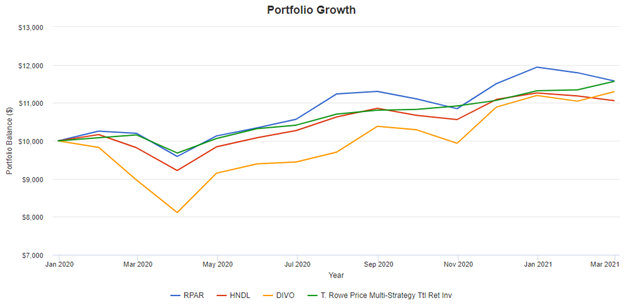
The performance of RPAR has been good over the past year. I have tried the strategy using Portfolio Visualizer, but it was too conservative for me. I will continue to track RPAR.
7. Recent Performance of Favorite Funds
Table #5 contains recent information about some of the funds that I have written about.
Table #5: Favorite Funds
| Name | Symbol | APR | Max DD | Martin | Rtn 3Mon | Trend 3Mon | Flow |
| Vanguard Commodity Strategy | VCMDX | 10.7 | -21.0 | 1.1 | 15.7 | 5.5 | 22.4 |
| VictoryShares US EQ Inc Enh Vol | CDC | 16.6 | -15.2 | 3.3 | 9.7 | 4.4 | 2.2 |
| Fidelity Multi-Asset Income | FMSDX | 18.6 | -10.9 | 6.2 | 8.6 | 3.0 | 26.2 |
| Fidelity Strategic Real Return | FSRRX | 5.8 | -14.5 | 1.1 | 5.6 | 1.8 | 4.6 |
| T Rowe Price Mlti-Strat Tot Rtrn | TMSRX | 9.9 | -4.7 | 8.9 | 4.5 | 1.4 | 15.5 |
| Vanguard STAR | VGSTX | 18.1 | -13.2 | 5.3 | 5.6 | 1.3 | 0.3 |
| Vanguard Global Wellington | VGWAX | 11.4 | -15.6 | 2.2 | 4.0 | 1.2 | 1.3 |
| Amplify CWP Enh Div Income | DIVO | 14.0 | -17.4 | 2.7 | 3.7 | 1.1 | 21.4 |
| Columbia Thermostat | COTZX | 20.1 | -2.4 | 25.0 | 3.2 | 0.7 | 3.9 |
| ATAC Rotation | ATACX | 33.6 | -6.7 | 11.6 | 13.9 | 0.1 | 6.6 |
| Fidelity Freedom Income | FIKFX | 7.6 | -3.1 | 9.1 | 0.2 | -0.4 | 2.6 |
| Dodge & Cox Income | DODIX | 7.7 | -3.1 | 9.1 | -1.0 | -0.9 | 1.6 |
| Strategy Shrs Nasdaq 7HANDL | HNDL | 11.0 | -9.3 | 4.5 | -0.1 | -1.0 | 12.0 |
| Fidelity Infl-Prot Bond | FIPDX | 8.2 | -1.6 | 11.5 | -0.2 | -1.0 | 2.5 |
Source: Author, based on MFO Premium database and screener
Closing
When buying a fund, I prefer all weather buy and hold funds that will have high risk adjusted returns. Overtime, I would like to have six percent inflation adjusted returns. This may seem low, but the average inflation adjusted return of the stock market with dividends reinvested for the past 120 years is 6.7%. High valuations and inflation may result in low stock market real returns for the coming decade.
This quarter, I have been busier than usual. I purchased Vanguard Commodity Strategy (VCMDX) and Fidelity Strategic Real Return (FSSRX) for inflation protection. I purchased VictoryShares US EQ Income Enhanced Volatility Weighted ETF (CDC) because of its momentum and lower risk profile. I recently added Fidelity Freedom 2020 (FFFDX) for diversity. I added Absolute Convertible Arbitrage (ARBIX) as a lower risk alternative to bonds.
Best Wishes and Be Safe!