


The last substantial decline in the US stock market occurred between 2007-09. Vanguard Total Stock Market Index Fund (VTSMX) declined by 50.9% and remained under water for 52 months. Vanguard International Stock Market Index (VGTSX) fell 58.5% and did not recover for 114 months. Investors in Vanguard Emerging Market Index (VEIEX) would be at least a little envious of the fact that VGTSX investors were in the red for almost ten years, since they were at a loss for more than 10 years after their portfolio hit bottom. Investors who hewed to the “stocks for the long-term” mantra and faithfully held their VEIEX shares ended the decade with an average annual loss of 0.1%.
The good news is that it’s over: almost all diversified funds have managed to recover all of the losses they suffered and then some.
The bad news is that it could have been much worse. In major bear markets, stock valuations often drop from “way too high” at the outset, rocket past “entirely reasonable” and crash around “horrifyingly low,” which sets up a rebound and a new bull market. That didn’t exactly happen in 2007-09, valuations were so historically high before the crash that a 50% decline didn’t return them to “horrifyingly low.” At the worst of the decline, stock valuations were no lower than “about reasonable.”
Here’s the Shiller p/e ratio for the US stock market from the late 19th century to the early 21st century. Shiller’s p/e tries to eliminate some of the distortions caused by short-lived profit spikes, since those spikes create the temporary illusion that market valuations are fabulously low.
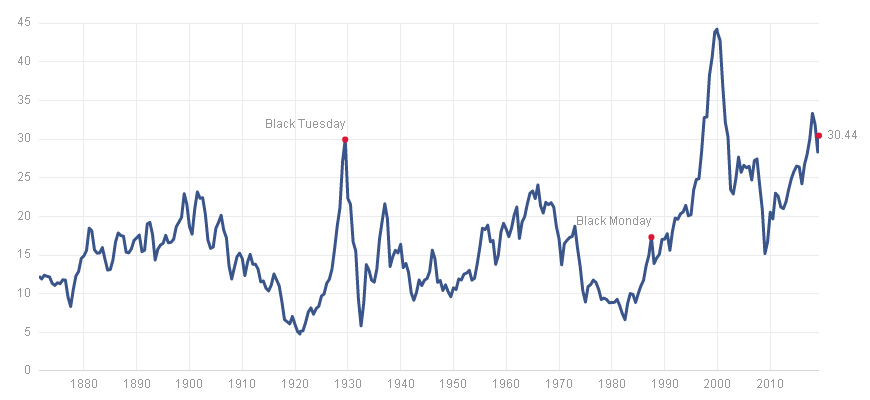
The median Shiller p/e for that 140-year period is 16.9; the depth of the sharpest percentage decline since the Great Depression brought the market’s p/e down to just 15 in March 2009. If the market bottomed at the levels typical of major bear markets, it would have been in the single digits.
It may be that we will never see single-digit valuations ever again because, you know, technology and algorithms and the Fed. Those of us depending on relatively modest retirement portfolios to keep us from spending our Golden Years in a repurposed dumpster out behind the Walmart, might want to approach such optimism with caution.
The worse news is that another crash is coming. That’s not a market-timing call, it’s simply a report on 2000 years of investment history. Markets climb, often irrationally. Markets fall, often irrationally. The past 10 years have seen a nearly unbroken rise in domestic equity markets, punctuated by a series of minor hiccups:
| Year | Duration of the decline | Extent of the decline |
| 2010 | 5 months | 16% |
| 2011 | 3 months | 19 |
| 2015 | 2 months | 15 |
| 2015-16 | 3 months | 13 |
| 2018-19 | 6+ months* | 20 |
* as of 29 March 2019, the domestic Total Market and S&P 500 indexes are within about 2% of their all-time highs from September 2018. Having posted its best quarter in decade, the correction feels mostly “done.”
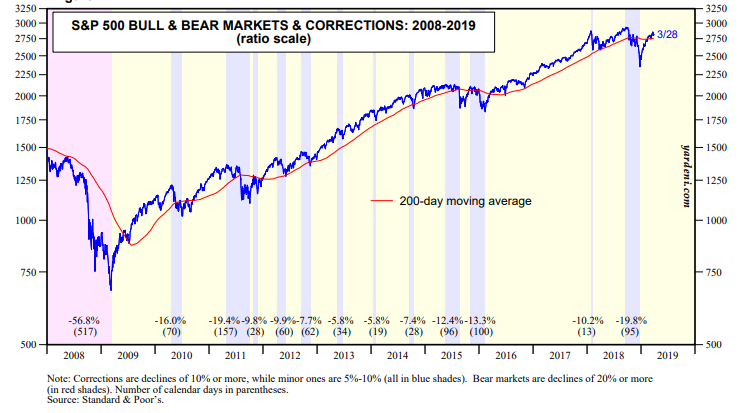
The folks at Yardeni Research have published a series of graphs that illustrate the extent, timing and severity of market declines over the past century. Their work gives you a sense of how inconsequential all the Sturm und Drang over the past decade has been:
The simple question is, are you ready for the next round? The problem is that many of the most popular investment options available today didn’t exist in mid-2007. Almost half of all existing mutual funds (3340 of 7348) launched after October 1, 2007, which means we don’t have a record of how they handled the last really extended bear market.
We can help
We can, however, get a snapshot of how they did during the second-worst stretch in recent market history, the 2018-19 correction. I used the fund screener at MFO Premium to show the risk-adjusted performance of all funds and ETFs over the past six months, which captures both the autumn decline and the winter rebound. Our guess is that the performance of funds during a short, sharp cycle will give you an insight into how they might perform in a long, grinding cycle later.
The statistics below measure fund performance from September 1, 2018 – February 28, 2019 so they capture the few weeks before the market peak and exclude March, 2019. Here are the ten funds (well, nine funds and an ETF) that had the best risk-adjusted performance during that mini-cycle.
| Maximum drawdown | Sharpe ratio | Ulcer Index | |
| Benchmark: Vanguard Total Stock Market (VTSMX) | -14.3% | -0.39 | 7.6 |
| Spectrum Low Volatility (SVARX) | -2.1 | 0.78 | 1.2 |
| SEI Multi-Asset Income (SIOAX) | -2.8 | 0.57 | 1.5 |
| Fidelity Advisor Series Growth Opportunities (FAOFX) | -10.4 | 0.46 | 6.5 |
| FAM Equity-Income (FAMEX) | -8.1 | 0.43 | 4.1 |
| Invesco S&P 500 Low Volatility ETF (SPLV) | -6.9 | 0.42 | 3.1 |
| AMG Yacktman Focused (YAFFX) | -4.7 | 0.41 | 2 |
| Marshfield Concentrated Opportunity (MRFOX) | -8 | 0.41 | 4.1 |
| Calvert Equity (CSIEX) | -8.4 | 0.38 | 4 |
| AMG Yacktman (YACKX) | -4.9 | 0.35 | 2.1 |
| Akre Focus (AKREX) | -8.5 | 0.29 | 4.4 |
MFO Premium search string: Mutual Funds + ETFs, U.S. Equity + Mixed Asset, Only Great Owl Funds, display 09/2018-02/2019. N = 203 funds/ETFs
To test the hypothesis that performance during the autumn-to-winter cycle might help us identify funds and ETFs that will serve us well during an extended bear, we then looked at the relative performance of each of these funds, upside, downside and risk-return balance, from the time of its inception (periods ranging from 3 – 32 years) to now. The table below documents our findings.
Performance since inception
| Age | APR | Max DD | Recov | Std Dev | DS Dev | Ulcer | Bear | Sharpe | MFO | |
| Spectrum Low Volatility | 5 | 5 | 1 | 2 | 1 | 1 | 1 | 1 | 5 | 5 |
| SEI Multi-Asset Income | 7 | 4 | 1 | 2 | 1 | 1 | 1 | 1 | 5 | 5 |
| Marshfield Concentrated Opportunity | 3 | 5 | 1 | 2 | 2 | 1 | 1 | 1 | 5 | 5 |
| Akre Focus | 10 | 5 | 1 | 3 | 1 | 1 | 1 | 1 | 5 | 5 |
| AMG Yacktman | 27 | 5 | 1 | 1 | 2 | 2 | 1 | 2 | 5 | 5 |
| Calvert Equity | 32 | 2 | 1 | 1 | 1 | 1 | 1 | 1 | 4 | 5 |
| AMG Yacktman Focused | 22 | 5 | 1 | 1 | 3 | 2 | 1 | 2 | 5 | 5 |
| Invesco S&P 500 Low Volatility ETF | 8 | 5 | 1 | 1 | 1 | 1 | 1 | 1 | 5 | 5 |
| FAM Equity-Income | 23 | 5 | 3 | 3 | 2 | 2 | 2 | 3 | 5 | 4 |
| Fidelity Advisor Series Growth Opportunities | 5 | 5 | 1 | 5 | 4 | 2 | 2 | 3 | 5 | 5 |
In each case, the values represent the performance of the fund since its inception. Since being splendid for a long time is even harder than being splendid for a while, we highlight each fund’s age. In all cases, blue represents the best possible rating, green is second best and so on down to red.
What do the columns mean? APR is “annual percentage return,” so blue is the top 20% of its peer group since inception. Max DD is “maximum drawdown,” so blue is in the 20% of peer funds with the smallest worst-case performance. Recov is “time to recover from your max DD,” standard deviation is a measure of “normal” volatility, DownSide deviation is a measure of a fund’s tendency to move downward, the Ulcer Index combines measures of how far a fund falls and how long it stays down, bear is a fund’s normal performance in bear market months, Sharpe is a very common measure of a fund’s risk-return performance and MFO is a variation of Sharpe that strongly rewards funds that hold up well in volatile markets.
These are just the comparative rank data (top 20%, top 40% and so on). If you’re geeky enough to want to work with the raw data as well, that’s all in the screener at MFO Premium. For our immediate purpose, the relative performance was the relevant part.
Here’s the takeaway: the funds’ short-term resilience seems to reflect their long-term prospects. The funds that excelled in the fall and winter have also excelled, with some consistency and across a variety of measures, since their inception.
Where do we go from here?
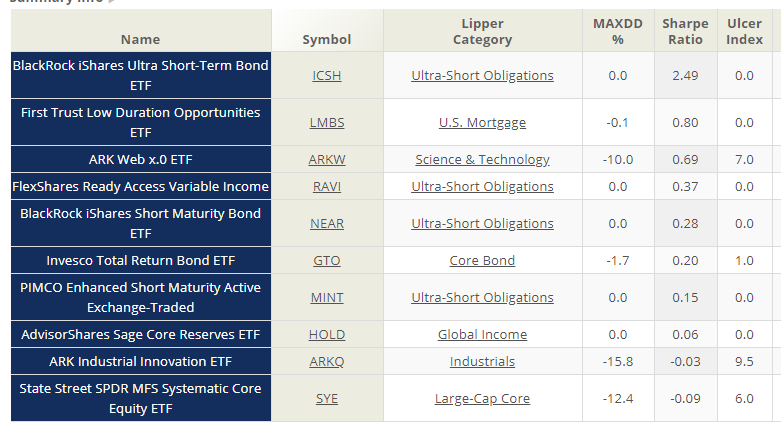
If you’re intrigued and have access, “to MFO Premium,” go there and recreate the search string so you can see the full details rather than my quick summary. If you’re intrigued but haven’t sought access to Premium, here are the highlights of resilient funds and ETFs in a variety of categories.
Zero is not my hero! All equity funds and ETFs with a Sharpe ratio above zero
| State Street SPDR SSGA US Large Cap Low Volatility Index ETF | LGLV | Multi-Cap Core |
| T Rowe Price Capital Appreciation | PRWCX | Growth allocation |
| Legg Mason Low Volatility High Dividend ETF | LVHD | Multi-Cap Value |
| Madison Dividend Income | BHBFX | Equity Income |
| Invesco DJIA Dividend ETF | DJD | Equity Income |
| Fidelity Advisor Multi-Asset Income | FAYZX | Flexible Portfolio |
| BMO Low Volatility Equity | MLVEX | Multi-Cap Value |
| BlackRock iShares Edge MSCI Min Vol USA ETF | USMV | Multi-Cap Core |
| Nuance Mid Cap Value | NMVLX | Mid-Cap Core |
| MFS Low Volatility Equity | MLVAX | Multi-Cap Core |
| Fidelity SAI US Low Volatility Index | FSUVX | Multi-Cap Core |
| Vanguard Wellesley Income | VWINX | Conservative allocation |
| TCW New America Premier Equities | TGUSX | Multi-Cap Growth |
| First Trust Value Line Dividend Index | FVD | Multi-Cap Value |
| Invesco S&P MidCap Low Volatility ETF | XMLV | Mid-Cap Core |
| Champlain Mid Cap | CIPMX | Mid-Cap Growth |
| Virtus KAR Small-Cap Growth | PXSGX | Small-Cap Growth |
| Jackson Square SMID-Cap Growth | DCGTX | Small-Cap Growth |
| T Rowe Price Dividend Growth | PRDGX | Large-Cap Core |
| Jensen Quality Growth | JENSX | Large-Cap Core |
| YCG Enhanced | YCGEX | Large-Cap Core |
| State Street SPDR Portfolio S&P 500 High Dividend ETF | SPYD | Equity Income |
| AMG River Road Focused Absolute Value | AFAVX | Multi-Cap Value |
| ProShares Russell 2000 Dividend Growers ETF | SMDV | Small-Cap Core |
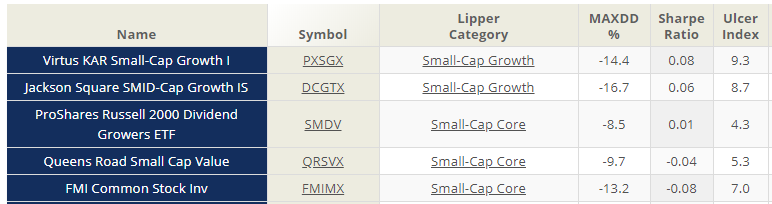
The small standing tall: the top five small cap funds
Citizens of the World: The Top Five Global Funds
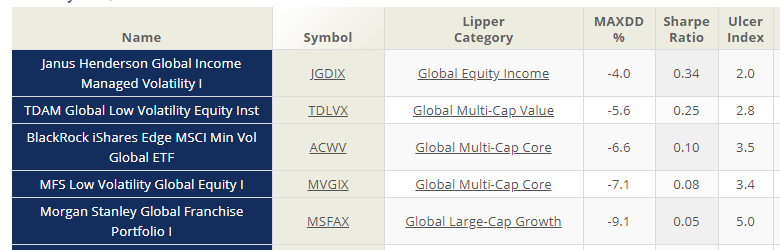
Beyond these shares: the top five international funds
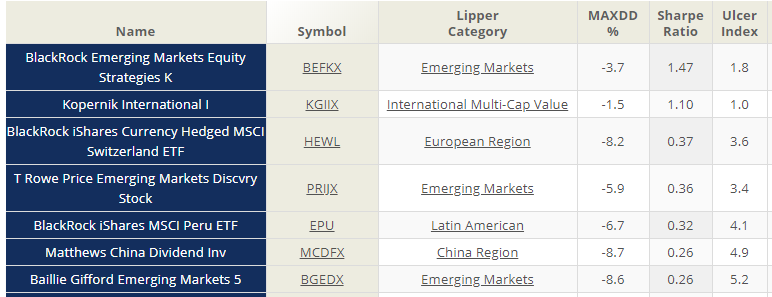
… or maybe a few more.
Striking a healthy balance: the top five balanced funds
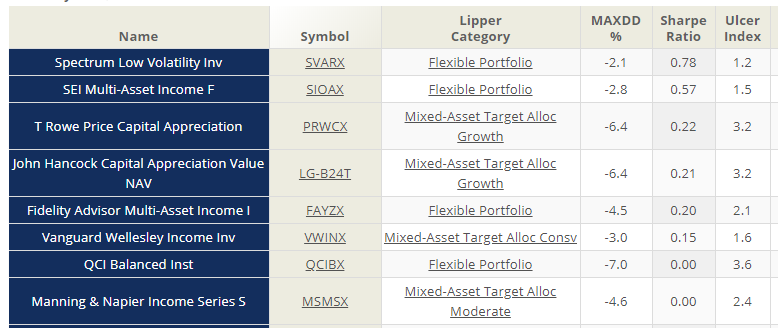
… yes, I know. Think of it as an Easter Egg.
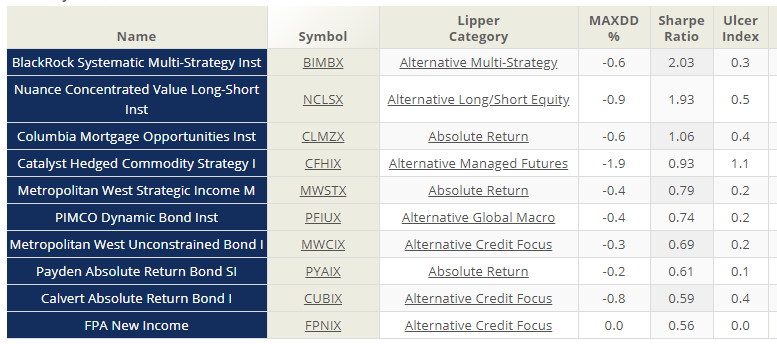
On the other hand: the top ten alternatives funds
The rewards of virtue: the top ten ESG funds
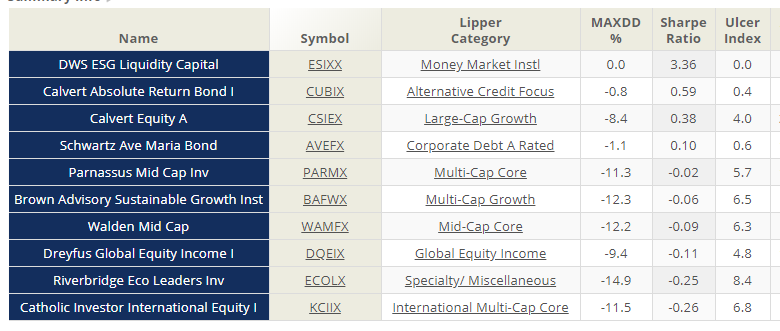
A socially responsible money market. Who knew?
Passively active: the top ten active ETFs