


Every strategy should be evaluated not just on a “benefit of being right”, but at least as importantly, on a “cost of being wrong”, basis…
– The Little Book of Sideways Markets, Vitaliy N. Katsenelson
I just finished The Little Book of Sideways Markets (2010) by Vitaliy N. Katsenelson. Mr. Katsenelson is a value investor, an author and CEO of a small but classy Colorado investment advisor; he offers a singularly engaging personal bio on his well-read Contrarian Edge blog. His two books cover the same ground, but are written for different audiences: professional (Active Value Investing) and lay (The Little Book of Sideways Markets). His concern here is with markets that can go up and down for 10 or 20 years and end up near where they started. In this article, I look at investing in a turbulent market which I believe will occur over the next two years using “Sideways Markets” as a guideline.
Reducing the Noise
The sheer volume and velocity of noise generated by the market and amplified by media breaks down and fatally clogs our noise-filtering mechanism. We should proactively and methodically create a proactive environment where we limit (or block outright) the majority of outside noise that comes through, and only then should we start filtering.
– Vitaliy N. Katsenelson
The economy is slow moving and, barring a catastrophic event, does not turn on a dime. Yet I constantly see in the news shows or internet that some new piece of data is described as both very positive and negative for the economy. These do have an impact on our emotions. Chart #1 shows how data can be interpreted differently. Both lines show the National Home Price Index. The blue line is the index and it shows that housing prices are climbing. The red line is the same index shown as the rate of change from a year ago. Housing prices are climbing at slower rate, as they often do before a recession.
Chart #1: Investment Model Valuation Indicator
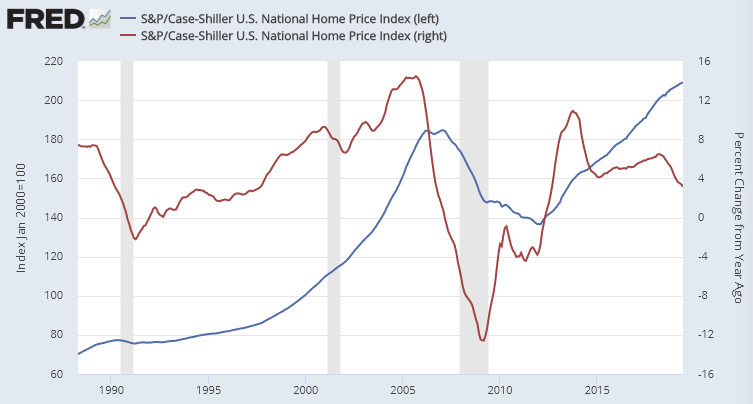
Source: S&P Dow Jones Indices LLC, S&P/Case-Shiller U.S. National Home Price Index, retrieved Fed Rsv Bank of St. Louis; https://fred.stlouisfed.org/series/CSUSHPISA
In my opinion, a recession is not imminent, but the odds are climbing. Chart #2 shows that Total Business Sales, Orders (durable goods), Investments (Capital goods orders), Shipments, and Construction Spending are starting to contract compared to a year ago. These indices have been declining since early 2017, although Sales and Shipments are now contracting at a slower rate.
Chart #2: Contracting Economic Indicators
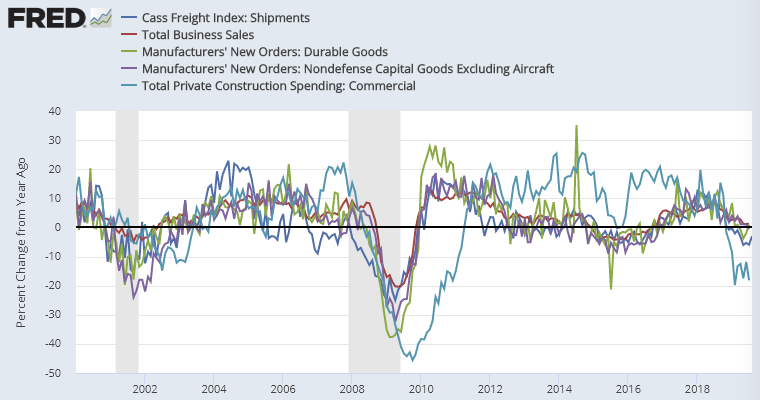
Source: Retrieved from FRED, Federal Reserve Bank of St. Louis
Investment Model
With so much data to absorb, I built an Investment Model using data mostly from the St. Louis Federal Reserve (FRED) database. The Investment Model was created by downloading thousands of the economic data series on the St. Louis Federal Reserve and calculating the correlation to the S&P 500 six months into the future. The ideal data should be timely, start prior to 1995, and be available on a monthly basis. Other indicators were added such as corporate, gross domestic product, valuations, investment, household, and banking because they are good long leading indicators. With 34 main indicators, no indicator has more than a few percent weighting on the overall model.
Occasionally, I read about an indicator that someone relies on and test it in the investment model. This month I added a Shipping Indicator after reading “Cass Freight Index Down 9th Month ‘Signaling Economic Contraction’” by Mike “Mish” Shedlock. Mr. Shedlock wrote:
“We know that freight flows are a leading indicator, so by definition there is a lag between what they are predicting and when the outcome is reported. Nevertheless, we see a growing risk that GDP will go negative by year’s end.”
I composited the Cass Freight Index, Value of Manufacturers’ Shipments for Manufacturing, Rail Freight Carloads, and Value of Manufacturers’ Shipments for Heavy Duty Trucks into a Shipping Indicator. Chart #3 is the Shipping Indicator compared to the average of the Chauvet Recession Probability Model and the GDP Based Recession Indicator available on the FRED database. It has a 39% correlation to the recession indicator 4 months into the future.
Chart #3: Shipping Indicator
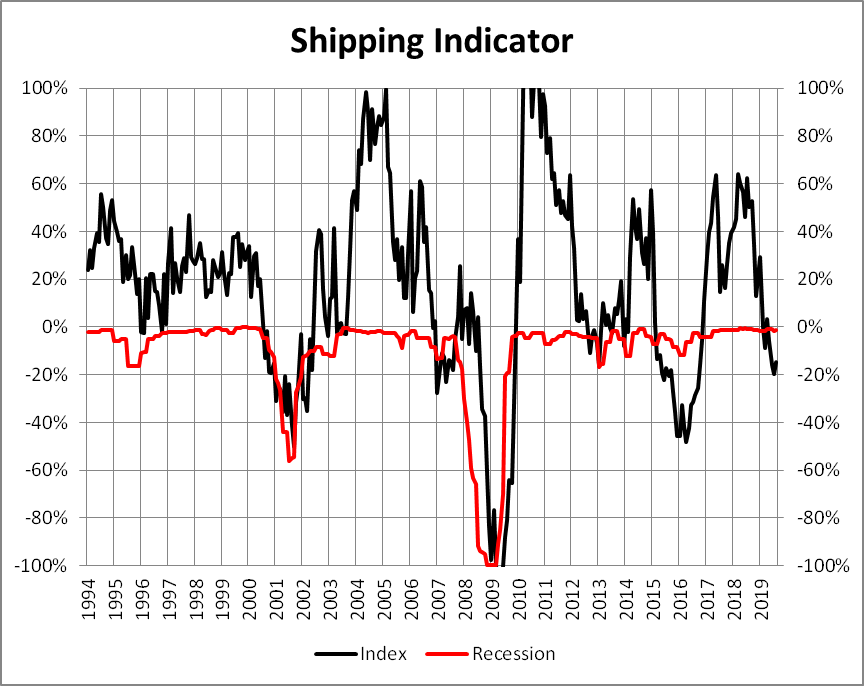
Source: Created by the Author based on data from the St. Louis Federal Reserve (FRED)
The Investment Model maximizes return of portfolios by changing allocations to stocks and bonds based on the economy, financial markets and risk. The chart below is a bit scary, both for its complexity and for its investment implications.
Chart #4: Investment Model
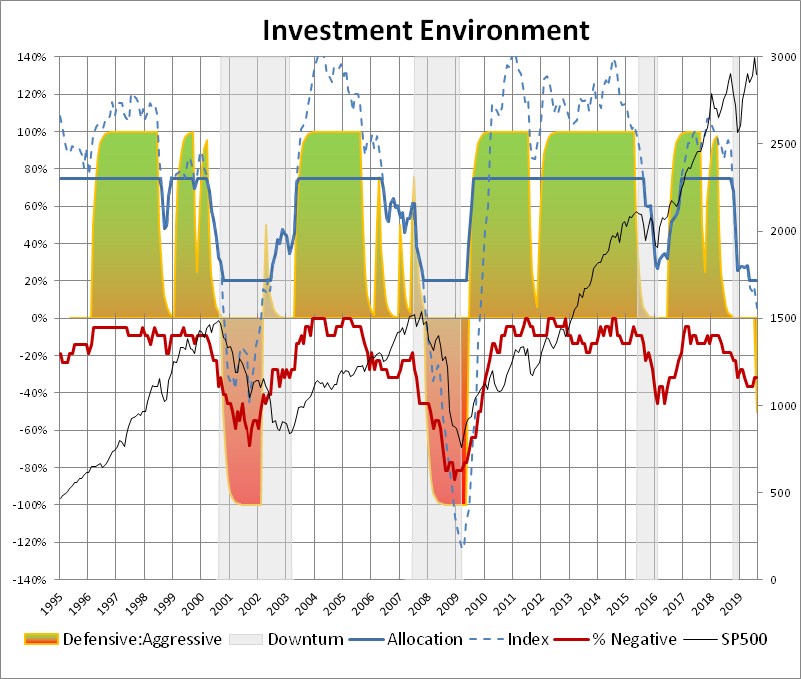
Source: Created by the Author based on data from the St. Louis Federal Reserve (FRED)
Remember that my model starts with a series of economic indicators, such as the freight index. The red line is a summary of the indicators used to create the Investment Model, in particular it shows the percent of those indicators that are negative. They’re getting more negative.
The shaded areas are where I estimate it is reasonable to be more aggressive (green) or defensive (red). The solid blue line the estimated allocation to stocks.
In theory, your equity allocation should correspond to the dashed blue line. In practice, it’s neither reasonable nor practicable for investors to jump from a 140% positive leverage to a 120% net short and so, following Benjamin Graham, I cap maximum equity exposure at 75% and minimum exposure at 20%. That’s represented by the solid blue line. As of October 2019, the model portfolio would move to its most conservative allocation of 20% in equities.
Which equities? Over the remainder of this essay, I’ll try to merge Mr. Katsenelson’s observations with current economic conditions and MFO data to suggest specific portfolio positioning.
Price to Earnings Ratio
In the late stage of a secular bull market P/E stops rising. Investors receive “only” a five percent return from earnings growth-and they are disappointed. The love affair with stocks is not over, but they start diversifying into other asset classes that recently provided better returns (real estate, bonds, commodities, gold, etc.). Suddenly, stocks are not rising 12 percent a year, not even 5 percent, but closer to zero-P/E decline is wiping out any benefits from earnings growth…
– Vitaliy N. Katsenelson
As long as investors believe that lowering interest rates and continuing quantitative easing improves stability, stock prices are likely to rise. When investors are inclined to risk aversion, lowering interest rates is unlikely to prevent the price to earnings ratio from contracting. Because the economy has been slowing for close to two years, real estate and utilities have had great returns and now have higher valuations. I have sold utility and real estate funds to lock in gains as the funds become more volatile. I am concentrated in bonds, and hold more gold than usual.
Dividend Yield
-
- [Dividend] yield is a function of two factors: dividend payout and stock market valuations. Dividend payout is the percentage of earnings corporate boards decide to share with investors. During the last century dividend payout was about 60 percent of earnings; however, from the mid-1990s to the mid-2000s it declined to about 30 percent as managements favored stock buybacks over dividend payments…
- Stock buybacks can create shareholder value if the stock is purchased cheaply, but they often destroy value when management overpays for the stock.
- An even worse reason that management is prone to overpay for company stock is that their compensation is often linked to EPS growth. And they will often do anything to stimulate that growth, even if that means destroying shareholder wealth through stock buybacks.
- Stock buybacks when the company stock is undervalued make sense.
– Vitaliy N. Katsenelson
Chart #5 shows that share buybacks are reduced during recessions. Companies tend to pay high prices during bull markets and reduce buybacks when stocks are cheap. This is a practice that will exacerbate price declines during a down turn, because lower dividends don’t provide as much protection during the downturn.
Chart #5: Dividends vs Stock Buybacks
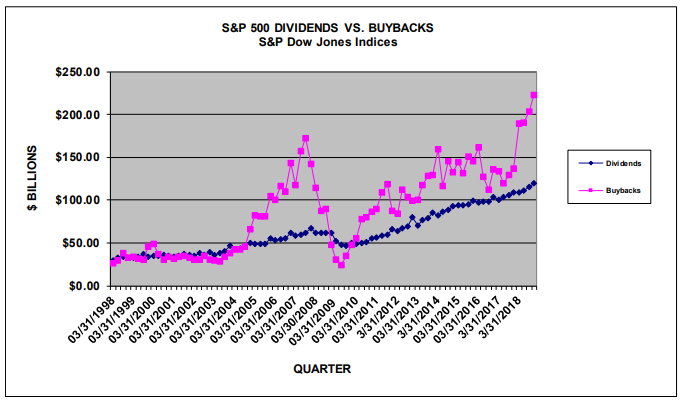
Source: S&P Dow Jones Indices
Table #1 shows the average performance of 400 equity funds in existence during the 2007 Bear Market by Lipper Categories separated by dividend yield. General observations are that 1) the S&P 500 and Growth Funds performed worse regardless of dividend yield, 2) large cap value performed better but still lost an over 25%, 3) Equity Income (Dividend) lost roughly 20 to 25 percent during the recessions, and 4) that higher yielding equity funds are often riskier. If an investor believes that a recession may be coming in the next year or two then it may be time to shift allocations to Equity Income and Value Funds. Two examples of top ranked funds are American Century Equity Income (TWEIX) and AMG Yacktman Focused (YAFFX), both of which are Great Owls.
Table #1: Fund Performance during Bear Markets
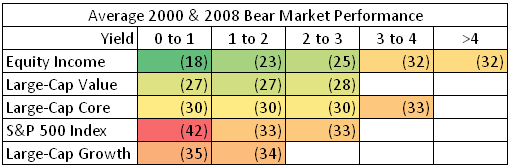
Created by the Author Based on Mutual Fund Observer Data
As I near retirement, I reflect on the importance of income. I divide yields by the Ulcer Index to find the best risk adjusted income. My perception is that stock buybacks have lowered dividend payouts and the decrease in stock buybacks during recessions means that smaller dividends are less incentive to own dividend equity funds during a recession. Table #2 summarizes nearly 600 funds using MFO Multisearch for funds that existed prior to the 2007 Recession and yield more than 4%. The Yield to Ulcer Index ratio measures the risk that an investor is taking for that income. Keep in mind, that the yield on municipal bonds is tax exempt. In my opinion, building a defensive income portfolio should incorporate lower risk bond funds as a priority over equity funds.
Table #2: Yield vs Risk
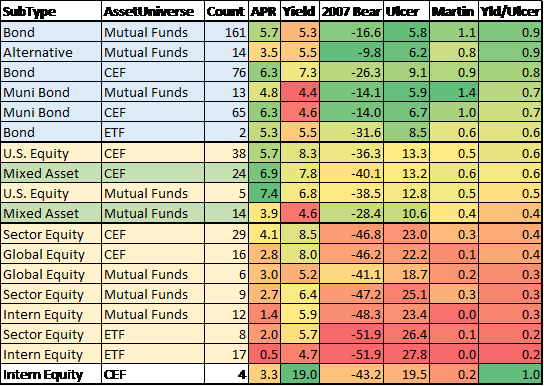
Created by the Author Based on Mutual Fund Observer Data
Rolling 3 Minimum Year Minimum Return vs Recovery Time
Someone recently suggested looking at returns versus recovery times. I downloaded over 700 funds that existed prior to the 2007 recession and grouped them by Lipper Category as shown in Chart #6. The blue box is the categories that I want to concentrate in prior to a recession. They have short recovery times and mostly positive gains during its worst three year rolling average.
Chart #6: Minimum 3 year Rolling Return vs Recovery Time
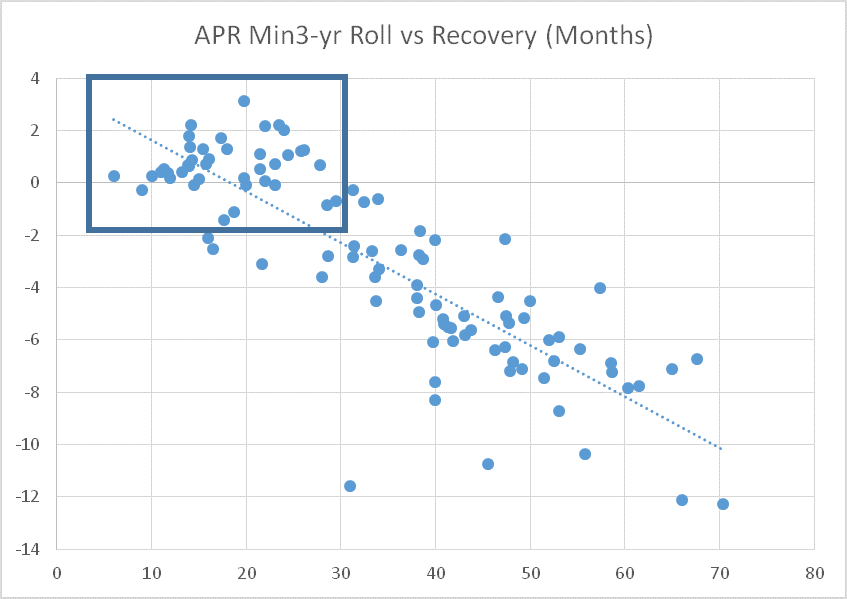
Source: Created by the Author based on Mutual Fund Observer
Table #3 contains most of the categories with the shortest recovery times and highest minimum rolling three year return. The Bear Column is the average return for the 2000 and 2007 bear markets.
Table #3: Lipper Categories with Short Recovery Time and High Returns (Minimum 3 Year Rolling)
| Lipper Category | Ulcer | MAXDD | Recovery Months | APR Min3-yr Roll | Bear | Yield |
| Alt Credit Focus | 0 | -0.9 | 9 | 0.6 | 6.7 | 3.3 |
| Shrt-Intmd invst Grd Debt | 0 | -1.4 | 6 | 1.4 | 3.5 | 2.9 |
| U.S. Treas Short | 0 | -1.5 | 6 | 0.2 | 8.0 | 2.5 |
| Ultra-Short Obligations | 0 | -1.3 | 6 | 0.3 | 2.8 | 2.4 |
| U.S. Gov Short | 0 | -1.5 | 8 | 0.2 | 4.6 | 2.0 |
| U.S. Gov Short-Intmd | 0 | -1.8 | 13 | 0.2 | 6.5 | 2.0 |
| Short invest Grade Debt | 1 | -2.6 | 10 | 0.6 | 4.9 | 2.6 |
| Muni Short-Intmd Debt | 1 | -2.7 | 11 | 0.7 | 5.3 | 1.8 |
| U.S. Mortgage | 1 | -4.3 | 14 | 0.5 | 5.7 | 2.6 |
| Muni Intmd Debt | 2 | -5.2 | 13 | 1.3 | 5.6 | 2.5 |
| Corporate Debt BBB-Rated | 2 | -7.2 | 9 | 1.2 | 4.1 | 2.9 |
| Corporate Debt A Rated | 2 | -8.1 | 14 | 1.8 | 3.6 | 3.0 |
| U.S. Gov Gen | 1 | -3.4 | 20 | -0.1 | 8.2 | 1.8 |
| Core Bond | 2 | -7.1 | 14 | 1.0 | 5.1 | 2.6 |
| Core Plus Bond | 2 | -7.5 | 13 | 0.7 | 4.3 | 2.8 |
| Muni Gen & Ins Debt | 2 | -8.0 | 17 | 1.7 | 4.1 | 3.0 |
| Global Income | 2 | -8.8 | 17 | 1.7 | 3.8 | 1.8 |
| Multi-Sector Income | 2 | -11.5 | 14 | 1.0 | 1.0 | 3.8 |
| International Income | 3 | -10.2 | 30 | -1.8 | 4.8 | 7.9 |
| Mxd-Ast Trgt Today | 3 | -16.0 | 23 | 1.9 | -6.2 | 2.2 |
| Mxd-Ast Trgt Alloc Consv | 4 | -18.0 | 24 | 2.3 | -6.1 | 2.4 |
| EM Hard Crncy Debt | 5 | -22.8 | 14 | -1.0 | -2.4 | 5.0 |
| Global High Yield | 5 | -26.0 | 14 | 0.9 | -10.2 | 5.7 |
| Mxd-Ast Target Alloc Mod | 7 | -28.1 | 32 | 0.2 | -12.3 | 2.0 |
| Large-Cap Value | 7 | -38.3 | 21 | 5.3 | -8.7 | 1.5 |
| Small-Cap Value | 8 | -32.5 | 26 | -1.1 | -2.0 | 1.2 |
| Real Estate | 8 | -35.0 | 28 | 3.6 | -27.6 | 4.3 |
| Equity Income | 10 | -35.6 | 38 | -2.8 | -11.2 | 2.3 |
Sideways Markets
Historically, stock performance has been only slightly better and sometimes marginally worse than bonds [during sideways markets]. [During] the 1966-1982 sideways market, stocks barely outperformed long-term bonds and were beaten by Treasury bills. Depending on what interest rates and inflation do over the next decade, broad market indexes may or may not be a superior investment to bonds, as P/E expansion will not be a source of stock returns.
– Vitaliy N. Katsenelson
To Mr. Katsenelson’s point, the S&P500 has returned 2.9% annualized for the past 18 months as the P/E ratio has been gradually falling from 25.5 in January 2018 to just over 22 now, a drop of 13%.
Interest rates have been falling for the past year or so and bonds funds have done well. The European Central Bank has lowered interest rates and is continuing bond purchases (quantitative easing). The Federal Reserve has lowered interest rates twice and is likely to continue as long as the economy is showing signs of slowing. Interest rates affect the price of the dollar which affects exports. The Federal Reserve is likely to continue lowering interest rates and bonds are likely to do well over the next year or so.
Don’t own stocks just to be invested. In the absence of attractive equity investments-the right stocks-fixed –income instruments (or cash) are viable alternatives to an “average” stock.
– Vitaliy N. Katsenelson
We don’t know that the economy will slip into a recession, and markets typically do well during an election year. Retirement Income, Mixed-Asset Target Allocation Conservative and Moderate funds are great choices for an uncertain time where markets may have some life left, but the risk of recession is rising.
During secular bull markets selling is frowned upon as buy-and-hold turns into investing religion… Emotions assault us from different directions when we face a sell decision: If it is a losing investment, we want to wait until we break even… Or when it comes to selling a winner, we want to sell only at the top. Again, this is the wrong attitude…
– Vitaliy N. Katsenelson
Understanding Risk
What risk means to us is shaped by our time horizon. If you are investing for the long run-at least five years-a permanent loss of capital is the risk that you that you should be concerned with the most… If you have a short-term horizon, to you volatility is not temporary. Even a temporary stock decline results in a permanent loss of capital, since you don’t have the time to wait it out… There is another important, although less tangible, issue with volatility: It impacts our emotions and makes us do the wrong things-buy high and sell low. For a very rational computer-like decision maker this is not an issue.
– Vitaliy N. Katsenelson
My risk tolerance varies with the business cycle and with approaching retirement. The Mutual Fund Observer Portfolio tool quantifies the risk in my portfolios. I use a time period that starts close to January 2018, as investors began started rotating to late stage assets. Portfolio rates most of my portfolios as Conservative (2), and provides APR Rating, Ulcer Index, and Martin Ratio. It allows me to evaluate the funds within my portfolio and alternative funds. This is particularly important for employer sponsored plans with limited fund selections.
The investing environment is infested with randomness-it is a continual professional hazard. Our skill, knowledge, and experience should help to reduce the risk of randomness, but completely eradicating it is impossible, since randomness is the nature of the investing jungle. Stay within your circle of competence and do in-depth research to decrease the amount of randomness and its impact on your portfolio… Finally, to help protect yourself from randomness-diversify.
– Vitaliy N. Katsenelson
Ranking System
While the next quote is about stocks, it is equally applicable to funds:
-
- Spend more time focusing on the process than on the end results… [Randomness] is as constantly present in investing as it is in gambling.
- Stocks should be purchased when the risk/reward equation is tilted in your favor and sold when that stops being the case. Stocks that became fairly valued, the ones that have exhausted their margins of safety and in which expected total rate of return… now fall below your expectations should be sold-period.
- Strict sell discipline will increase portfolio turnover and replacing stocks that are on the way out with new ones will become a priority.
– Vitaliy N. Katsenelson
The MFO ratings accurately describe funds with current and historical metrics. The 3 and 10 month trends are useful for estimating which funds are peaking or starting to accelerate. The price to earnings ratio is useful for estimating which funds may be overvalued and at risk of sharper declines. Leverage and bond quality provide insight into the performance during recessions. Building a ranking system is my way of speeding up the process of consistently identifying funds based on the criteria that I believe is important if we are headed toward a recession. I use Momentum (3 and 10 month trends, Returns), Quality (bond rating, low leverage, Fund Family Rating, Ferguson Metrics, composite ratings), Valuation (price to earnings ratio, price to cash flow, price to book), Risk (Ulcer Index, MFO Risk, capture metrics, debt to equity, performance during recessions), Risk Adjusted Returns (Martin Ratio, MFO Rank, Great Owl and Honor Roll Classification), and Income (Yield).
Table #4 contains the Lipper Categories that ranked highest over the past 18 months with some adjustments. The Bear column refers to the average performance during the 2000 and 2007 bear markets.
Table #4: Top Ranked Lipper Categories
| Objective | Ulcer | Martin | Yield | RTN 3 Mos | RTN 1 Yr | Bear |
| Gen & Ins Muni (Unlvrgd) | 0.4 | 18.3 | 3.3 | 3.7 | 11.2 | 2.3 |
| International Income | 0.8 | 57.6 | 5.0 | 2.4 | 8.2 | 4.8 |
| Alt Credit Focus | 0.1 | 23.2 | 4.0 | 2.5 | 6.6 | 6.7 |
| Shrt-Intmdt Invst Grd Dbt | 0.1 | + | 2.7 | 1.9 | 5.8 | 4.7 |
| General U.S. Gov | 0.2 | 17.4 | 2.3 | 2.6 | 7.4 | 8.7 |
| Gen & Ins Muni Debt | 0.4 | 15.0 | 3.1 | 3.1 | 9.4 | 2.4 |
| Intermediate U.S. Gov | 0.3 | 13.1 | 2.3 | 2.8 | 8.5 | 8.7 |
| Global Real Estate | 2.1 | 6.4 | 2.4 | 5.3 | 12.9 | (22.8) |
| Short U.S. Gov | 0.1 | 25.6 | 2.5 | 1.1 | 3.9 | 5.0 |
| Utility | 1.0 | 19.5 | 2.5 | 8.3 | 20.7 | (22.9) |
| General U.S. Treasury | 0.4 | 13.1 | 2.1 | 3.8 | 10.3 | 11.4 |
| Short-Interm U.S. Gov | 0.1 | 20.6 | 2.1 | 1.8 | 5.7 | 9.1 |
| Interm Muni Debt | 0.3 | 15.5 | 2.6 | 2.7 | 8.5 | 4.5 |
| Ultra-Short Obligations | 0.0 | + | 2.6 | 0.8 | 3.0 | 2.5 |
| Core Bond | 0.4 | 13.0 | 2.9 | 4.1 | 10.2 | 5.4 |
| Short U.S. Treasury | 0.1 | 18.0 | 2.3 | 1.1 | 3.9 | 7.8 |
| Corp Debt A Rated | 0.5 | 10.0 | 2.9 | 4.5 | 10.3 | 3.9 |
| Corp Debt BBB-Rated | 0.6 | 10.8 | 4.1 | 5.5 | 12.4 | 3.4 |
| High Yield Muni Debt | 0.7 | 12.9 | 4.5 | 4.0 | 10.4 | (13.1) |
| Short Invest Grade Debt | 0.0 | + | 2.6 | 1.2 | 4.3 | 2.8 |
| U.S. Mortgage | 0.3 | 27.0 | 4.0 | 2.3 | 7.5 | 6.6 |
| General Bond | 0.6 | 11.9 | 4.6 | 5.5 | 13.1 | 0.6 |
| EM Local Currency Debt | 1.0 | 6.7 | 4.7 | 4.3 | 15.1 | + |
| Real Estate | 1.7 | 9.2 | 4.9 | 6.2 | 13.1 | + |
| Global Income | 0.3 | 16.3 | 3.6 | 2.8 | 7.4 | 2.5 |
| Multi-Sector Income | 0.4 | 16.8 | 4.2 | 2.8 | 7.6 | 3.0 |
| Short-Intmdt Muni Debt | 0.2 | 31.4 | 2.1 | 1.8 | 5.8 | 4.1 |
| Inflation Protected Bond | 0.8 | 4.6 | 1.8 | 3.0 | 6.8 | 6.9 |
| Gen&Ins Muni Dbt (Lvrgd) | 0.6 | 12.8 | 4.2 | 3.9 | 11.4 | 0.4 |
| Income | 1.3 | 3.2 | 2.5 | 4.0 | 6.8 | (7.1) |
| Equity Income | 2.6 | 2.8 | 2.4 | 6.2 | 8.1 | (13.9) |
| Growth & Income | 1.7 | 3.2 | 2.2 | 4.4 | 6.6 | (14.7) |
| Short Muni Debt | 0.1 | 5.3 | 1.8 | 1.0 | 3.1 | 4.4 |
| Flexible Income | 1.7 | 2.7 | 5.0 | 3.7 | 7.2 | (6.9) |
| Consumer Goods | 3.0 | 2.8 | 2.1 | 9.1 | 12.0 | (15.9) |
Table #5 contains the top ranked funds in the top ranked Lipper Categories. The funds are a starting point for research and not a recommended list.
Table #5: Top Ranked Funds by Lipper Category
| Objective | Vanguard | CEF | ETF | Other |
| General & Insured Muni (Unlvrgd) | NXR | |||
| International Income | VTABX | IAGG | ||
| Alternative Credit Focus | FPNIX | |||
| Short-Intmdt Invest Grade Debt | VCSH | SDMQX | ||
| General U.S. Government | AGZ | SNGVX | ||
| General & Insured Municipal Debt | VWAHX | FMB | BATEX | |
| Intermediate U.S. Government | VSIGX | VGIT | USGNX | |
| GNMA | VFIIX | SEGMX | ||
| Global Real Estate | MGLIX | |||
| Short U.S. Government | VSGBX | FTSD | PIASX | |
| Utility | VPU | |||
| General U.S. Treasury | VFITX | ITE | BTIAX | |
| Short-Intermediate U.S. Government | STOT | |||
| Intermediate Municipal Debt | VWITX | NIQ | ITM | BIAEX |
| Ultra-Short Obligations | VUSFX | GSY | TRBUX | |
| Core Bond | VBILX | FBND | DODIX | |
| Short U.S. Treasury | VFISX | SCHO | GUSTX | |
| Corporate Debt A Rated | USAIX | |||
| Corporate Debt BBB-Rated | BHK | VCIT | ISCFX | |
| High Yield Municipal Debt | CXE | ORNAX | ||
| Short Investment Grade Debt | VFSTX | SPSB | LALDX | |
| U.S. Mortgage | BKT | CMBS | VSCFX | |
| General Bond | MCR | BAB | ||
| Emerging Markets Local Crncy Debt | VEMBX | |||
| Real Estate | VGSLX | RNP | ||
| Global Income | HOLD | PRSNX | ||
| Multi-Sector Income | BYLD | IOFIX | ||
| Short-Intmdt Municipal Debt | VMLTX | OPITX | ||
| Inflation Protected Bond | VAIPX | SCHP | SWRSX | |
| Gen & Ins Muni Debt (Leveraged) | NUV | |||
| Global | VMNVX | ACWV | MVGIX | |
| High Yield | VWEHX | CJNK | DHHIX | |
| Growth | SPLV | MLVHX | ||
| Alternative Global Macro | IYLD | DVRIX | ||
| Income | VWINX | AOK | DIFAX | |
| Equity Income | DJD | PRBLX | ||
| Growth & Income | VGWAX | ONEV | JRFOX |
Table #6 contains my top ranked funds. I am biased toward Fidelity and Vanguard, but include other funds for interested readers.
Table #6: October Top Ranked Funds
| Symbol | Name | Premium | CAGR | Ulcer | Martin | Yield | 2007 Bear |
| OPITX | Invesco Oppen Roch SDHY Muni | 12.6 | 0.1 | 110.0 | 3.0 | -6.9 | |
| VSCFX | Voya Securitized Credit P | 7.0 | 0.1 | 91.9 | 5.5 | – | |
| VTABX | Vanguard Total Intern Bond | 8.6 | 0.1 | 85.1 | 2.8 | – | |
| VCSH | Vanguard Short-Term Corp Bond | 5.1 | 0.0 | 62.5 | 2.8 | – | |
| LALDX | Lord Abbett Short Dur Inc | 4.1 | 0.1 | 35.6 | 3.8 | 2.0 | |
| BIAEX | Brown Advisory Tax Ex Bond | 6.8 | 0.2 | 28.2 | 3.1 | – | |
| GUGAX | GMO Core Plus Bond III | 9.5 | 0.3 | 21.4 | 4.2 | -16.3 | |
| VSGBX | Vanguard Short-Term Fed Inv | 3.8 | 0.1 | 20.3 | 2.3 | 7.1 | |
| NXR | Nuveen Select Tax-Free Inc | -3.3 | 9.4 | 0.4 | 19.3 | 3.1 | 0.0 |
| AGZ | BlackRock iShares Agency Bond | 5.9 | 0.2 | 15.8 | 2.4 | – | |
| BATEX | BlackRock Alloc Target Shares | 9.0 | 0.5 | 15.3 | 4.0 | – | |
| VFISX | Vanguard Short-Term Treas | 3.6 | 0.1 | 15.3 | 2.5 | 6.8 | |
| VGIT | Vanguard Interm Treasury | 7.2 | 0.3 | 14.9 | 2.2 | – | |
| BAB | Invesco Taxable Muni Bond | 11.4 | 0.7 | 13.6 | 3.8 | – | |
| DODIX | Dodge & Cox Income | 6.4 | 0.3 | 13.4 | 3.0 | -0.3 | |
| VFITX | Vanguard Interm Treasury | 7.2 | 0.4 | 13.4 | 2.4 | 10.4 | |
| NUV | Nuveen Muni Value | -1.2 | 8.2 | 0.5 | 13.2 | 3.5 | -5.4 |
| USAIX | USAA Income | 7.5 | 0.5 | 10.8 | 3.2 | -3.2 | |
| ISCFX | Voya Investment Grade Credit SMA | 9.7 | 0.7 | 10.3 | 3.9 | 0.3 | |
| JRFOX | John Hancock Multi-Index Inc Prsv | 5.7 | 0.4 | 9.8 | 2.5 | – | |
| VFIIX | Vanguard GNMA Inv | 5.4 | 0.3 | 9.6 | 2.9 | 7.4 | |
| BHK | BlackRock Core Bond Trust | -6.9 | 12.7 | 1.2 | 8.9 | 4.9 | -11.9 |
| SPLV | Invesco S&P 500 Low Vol | 16.5 | 1.8 | 7.8 | 2.0 | – | |
| PRSNX | T Rowe Price Glbl Multi-Sctr Bond | 6.9 | 0.7 | 7.0 | 3.5 | – | |
| VEMBX | Vanguard EM Bond | 9.1 | 1.0 | 6.7 | 4.7 | – | |
| VWINX | Vanguard Wellesley Income Inv | 8.2 | 1.0 | 6.3 | 2.9 | -14.5 | |
| XMPT | VanEck Vectors CEF Muni Inc | 11.9 | 2.1 | 4.7 | 4.0 | – | |
| YAFFX | AMG Yacktman Focused N | 8.6 | 1.7 | 3.7 | 1.5 | -30.4 | |
| LVHD | Legg Mason Low Volatility High Div | 9.6 | 2.1 | 3.5 | 3.7 | – | |
| TRECX | T Rowe Price EM Corp Bond | 6.2 | 1.2 | 3.5 | 4.7 | – | |
| VMNVX | Vanguard Global Min Vol | 10.8 | 2.5 | 3.5 | 2.1 | – | |
| TAIAX | Amer Funds Tax-Adv Growth & Inc | 5.5 | 1.5 | 2.3 | 2.5 | – | |
| IYLD | BlckRck iShares MS Multi-Asset Inc | 4.9 | 1.4 | 2.0 | 5.3 | – |
Closing
Following the process described in this article, I have been reducing risk in my portfolio for over a year. I am pleased with its low risk, high risk adjusted performance. I evaluate the economy each month to form an intermediate view of the economy and investment environment. I then evaluate which funds in my portfolio are “losing their margin of safety”. I limit changes to my portfolio to less than 2% of assets to avoid over-reacting and trading too often.
I appreciate the invaluable service that Mutual Fund Observer has contributed to developing a low risk, high risk adjusted portfolio. With the data from the St. Louis Federal Reserve FRED database and Mutual Fund Observer, the process takes about 2 hours per month. Researching funds and writing articles is the time consuming, but enjoyable hobby.