


How much is “enough” to retire when there are likely to be multiple decades of low returns due to high starting valuations with low yields and dividends?
- Section 1 of this article summarizes the investment philosophies of John Bogle, Warren Buffett, Ed Easterling, Charles Ellis, Benjamin Graham, and Howard Marks.
- Section 2 looks at the benefits of combining actively and passively managed funds to reduce risk.
- Section 3 shows the impact of high valuations and inflation for over 120 years.
- Section 4 covers stock and bond performance during secular bear markets with rising inflation and interest rates.
- Section 5 looks at nearly two dozen lower risk funds for investors seeking “all-weather” funds or safer yield.
- Section 6 provides estimates of “enough” for retirement in the coming decades.
Readers can skip to sections that interest them. Key points are added at the beginning of each section for those who want to skip ahead.
John Bogle, Founder of the Vanguard Group, wrote Enough: True Measures of Money, Business, and Life, where he talks about integrity and the high fees associated with investing. He says that if you carry nothing else away from the book, remember:
“The great game of life is not about money; it is about doing your best to join the battle to build anew ourselves, our communities, our nation, and our world.”
1. Philosophy of Wise Investors
Key Point: Set expectations and strategies according to the investment environment, especially valuations.
In 1999, Mr. Bogle was “concerned about the (obviously) speculative level of stock prices.” Mr. Bogle reduced his equity exposure to about 35 percent of assets, which he held through the time of writing Enough in 2010. The following quote is applicable about market conditions twenty years later:
“Clearly, investors would have been wise to set their expectation for future returns on the basis of the current sources of returns rather than fall into the trap of looking to past returns to set course. That dividend yield as 2000 began was at an all-time low of just 1 percent and the P/E at a near record high of 32 times earnings together explain why the average return on stocks in the current decade is at present running at an annual rate of less than 1 percent.”
Similarly, Benjamin Graham, Warren Buffett’s mentor, described in The Intelligent Investor that allocations should never be less than 25% to stocks, nor more than 75% based on market conditions. Warren Buffet closed Buffett Partnership in 1969 because of valuations:
However, I just don’t see anything available that gives any reasonable hope of delivering such a good year and I have no desire to grope around, hoping to “get lucky” with other people’s money. I am not attuned to this market environment and I don’t want to spoil a decent record by trying to play a game I don’t understand just so I can go out a hero.
In Mastering the Market Cycle: Getting the Odds on your Side, Howard Marks, co-founder of Oaktree Capital Management, expresses his investment philosophy:
In my view, the greatest way to optimize the positioning of a portfolio at a given point in time is through deciding what balance it should strike between aggressiveness/defensiveness. And I believe the aggressiveness/defensiveness should be adjusted over time in response to changes in the state of the investment environment and where a number of elements stand in their cycles.
Ed Easterling at Crestmont Research does an excellent job writing about secular markets that can extend for decades. Below is an excerpt from Destitute At 80: Retiring In Secular Cycles which he wrote in 2007.
Although history provides an average outcome across a wide variety of market conditions, it is only relevant today to consider periods with characteristics similar to today. Given the significant impact of valuation on returns, that factor will be a major driver for today’s investors and retirees… As we are now in the upper quartile (i.e. top 25%) of valuations, our expected results are well below average. So much so that realistic expectations or portfolio management is needed for potential success… If you can live off of a 3%, or maybe 4%, withdrawal rate, then today’s financial markets should provide you with retirement success. If you need 4% to 5%, then you will need a more consistent and higher return profile for your portfolio than simply passive investments in today’s stock market.
Charles Ellis, Author of Winning the Loser’s Game, has the following to say about beating the market and the difficulty that individuals have in general.
Unhappily, the basic assumption that most institutional investors can outperform the market is false. Today, the institutions are the market. Institutions do over 95 percent of all exchange trades and an even higher percentage of off-board and derivatives trades. It is precisely because investing institutions are so numerous and capable and determined to do well for their clients that investment has become a loser’s game. Talented and hardworking as they are, professional investors cannot, as a group, outperform themselves. In fact, given the cost of active management—fees, commissions, market impact of big transactions, and so forth—investment managers have and will continue to underperform the overall market…
Holding onto a sound policy through thick and thin is both extraordinarily difficult and extraordinarily important work. This is why investors can benefit from developing and sticking with sound investment policies and practices. The cost of infidelity to your own commitments can be very high.
The philosophies of Bogle, Buffett, Graham, Howards, and Easterling have strong similarities, although it may be surprising to many that Mr. Bogle adjusted his allocations due to high valuations since he is famous for passive indexing. The next section reconciles the passive indexing philosophy of Mr. Ellis to explain the strategy to mix actively and passively managed funds in order to reduce risk.
2. Combining Passively and Actively Managed Funds to Reduce Risk
Key Point: Investors can benefit from indexing for lower costs and from actively managed funds to better manage risk. The majority of the funds covered in Section 5 are actively managed.
Figure #1 and the following explanation reconciles the philosophy of Mr. Ellis with actively managed funds. I extracted all Fidelity mutual funds and calculated the average return for the past five years per Lipper Category of passively and actively managed funds, as well as for draw down, risk (Ulcer Index), risk-adjusted return (Martin Ratio). The conclusion is that for funds in similar Lipper Categories, there is no significant advantage nor disadvantage for being actively or passively managed (other than possibly tax costs which were not evaluated). Mr. Ellis is correct that the benefits of being actively managed are offset by the higher costs, which in the case of Fidelity, actively managed funds cost an additional 0.59% over the passively managed funds. There are 85 actively managed and 22 passively managed funds for a total of 107 funds in 19 Lipper Categories. There are another 173 actively managed funds in 73 Lipper Categories for which there is not a passively managed equivalent.
Figure #1: Passively vs. Actively Managed Funds by Lipper Category – Five Years
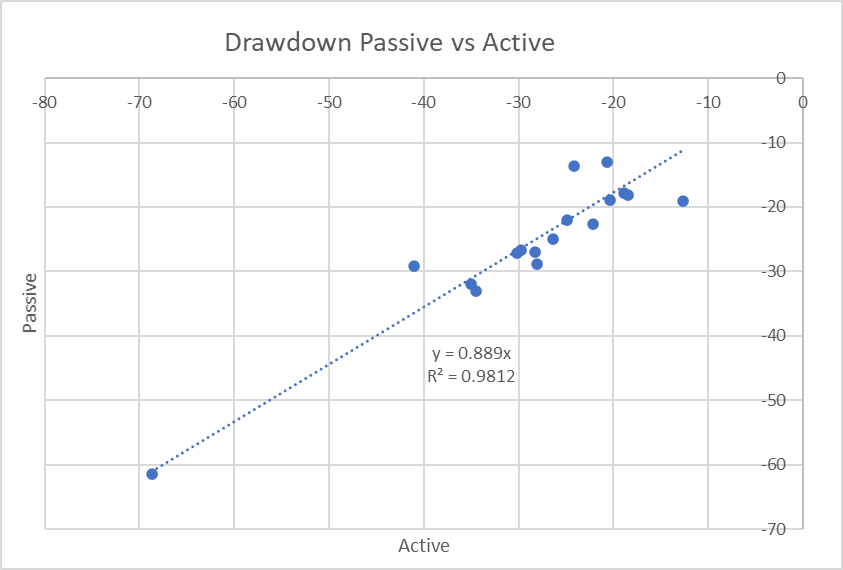
Source: Created by the Author Based on Mutual Fund Observer
The benefit of these actively managed funds is to provide diversification across asset classes and/or allow investors to segment the market. These two categories can be further subdivided into risk management such as mixed-asset funds or timing business and investment cycles. Table #1 contains some of the Lipper Categories with the lowest risk and highest risk-adjusted returns of actively managed funds over the past five years.
Table #1: Actively Managed Funds with Low Risk and High Risk-Adjusted Returns
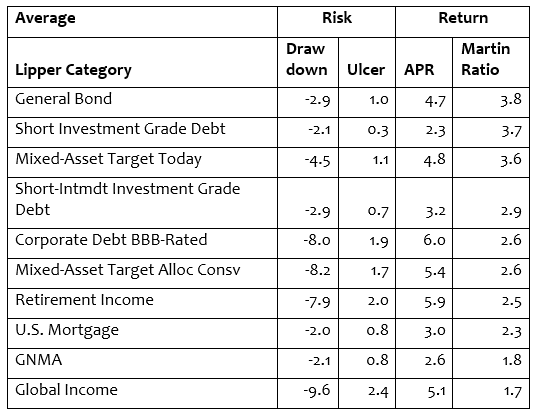
Source: Created by the Author Based on Mutual Fund Observer
3. Impact of High Valuations on Retirement Savings
Key Point: Long periods of strong performance often result in high valuations and are followed by long periods of low performance. Valuations are now at extreme levels and we should expect lower returns over the next decade or two.
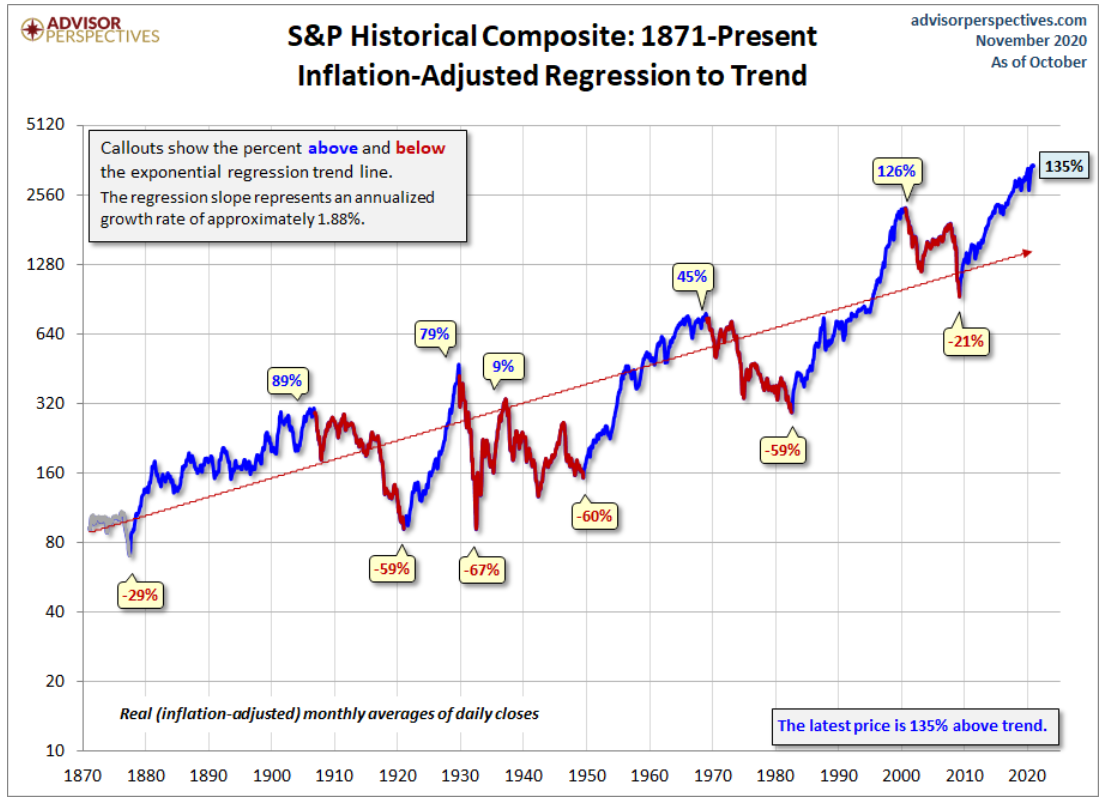
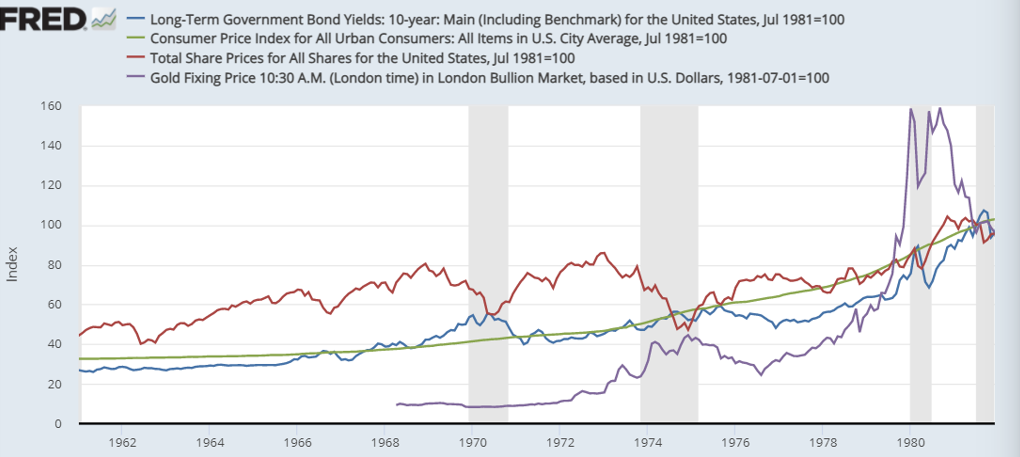
Jill Mislinski provides a current update on secular bull and bear markets in Figure #2. A secular bear market occurs when equity returns are less than inflation. Each secular bear market has different characteristics. For example, Government 10 year yields rose from 3% in 1961 to 15% in 1981, while they fell from 6% in 1999 to 3% in 2009. Currently stock prices are 135% of the long term trend which is a historical high.
Figure #2: Secular Markets
Ms. Mislinski also provides an update on several different measures of valuation in Figure #3. Most valuation methods are near the extremes of the Technology Bubble (2000). The current environment with low yields has some similarities to the 1960’s secular bear market, and with high valuations some similarities to the secular bear market that began in 2000.
Figure #3: Valuations are Currently High
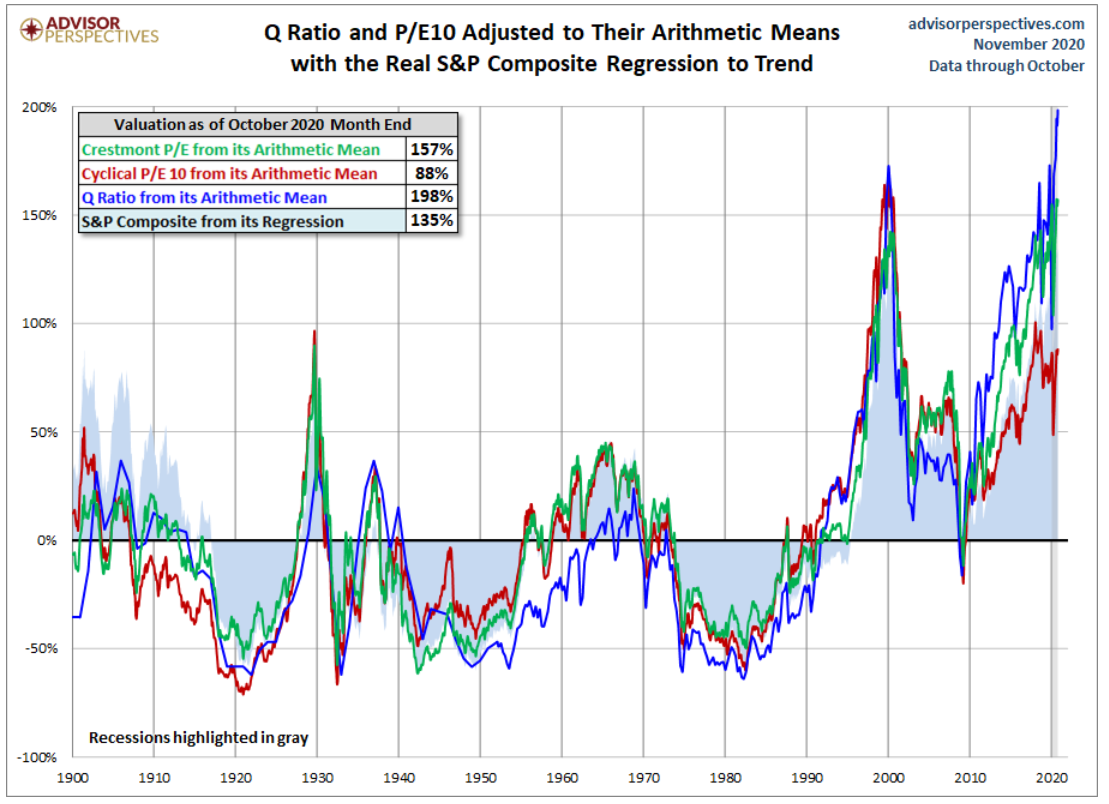
Source: Is the Market Still Overvalued?
4. Stock and Bond Performance During Secular Bear Markets
Key Point: During secular bear markets which usually begin with high valuations, conservative portfolios typically outperform more aggressive portfolios. Even in bond bear markets caused by rising interest rates, bonds have positive returns over long time periods and reduce risk in a portfolio.
This section looks at successful investing strategies for secular bear markets during which interest rates and/or inflation may rise. Fidelity produced the following table which shows how different allocations have performed from 1926 to 2019 during their worst 20 year time periods. These returns are not adjusted for inflation. All four hypothetical portfolios made annual returns of about 3% during their worst 20 year periods which often is offset by inflation. Being more aggressive during a secular bear market does not result in higher returns for the market as a whole. Inflation has eaten half of the purchasing power of a dollar over the past twenty years.
Table #2: Performance of Model Portfolios in Best and Worst 20 Year Periods
1960’s Secular Bear Market
The 1960’s and 1970’s covered the Vietnam War and suffered from the oil embargo followed by high inflation and low growth, known as stagflation. President Nixon ended the convertibility of the dollar to gold in 1971, allowing the gold price to float. Yields on 10 year government bonds rose from 3% in 1962 to 8% in 1977 and on to 15% in 1981. Stock prices more than doubled in nominal terms while falling in half when adjusted for inflation. Including stock dividends, inflation adjusted returns on equities were slightly positive for the twenty year period. Average dividends during these two decades were 3.8% compared to less than 2% now. With rising rates, bonds still had positive returns. During the 1973 to 1974 bear market, bonds lost money, but less so than stocks. Bonds performed relatively well over this period, but higher inflation favors stocks over bonds. Gold was a good hedge “at times” against uncertainty.
Figure #4: Inflation, Bond Yields, Gold, and Stocks 1961 – 1981
Source: Created by the Author Based on the St. Louis Federal Reserve (FRED)
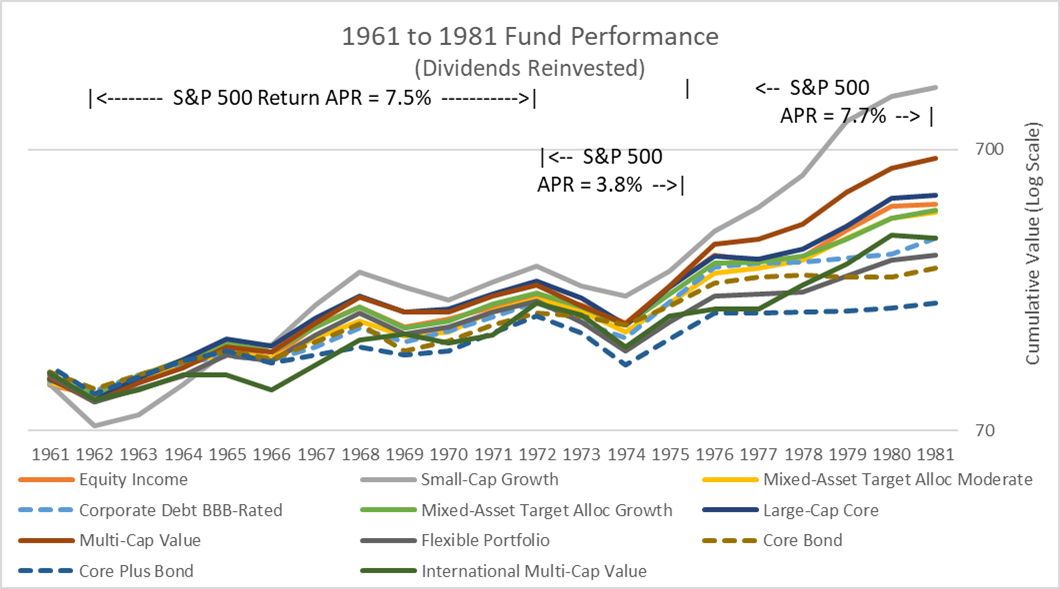
In nominal terms, stocks and bonds performed in a seemingly normal manner during the 1960’s secular bear market in spite of the “bond bear market” resulting from rising rates. Note that stocks do outperform bonds in high inflation periods (1976 to 1981). Moderate allocation funds did about as well as equity funds during the 1961 to 1981 secular bear market and with less draw down.
Figure #5: Fund Performance Including Dividends and Excluding Inflation
Source: Created by the Author Based on Mutual Fund Observer
2000’s Secular Bear Market
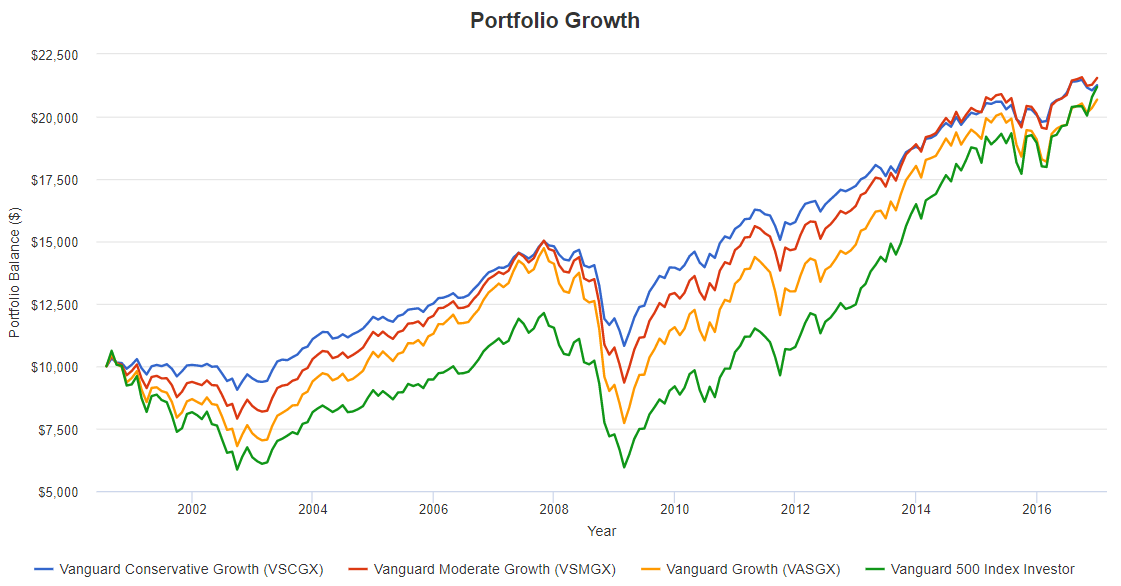
Figure #6 shows it took the S&P 500 17 years to catch up to the Vanguard LifeStrategy Conservative Growth (VSCGX) fund following the bursting of the Technology Bubble in 2000.
Figure #6: Tech Bubble Secular Bear Market Conservative Outperforms Aggressive
Source: Created by the Author Using Portfolio Visualizer (link)
5. Searching for Absolute Return
Key Point: Fees in many actively managed funds have come down and the funds covered in this section may reduce risk by adjusting exposures according to changes in the environment or using options. The S&P 500 had a drawdown of 20% on a monthly basis compared to those in this article that had less than half of that.
Mr. Easterling explains absolute return investing in Rowing vs. The Roller Coaster in January 2007 prior to the bursting of the housing bubble and subsequent financial crisis.
A key value of the hedge fund style of investing—so called “absolute return” investing—is its focus on controlling downside losses and capturing a reasonable share of the upside. As the analysis and studies have shown, as downside risk is controlled, not only does it provide investors with a reduced risk profile and more comfortable ride, but also it requires much less of the market’s upside to deliver the same level of return.
As a quick update on funds, ATAC Rotation Fund Investor Class (ATACX) absolute return fund is now available as ATAC US Rotation ETF (RORO). Columbia Thermostat Fund (CTFAX) is also available as a no-load, no transaction fee fund at Charles Schwab as well as Fidelity, and (COTZX) is available through Vanguard. KL Allocation (GAVIX) is lowering the minimum required investment next year.
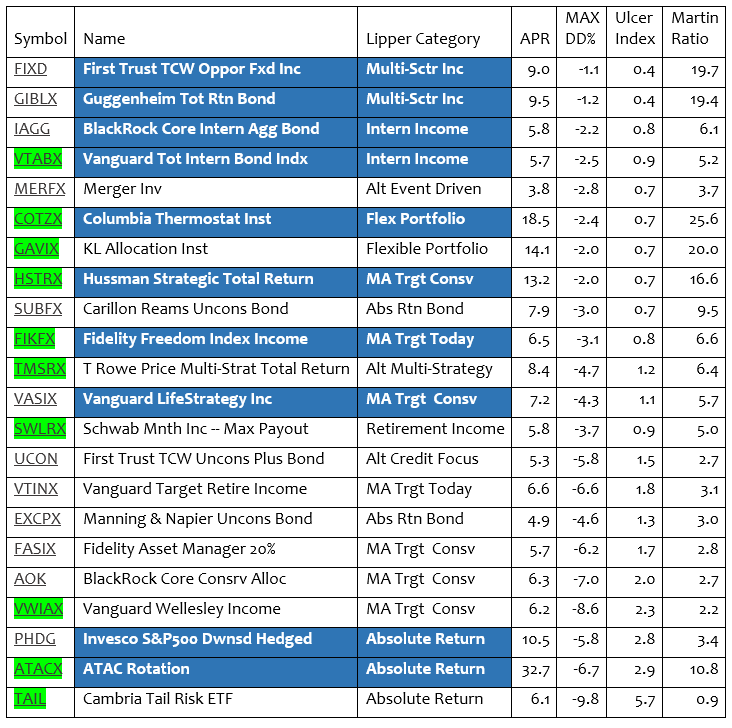
This article is the basis for my investing strategy for the coming decade to continue to invest in a conservative, balanced portfolio using a bucket approach and to look for ways to add downside protection. The following tables focus on funds with low to moderate risk (as measured by Ulcer Index) that have high risk-adjusted returns (as measured by the Martin Ratio). The funds are generally listed from lowest risk to highest. All funds have a lower risk (Ulcer Index) than the S&P 500, which is 6.1 for comparison. Fund Family Rating, expenses, assets under management, and three-month performance were among the other factors used to select the funds. While not part of the selection criteria, all but three of the funds are actively managed funds befitting a low risk, versatile strategy. The Symbols highlighted in green are some of the funds that I own. The Names highlighted in blue are either MFO’s Great Owl Funds or on the MFO Honor Roll. The funds are intended to be those available to most small investors. Table 3 contains the Risk and Return Metrics, Table 4 covers short term and bear market returns, and Table 5 has basic information.
Table #3: Low Risk Funds for the Coming Decade – Risk and Risk Adjusted Returns (1.5 Years)
Source: Created by the Author Based on Mutual Fund Observer
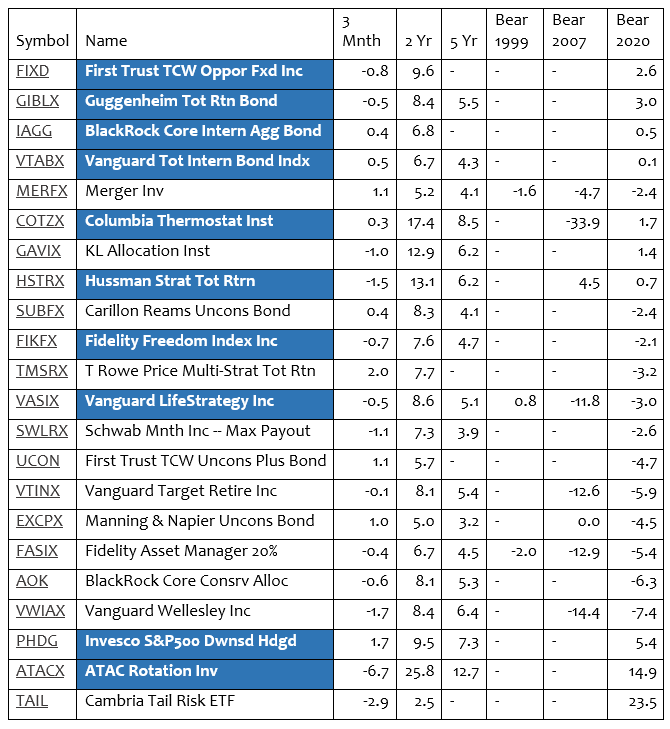
Table #4 shows the short term performance of the funds and how they have performed during bear markets. The three month performance is shown to reflect how sensitive the fund might be to low or rising interest rates.
Table #4: Low Risk Funds for the Coming Decade – Performance (1.5 Years)
Source: Created by the Author Based on Mutual Fund Observer
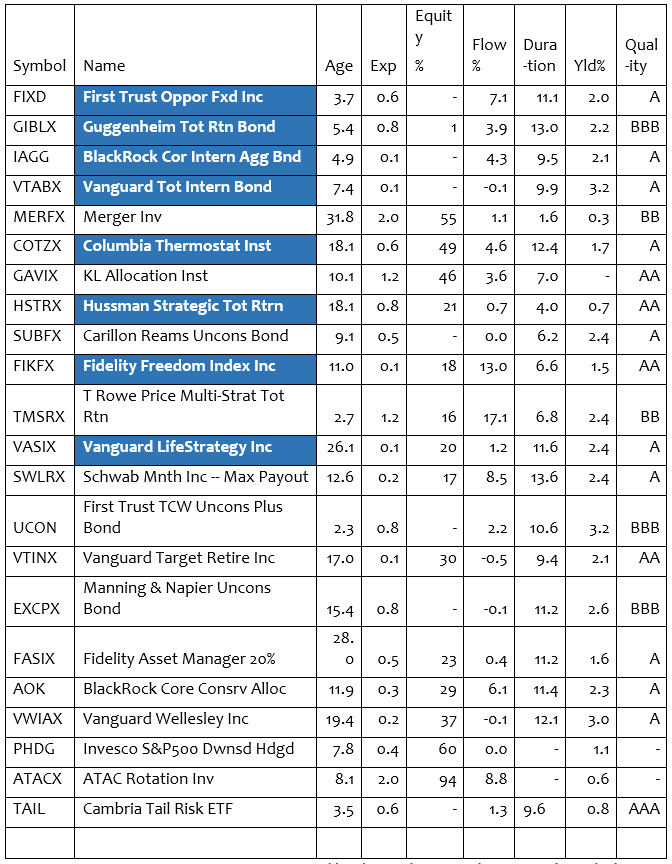
Table #5 contains basic information. All funds have more than $100M in assets under management. Flow is the percent of flows into or out of the fund.
Table #5: Low Risk Funds for the Coming Decade – Basic Information
Source: Created by the Author Based on Mutual Fund Observer
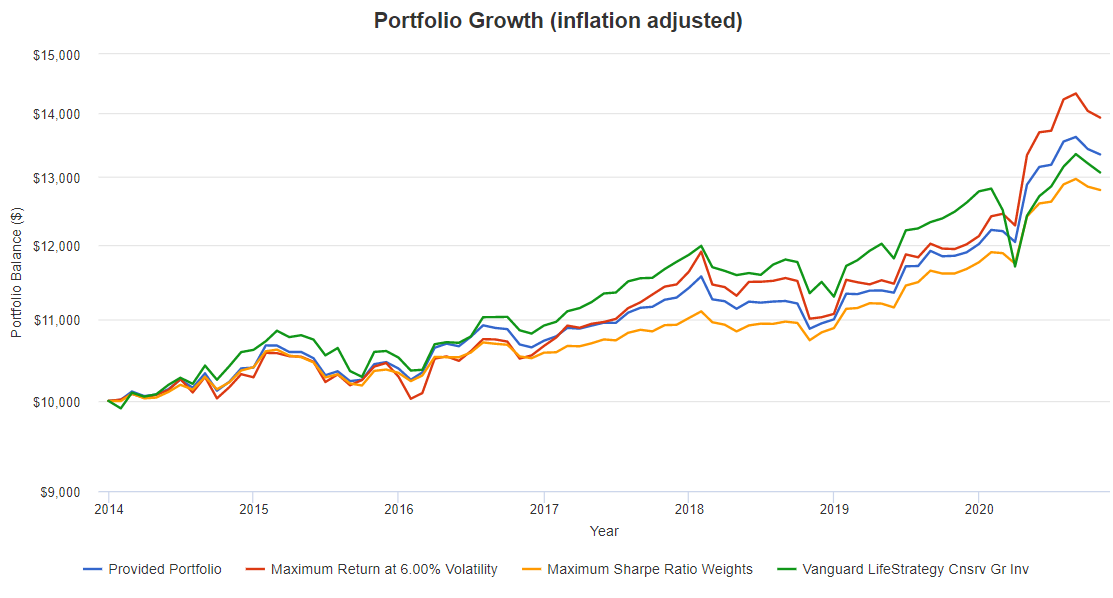
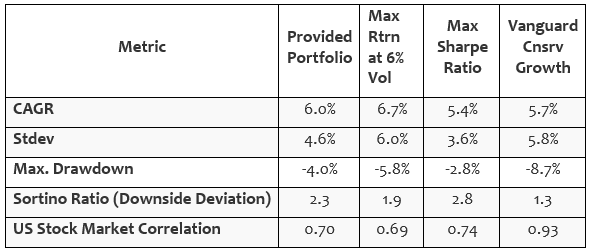
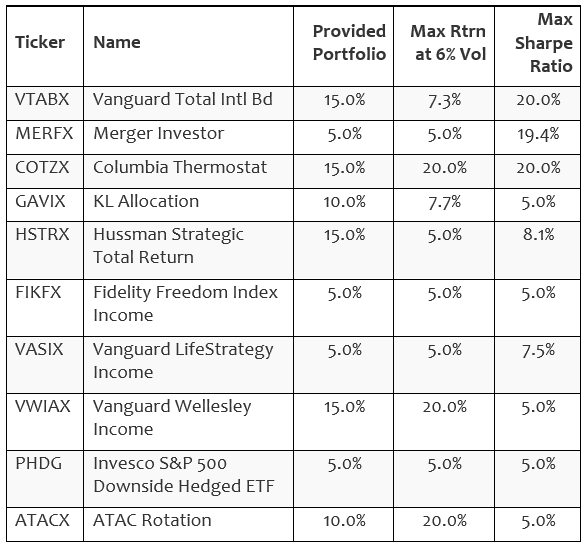
As a final check, I ran created three portfolios in Portfolio Visualizer as shown in Figure #7 for the past seven years compared to the Vanguard LifeStrategy Conservative Growth Portfolio. Minimum and maximum constraints were applied. The link is provided here. No, the next seven years are not likely to be the same as the past seven years. There will probably be another large correction and bonds won’t benefit from falling rates. The funds were selected to perform well in down markets. And history? It doesn’t repeat itself, but it rhymes.
Figure #7: Three Optimized Portfolios vs LifeStrategy Conservative Growth – 7 Years
Source: Created by the Author Using Portfolio Visualizer
During the past seven years, these portfolios averaged 5% to 7% returns with maximum drawdowns of 3% to 9%.
Table #6: Metrics
Source: Created by the Author Using Portfolio Visualizer
Table #7: Allocations
Source: Created by the Author Using Portfolio Visualizer
How did I use this information? I traded another Vanguard fund for the Vanguard LifeStrategy Conservative Growth Fund because it is less risky and I don’t want to lower my equity ratio. Secondly, I am looking to buy an Absolute Return fund and decided on the new ATAC US Rotation ETF (RORO) instead of PHDG. Another fund that I like is the T. Rowe Price Multi-Strat Total Return Fund (TMRSX).
6. How Much is Enough?
Key Point: “Enough” is dependent upon living expenses, home equity, pensions, future market returns, and inflation among other factors. A good rule of thumb is to have ten times your salary saved up by retirement age excluding home value and pensions.
Mr. Easterling estimates that in the worst 30 year periods for returns, a million dollar portfolio with a 4% withdrawal rate (plus inflation adjustments) had a 21% probability of being depleted. The Net Worth by Age Calculator for the United States in 2020 can be used to estimate that a person with $1M (including home equity and private pensions) near retirement age fits in at the upper 20% of savers, and $2M to be in the top 10%.
A survey of Charles Schwab customers shows that participants estimate that they will need nearly $2M to retire comfortably, and that nearly 15% say that they are unlikely to save this amount. Credit Suisse estimates that there are 20M millionaires in the United States including the value of the home and private pensions.
How much is “enough” for a retiree depends on many factors including health, home equity, lifestyle, pensions, and unknown future market returns. People planning on retirement should include a margin of safety because in addition to low probable returns, pensions including social security benefits can be reduced, inflation reduces purchasing power, and taxes can go up. As a guideline for target savings, Fidelity’s rule of thumb is to save at least 1x your salary by age 30, 3x by 40, 6x by 50, 8x by 60, and 10x by 67. This does not take into account specifics such as home equity and pensions. The median household annual income is approximately $70,000, making the $1M retirement savings goal a realistic starting point. As can be seen from these sources, $2M may make a better target.
If an investor has not saved enough, including a margin of safety, they should start with creating a lifetime budget and/or seeing a financial adviser. There may be several options to prepare for retirement: 1) save more, 2) cut expenses, 3) pay off debt, 4) work longer if possible, 5) defer social security, 6) get insurance, 7) downsize the home, 8) refinance the home, 9) annuitize enough to pay expenses, withdraw less early on, and educate ourselves on investing.
Closing
Several readers have expressed an interest in the topic of “As I Age,” and it sounds like a good next article. The funds in this article are intended for someone who wants to keep it simple and manage risk. I will continue my research on managed accounts and gradually shift more assets to the right ones.
True story, Word of Honor: Joseph Heller, an important and funny writer now dead, and I were at a party given by a billionaire on Shelter Island. I said, “Joe, how does it make you feel to know that our host only yesterday may have made more money than your novel ‘Catch-22’ has earned in its entire history?” And Joe said, “I’ve got something he can never have.” And I said, “What on earth could that be, Joe?” And Joe said, “The knowledge that I’ve got enough.” Not bad! Rest in peace!”
Stay Safe and Enjoy the Holidays!
Disclaimer
I am not an economist nor an investment professional. I became interested in economic forecasting and modeling in 2007 when a mortgage loan officer told me that there was a huge financial crisis coming. There were signs of financial stress if you knew where to look. I have read dozens of books on business cycles since then. Discovering the rich database at the St. Louis Federal Reserve (FRED) provides most of the data to create an Investment Model. The tools at Mutual Fund Observer provide the means for implementing and validating the Investment Model.