


Mention of “trending funds” often invokes thoughts of investors pouring into the hottest fund and that is probably true to an extent. This article looks at stages of trends for funds. This is an evolving experiment based on data about trends, moving averages and money flows from MFO Premium. As someone nearing retirement, I own core funds that are buy and hold for extended periods. I also invest a portion to take advantage of the economic and investing environment. Investors should develop storylines of why they own funds such as low valuations, a declining dollar, inflation, and stimulus expectations, but should look for confirming trends before investing.
The first stage of trending funds is after a correction for funds that are starting to recover, which I designated as the Bottom-Fishing stage. The second stage (Crossing) looks for funds that are near their ten-month moving average which means their recovery is on solid footing. The Trending stage contains funds that are above their 10-month moving average and are growing at a strong pace. Peaking Funds are those that have risen, and the growth has slowed to the point that investors may want to monitor them and consider rotating to other opportunities. Finally, there are the Declining Funds which I expect to use to identify funds to rotate out of.
As I write this article, the S&P 500 just fell 2.5% while my portfolio fell less than 0.5%. While looking for trending funds, I consider safety first and then returns. If the market continues to fall, there will be buying opportunities.
This article is set up in the following sections so readers may skip to sections that interest them. Key points are added at the beginning of each section for those who want to skip ahead. All data is as of the end of December 2020. I will provide updates in Seeking Alpha when the January data is released.
- Section 1 lists the highest trending funds for each stage.
- Section 2 evaluates trend fundamentals using the S&P 500
- Section 3 describes the methodology used to select these funds.
- Section 4 describes the trending metrics of the funds.
1. Beginning with the End in Mind
Key Point: Real estate, international, commodity, and value funds have started trending up in several of the trending stages.
One of my earlier methods of looking for trending funds was to look at the Lipper Categories with the highest fund inflows. This is shown in Table #1 for December. Rank refers to my ranking system.
Table #1: Trending Lipper Categories – Two Year Metrics ending December 2020

I want to invest at the start of a trend. Bottom Fishing currently contains Real Estate, Financial Services, and Commodity funds. Crossing contains funds value, industrial, international small-cap, and industrial funds that have a firm base for growth and are within 2 percent above or below the ten-month moving average. Because of the surge in COVID and the slowing of global economies, I recently sold European funds.
Table #2: Top Bottom Fishing Funds and Those Crossing the Ten-Month Moving Average
|
Bottom Fishing |
Crossing |
|
|
1 |
CSRSX : Cohen & Steers Realty Shares Inc |
VWNDX : Vanguard Windsor |
|
2 |
VNQ : Vanguard Real Estate |
VEUSX : Vanguard European Stock |
|
3 |
IYR : BlackRock iShares US Real Estate |
VGK : Vanguard European Stock |
|
4 |
FIDSX : Fidelity Financial Services Port |
FISMX : Fidelity Intern’l Small Cap |
|
5 |
DBC : Invesco DB Cmdty Tracking |
FCYIX : Fidelity Select Industrials |
I have two methods for tracking funds with more established upward trends based on fund flows and trending metrics. These funds have recovered and are growing at a respectable pace. These are currently mostly value and international funds. Funds that are at risk of being overvalued, “the hot funds” are excluded.
Table #3: Top Trending Funds with Those High Inflows
| Fund Inflows | Trending | |
| 1 | INDS : Pacer Industrial Real Estate | ANGL : VanEck Fallen Angel HY Bond |
| 2 | QYLD : Global X NASDAQ Covered Call | VIGI : Vanguard Intern Div Appr EFT |
| 3 | VSGX : Vanguard ESG Intern Stock | VIAAX : Vanguard Intern Div Appr |
| 4 | VWNDX : Vanguard Windsor | VSGX : Vanguard ESG Intern Stock |
| 5 | EFAX : State Street Fossil Fuel Rsrv Free | VWNFX : Vanguard Windsor II |
| 6 | VFWAX : Vanguard All-World ex US | FIHFX : Fidelity Freedom 2035 |
| 7 | FTIHX : Fidelity Tot Intern | VWNDX : Vanguard Windsor |
| 8 | VGWAX : Vanguard Global Wellington | NUSC : Nuveen ESG Small-Cap |
| 9 | VEU : Vanguard FTSE All-World ex US | EFAX : State Street Fossil Fuel Rsrv Free |
| 10 | FLPSX : Fidelity Low-Priced Stock |
Finally, there are the funds that may have reached a plateau or have started to decline. These are candidates for reducing allocations if no storyline exists for owning them. These categories contain bonds, gold, and funds intended to manage risk. A storyline for keeping these funds may be that it will be months before COVID related problems are overcome as well as valuations are very high. I have reduced exposure to gold and TAIL but will continue to own HSTRX and short-term treasuries.
Table #4: Funds That Are Peaking or Declining
| Peaking | Declining | |
| 1 | SUBFX : Carillon Reams Uncons Bond | FUMBX : Fidelity Short-Term Treas Bond |
| 2 | BAR : GraniteShares Gold Trust | AGZ : BlackRock iShares Agency Bond |
| 3 | IAU : BlackRock iShares Gold Trust | CPTNX : American Century Gov Bond |
| 4 | PHDG : Invesco S&P 500 Downside Hedge | SPTI : State Street Port Interm Term Treas |
| 5 | RPIEX : T Rowe Price Dyn Global Bond | TAIL : Cambria Tail Risk |
| 6 | HSTRX : Hussman Strtgc Total Return | |
| 7 | FSAGX : Fidelity Select Gold Port |
2. Trend Fundamentals
Key Point: Ten-month moving average, three-month trend, and fund flows can be combined to develop an automated system to identify funds in stages of trending.
Figure #1 is Fidelity’s concept of a typical business cycle divided into four stages. During these stages, different funds will over or underperform.
Figure #1: Typical Business Cycle
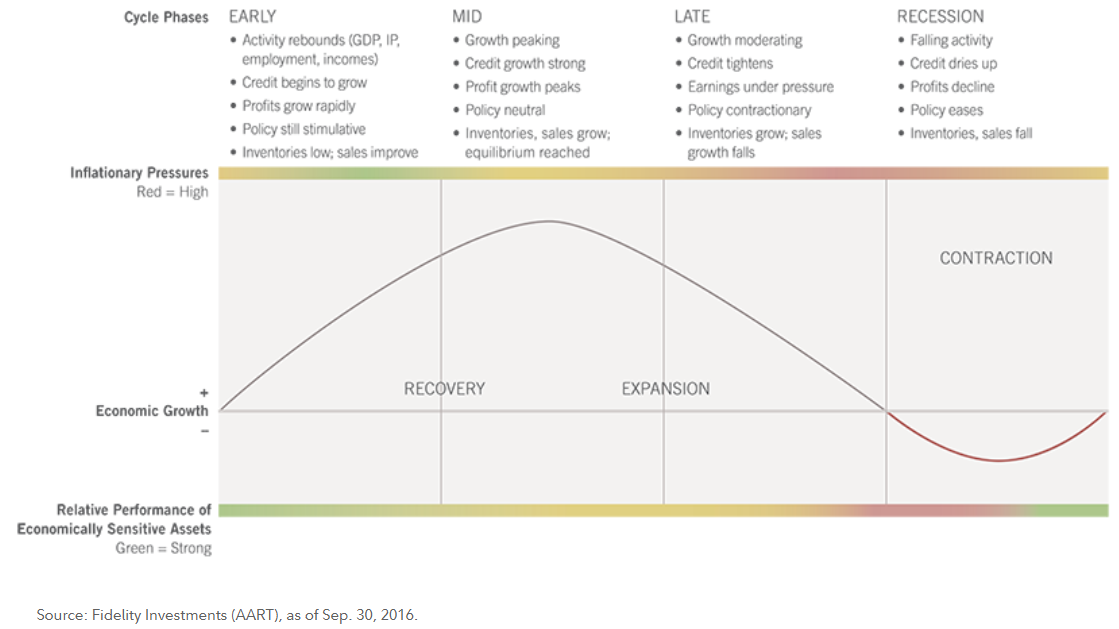
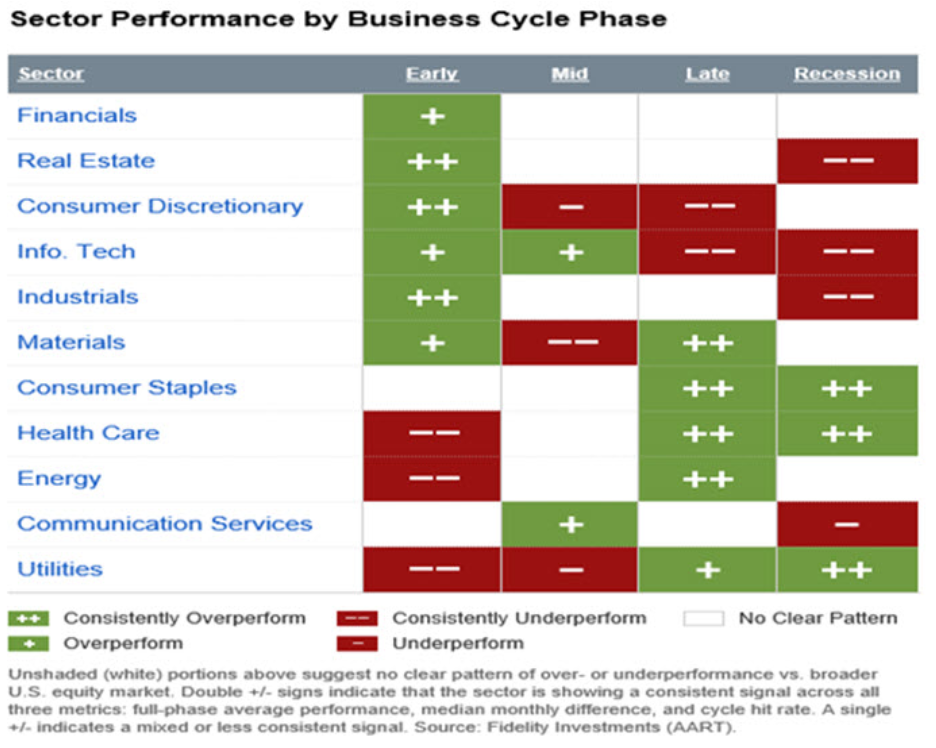
Figure #2 contains the sectors that do well by stage of the business cycle. The same concept came to be applied to Lipper Categories such as value and growth.
Figure #2: Sector Rotation by Business Cycle Stage
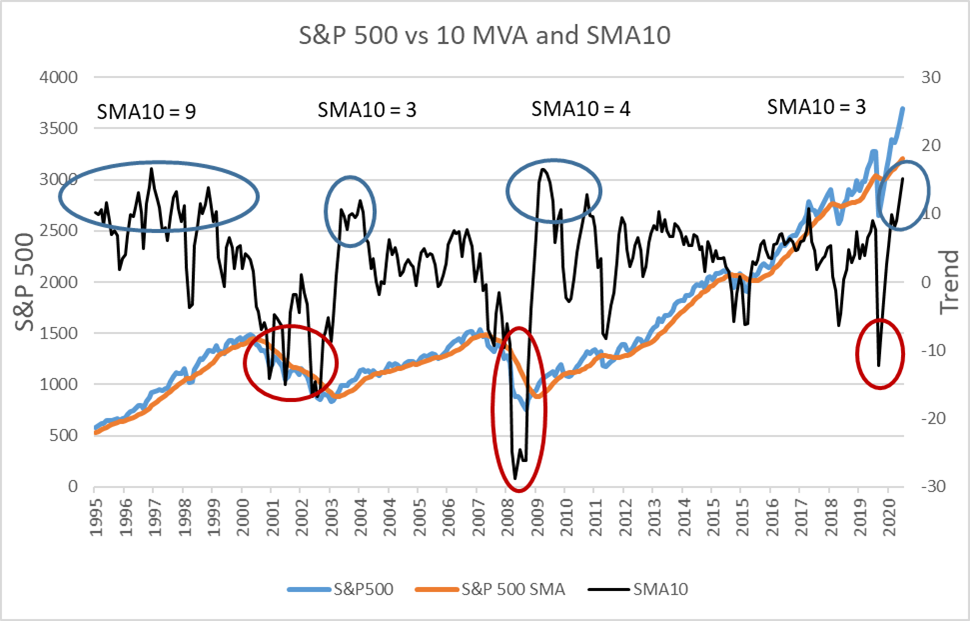
In Figure #3, I show the S&P 500 (blue line) and the ten-month moving average (orange line). The difference between the two is shown as the black line. SMA10 is the average difference over the time periods. During the Technology Bubble, the S&P 500 was 9 percentage points above the ten-month moving average. During normal cycles, the S&P 500 is only 3 to 5 percentage points above the ten-month moving average. The blue ellipsoids represent times when the funds have grown fast enough that a pullback may be likely and the red ellipsoids represent times when the funds represent buying opportunities. “The SMA10” represents the average for the period.
Figure #3: S&P 500 and Ten-Month Moving Average
In Figure #4, I show the three- and ten-month trends for the S&P 500. These are too noisy to use by themselves.
Figure #4: S&P 500 and Trends
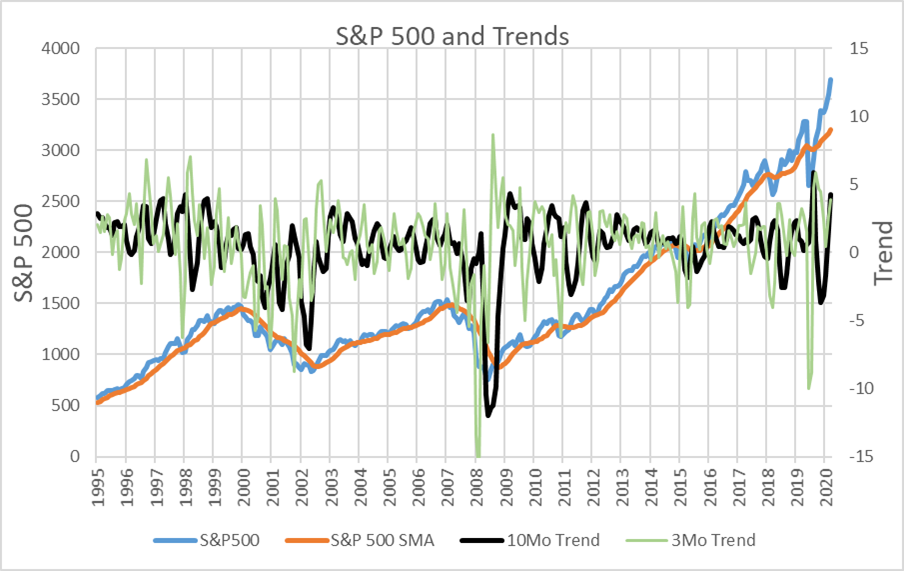
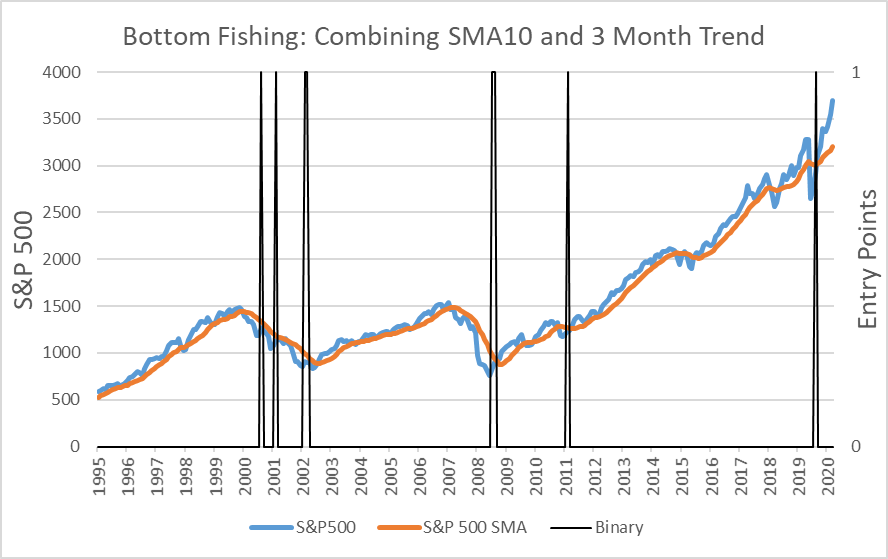
Figure #5 creates a line where the SMA10 is less than -2 and the three-month trend is greater than 2. This line is a reasonable representation of low points in the S&P 500 when it has started to recover.
Figure #5: Combing SMA10 and 3 Month Trends
A final step in identifying trending funds is to combine fund flows with the ten-month moving average and three-month trend.
3. Methodology
Key Point: Trending metrics from Mutual Fund Observer can be used to develop an automated system to identify funds with higher potential.
Each month I download nearly six hundred mutual funds and exchange traded funds available to small investors through Charles Schwab, Fidelity, and Vanguard representing over one hundred Lipper Categories. I rate these funds based on risk-adjusted returns, risk, momentum, quality, sentiment, yield, and consistency. Sentiment is based on Lipper Category performance during bull and bear markets which I have set as risk off due to COVID and high valuations. Momentum is based on three- and then-month trends, three-month moving average, three-month return, and fund flows. The following sections describe the metrics used to automate the trending stages.
Bottom Fishing
The three-month trend is 90% of the median, three-month return is greater than zero, fund flows are greater than zero and 75% of the median, and the price is below the ten-month moving average. This will result in identifying more than a dozen funds. The final selection is based on the distance below the ten-month moving average and my Ranking System.
Crossing
To identify funds crossing the ten-month moving average, the three-month trend is positive and greater than 50% of the median, three-month return is greater than zero, fund flows are greater than zero and 50% of the median, the relative ten-month moving average is greater than -2 and less than 2. The final selection is based on the three highest month trend and my Ranking System.
High Fund Flows
Funds with high inflows are identified when the three-month trend is greater than 50% of the median, fund flows are greater than 75% of the median, the relative ten-month moving average is less than the median. The final selection is based on my Ranking System.
Trending
Funds with established trends are selected when the Momentum Factor in my Ranking System is greater than 70% of the funds and the Fund Ranking is in the top 60% of funds. Fund Flows are higher than 80% of the funds. The distance below the ten-month moving average is less than 7. The final selection is limited by fund flows and ranked by my Ranking System.
Peaking and Declining
My calculations to identify funds that are peaking and declining are more complicated. Instead of simple comparisons to metrics, combinations of trend and fund flows are used. Generally, both the trends and flows are flat or negative.
4. Fund Trending Metrics
Key Point: Real estate, international, and value have favorable trends. Commodities and industrials are of interest if the recovery continues.
This section gets into the details of the funds. Trending metrics are shown. Real estate, financial services and commodities are still below the ten-month moving average but trends and funds are positive.
Table #5: Bottom Fishing Funds – Two Years

Funds that have recovered more and are near their ten-month moving average are value, international and industrial funds.
Table #6: Trending Funds Crossing the Ten-Month Moving Average – Two Years

Table #7 and #8 show funds that have recovered and are now growing at somewhat normal rates. They are again, real estate, international, and value funds. These are the funds that investors expect to do well but have probably not been overpriced.
Table #7: Trending Funds with High Inflows – Two Years

Table #8: Trending Funds – Two Years

Funds that may have peaked are gold and some of the more popular bond funds from 2020 as investors take on more risk.
Table #9: Peaking Funds – Two Years

Money is flowing out of bonds. The trends are relatively flat except for TAIL which is a defensive fund. I remain at the lower limit of Benjamin Graham’s 25 percent allocation to stocks because of COVID and high valuations.
Table #10: Declining Funds – Two Years

Closing
Globally, new COVID cases appear to be peaking, but lockdowns may stunt the recovery. The 2.5% drop in the S&P 500 is a warning of future volatility. Investors should understand their tolerance to risk. Articles describing the markets as overvalued are frequent now. Historically, December and January have good stock market performance while February tends to lag. In January, I continued to simplify my portfolio and reduce risk by shifting from European equity funds to global mixed-asset funds or cash.
Identifying trending funds is a relatively new addition to my ranking system. I built it to improve fund selection and reduce the time required to research funds. While I am not in the market for buying funds while I monitor global developments, trending funds identifies real estate, international, value, and commodity funds as potential investments.
 My Uncle Bob Warren celebrates his 100th birthday as the oldest living mayor of Frisco, Texas, and author of Frisco: Now and Then, on February 1st. Happy Birthday Uncle Bob. Here’s Uncle Bob with Beth, his best friend, and wife of seven years.
Best Wishes for a Safe and Prosperous 2021.