


I’m not sure that I can. If I were to offer any tip, it might be to avoid TIPS.
The Problem: Inflation, TIPS, and Investment Frustration
Some investors (me included) bought Treasury Inflation Protected Securities (TIPS) to protect against rising inflation. Inflation has been raging in 2021-2022. Are you frustrated that shorter dated TIPS have made no money, while anyone who bought longer TIPS lost a bundle? All bonds lost money this year but TIPS were supposed to make money. And they didn’t. This very frustrating outcome is counterintuitive. In this article I take a look at WTF happened to TIPS this year, and if there are any lessons from the unfavorable outcome this year, for future investment conclusions. Unfortunately, the topic is complicated and the author requests patience from the reader. (NB: All hyperlinks actively point to source data).
Why is it important to understand TIPS today?
The last era of sustained high inflation was from the late 1960s to the early 1980s. There were no investment products to directly protect investors from inflation in those days. TIPS were issued by the Department of Treasury starting in January 1997 as a mechanism to protect against inflation. For the first time, both TIPS and high inflation co-exist. If there is an investment to do in TIPS, we should figure it out.
TIPS as an Asset Class
TIPS are a big asset class, they directly benefit from rising inflation, carry the safe credit risk of the US Government, and the fees on some TIPS funds are very low. As of June 2022, there is $1.8 Trillion of TIPS outstanding. About $222 billion are invested in TIPS mutual funds and ETFs. Besides Social Security adjustment and Series I bonds, there are no financial instruments that directly offer inflation protection. Some investors may be able to purchase inflation linked infrastructure assets through private vehicles.
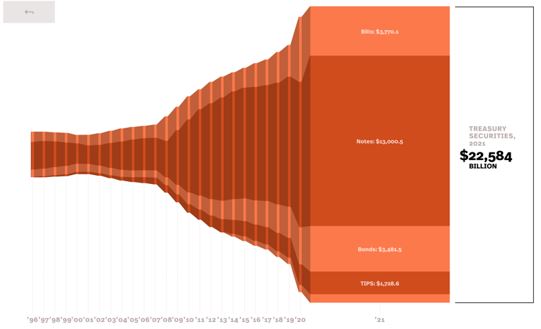
https://www.sifma.org/resources/research/fixed-income-chart/
By Morningstar’s calculation, there are 49 inflation-protected bond funds and 18 ETFs. Of those, 59 have lost money in 2022, six returned a small fraction of one percent and two are thriving. You might be forgiven for asking: “why is my inflation-protected bond fund not protecting me from inflation?” Excellent question, but you’ll have to be a bit patient as you work through the two factors – the structure of TIPS and the notion of “real yields” – that explain why they’re floundering. We’ll start with the basic notion of the “inflation” calculation that lies behind this all.
Inflation
Inflation, or higher prices in the economy on goods and services, is a curse on those who have thoughtfully saved cash today with the plan to consume the fruits of their labor in the future. We tolerate inflation not because we are blind to it, but because we are financial adults who don’t want to put on tin foil beanies. We understand a little greasing of debt through inflation keeps the system in place. We want TIPS in our portfolio to reduce this loss of purchasing power if little inflation becomes big inflation.
Consumer Price Index (CPI-U)
Some details from the Treasury on the index used for measuring inflation that goes into TIPS.
TIPS are securities whose principal is tied to the Consumer Price Index … based on the non-seasonally adjusted U.S. City Average All Items Consumer Price Index for All Urban Consumers (CPI-U) published by the Bureau of Labor Statistics of the U.S. Department of Labor…
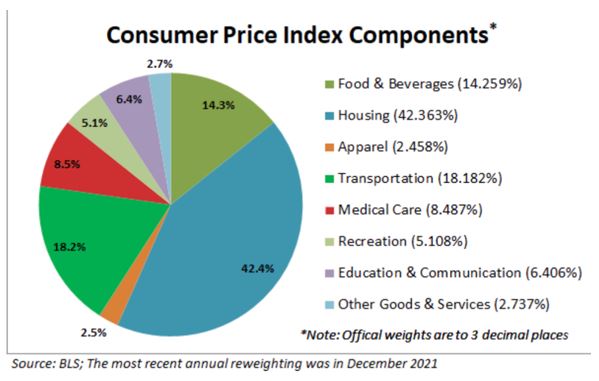
CPI Basket:
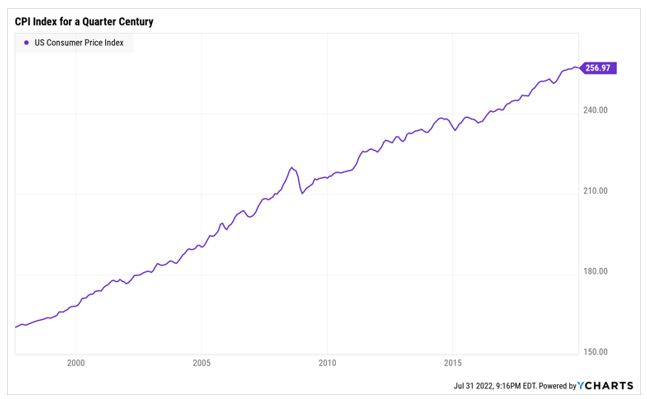
CPI-U for the last 25 years:
The December-December price changes in the CPI-U can provide the rate of inflation in a year:
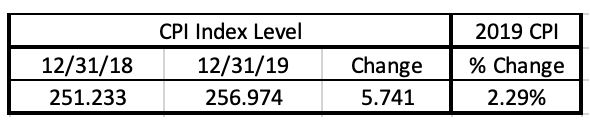
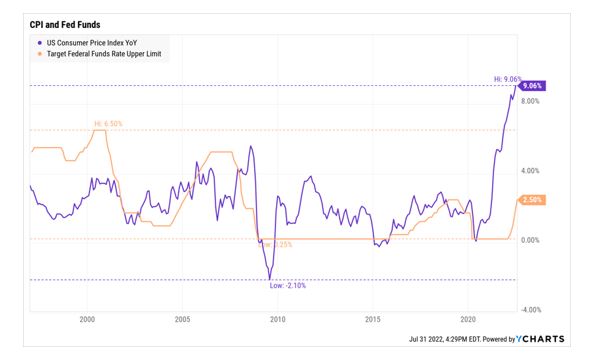
The steady inflation rate of around 2% for the last 10-20 years has shot up to 7.04% in 2021 and is expected to end in 2022 at around 8-9%. We can say that in 2 years, the value of a dollar would be 15% lower when compared to a basket of goods and services defined by the CPI above. Inflation is no joke. We all feel it. The Federal Reserve is committed to bringing inflation down to 2%.
Understanding TIPS by taking apart TIPS
For many of us, the intricacies of bond auctions are alien territory where they speak (sometimes quite quickly) a foreign language. To help ease you into understanding the limits of TIPS as an investment option, let’s look at the details of just one individual bond.
We’ll call her Lucille, as in Kenny Roger’s classic, “you’ve picked a fine time to leave me, Lucille.” Technically she’s CUSIP Number 912828ZZ6 but only the Committee on Uniform Security Identification Procedures cares. Here is Lucille’s bio:
Example: CUSIP Number 912828ZZ6
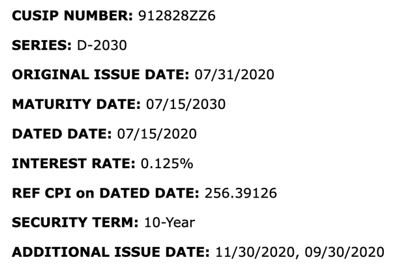
- Lucille is a 10-year maturity TIPS with an Original Issue Date of 31st July 2020 (2 years ago) and a Maturity Date of 7/15/2030. The Treasury reissued this exact bond twice more in 2020 to increase the supply of this TIPS.
- When TIPS are issued, like all bonds, there is a fixed coupon attached. The Interest rate (fixed coupon) on this bond was a paltry 0.125%, or almost zero.
- Reference CPI on Dated Date: Each TIP has a Reference CPI, which will stay with this bond until maturity. The Reference CPI is a lot like the daily value of a stock index. On July 31, 2022, the Dow Jones Industrials Index closed at 32,845.13. That same day, the Reference CPI number was 292.1931. The difference between the Reference CPI when a bond was issued and the current Reference CPI controls the bond’s yield.
- This Base is the CPI-U lagged by 3 months. So you don’t get the value current on the day the bond was issued, you get whatever the value was three months earlier. So …
- This TIP was issued in July 2020 & the reference CPI (256.39126 ) is from April 2020.
- The Treasury calculates a Reference CPI every day lagged by 3 months to create an Index Ratio. That’s just today’s Reference CPI divided by the Reference CPI on the date the bond was issued.
The Treasury Department maintains a webpage with the Issue details and Index Ratios for every single TIP issued. Here are the Index Ratios for Lucille for every single day since the bond was issued. I’ve zoomed into the file to look at the July 31, 2022 Reference CPI.
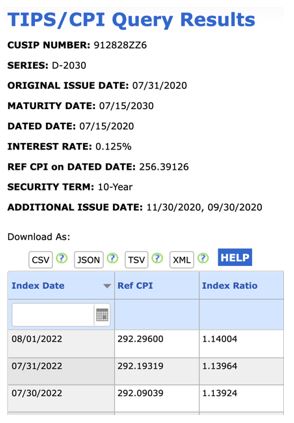
- For 7/31/2022, the Ref. CPI is 292.1931
- The Index Ratio = Today/Dated Date = 292.19319/256.39126 = 1.13964
The Index Ratio tells you how much your bond is worth today. Your principal grows directly with the Index Ratio. For example, if a $1000 TIPS matured with Index Ratio = 2, the TIPS holder would receive twice the face value of $1000, or $2000. The fixed interest (the paltry 0.125% in this case) is paid on the Accrued Principal. As the principal grows, the fixed interest payment also grows.
Here’s the good news on the Lucille front: principal Accrual now stands at 114% since it was issued 2-years ago. Important: Investors have made 14% in this bond because of rising inflation. Since the recent CPI prints have been high, Principal Accrued will pick up the pace, though subject to the three-month lag we talked about.
The subtle thing to understand with TIPS is that the cash flow accumulates in the principal and is not paid out in interest income each year. Your 14% gain is purely hypothetical right now, you won’t see it until you redeem the bond.
Bad news on the Lucille front, then: your $1000 investment is churning out $1.75 for you.
Worse news on the same front, the IRS however wants their money now. Unburdened by reality, the Internal Revenue Service treatment of interest income assumes that the cash was received this year (even though it was not). The IRS treats this Principal Accrued as taxable interest income, making life hard for TIPS owners.
The only actual cash interest that TIPS pay semi-annually is based on the Interest Rate, 0.125%, which is paid on the Accrued Principal. The IRS counts this as taxable interest as well.
TIPS design is complex, pushing individuals to hold TIPS through Mutual Funds and ETFs. TIPS funds collect the fixed coupon interest and monetize the Principal Accrual embedded interest by selling some TIPS from the portfolio.
From the prospectus of Vanguard Short-Term Inflation Protected Securities ETF (VTIP)
…a fund holding these securities distributes both interest income and the income attributable to principal adjustments each quarter in the form of cash or reinvested shares (which, like principal adjustments, are taxable to shareholders). It may be necessary for the fund to liquidate portfolio positions, including when it is not advantageous to do so, in order to make required distributions.
Quick recap: you face no credit risk but your bond payout is measly, lags inflation, and is getting overtaxed by the IRS. I don’t want to worry you, but it sort of gets worse from here as we start trying to understand Lucille’s “real” yield.
REAL Assets have REAL Yields: The Market Price of a bond is based on discounting the Cash flows promised in the bond to the current interest rate. This discounting rate is called YIELD. In the case of TIPS, this yield is called REAL YIELD.
Price, Coupon, and Yield form a mathematical relationship. Given any two, the third can be calculated. The reference to REAL is part of the language of finance and economics where anything adjusted for inflation is called REAL and anything left unadjusted is called NOMINAL.
Auction details of our above-mentioned TIPS 10-yr Bond.
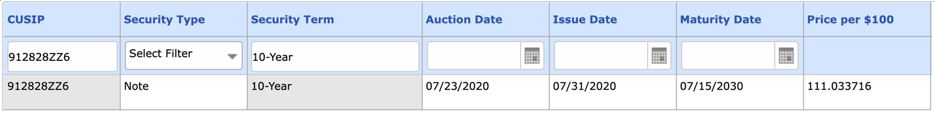
We knew the Interest Rate (coupon) was 0.125%. For the Face Value Price of $100, the Issue price was ~$111. Using price and coupon, we calculate the Real Yield. It was -0.9% at auction time. Investors were willing to receive the CPI minus 0.9%, from the US Government for the next 10 years at auction time. They did so by paying $111 for a $100 10-yr TIPS bond.
In 2020, trillions of Dollars, Euros, Pounds, and Yen of Government Bonds were issued with Negative Yields to savers clamoring for safe government bond assets in the aftermath of the Covid-19 crash and lockdowns. We can eyeball the Real Bond Yield on the 10-yr TIPS on this chart. The inflation created through the money printing which followed has since changed the interest rate landscape.
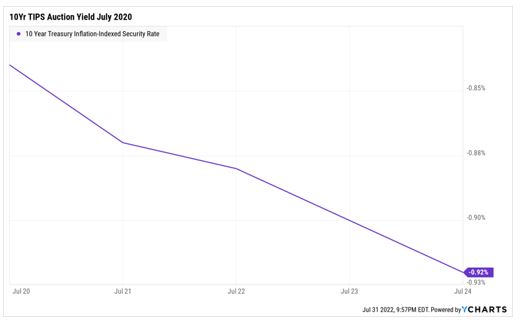
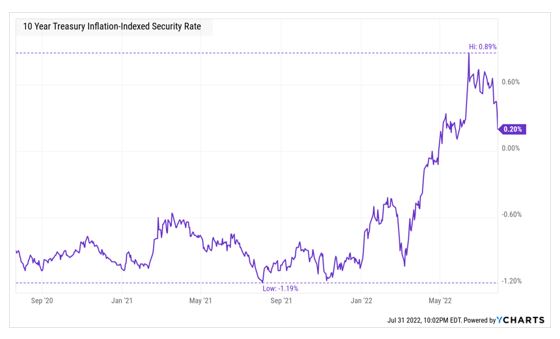
From a low of -1.2% in August 2021, TIPS yields rose to +0.89% in June 2022. Currently, the 10-year TIPS yield is +0.20%. This increase in Yields lowers the price of TIPS bonds.
Chart of 10-Year TIPS Real Yields over last 2 years:
Bonds, Yields, and Duration Risk
Duration Risk says that the longer a bond’s maturity date, the more sensitive the bond is to changes in market yields. Yields go up, Bond prices go down. Duration can roughly estimate the price change from changes in yield. When the yield is close to zero or negative, the Duration is high. A small change in yields causes a big change in price. A 10-year TIPS bond also had a duration of about 10 years. According to the WSJ TIPS Bond page, the Real Yield on the bond as of this Friday, July 31st, 2022, is +0.06%

At Issue, our TIPS Real Yield was ~ -0.9%
End of July, TIPS Real Yield ~ +0.06%
Yield Change = Increase of 0.96%
Duration ~ 10 years
Rough approximation for change in Bond Price ~ .96% * 10 ~ $10
The TIPS Bond is priced at $100.13, about $11 lower, than the Issue price.
This is in line with our $10 loss on the bond from Duration and yield change.
Important: Price drop from TIPS bond REAL Yield increase: -11%
Recall: Price Accrued from CPI increase: +13.9%
Total Return on our TIPS bond over 2 years: +2.9%
That’s a whole lot of work for not much return. Investors who purchased a 10-year TIPS bond two years ago were correct in their assessment of higher inflation but incorrect in the price they paid for this bond!! The Negative Real yield at Issuance and the change in yield since then have been problematic.
So far, we have understood how TIPS track CPI, and what happened to a 10-year TIPS bond over the last two years since issuance. At least, we understand WHY TIPS have tracked CPI but not generated total returns in line with CPI.
What about the future? Are yields high enough now? And are TIPS likely to deliver in the future?
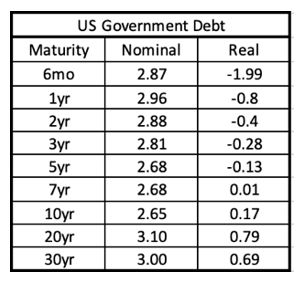
TIPS Real Yields as of 7.31.2022: From the WSJ, I have created a table of TIPS maturities from 6 months to 30 years and the corresponding real yields.
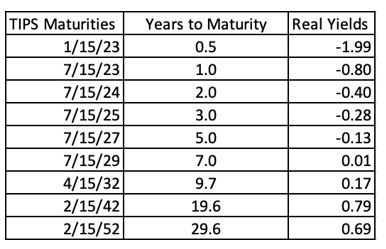
It shows that TIPS under 7 years of maturity still have Negative Real Yields. Longer-dated TIPS now have positive yields. We need to take a look at historic real yields to get some idea of how high yields can go. We don’t want to repeat the mistakes of the past. We don’t want to be right on CPI and wrong on Yields.
Long-Term Chart of Real Yields: Here is a chart of TIPS real yields for the last 2 decades.
TIPS are only issued in 5, 10, and 30-year maturities and I could not find a shorter dated (2-year maturity) TIPS real yield.
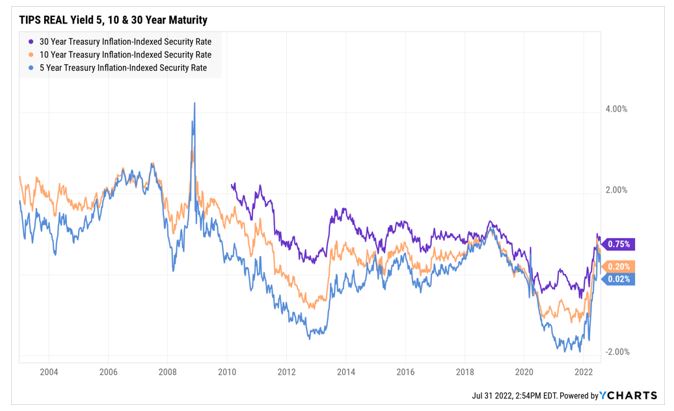
We can observe that yields have bounced from negative to positive. The 5 and 10-year TIPS Real Yields are slightly above zero, and the 30-year TIPS is 0.75% positive. What would make the Yield go higher?
Well, of course, inflation. The higher and stickier inflation is, the more the Federal Reserve is likely to keep raising the Fed Funds Target Rate. The higher the Fed Fund rate, the higher the yields will be on both Nominal Bonds and TIPS. It would not be a crazy assumption to think that Real Yields could go up 1% across the board. The 5 and 10-year TIPS Real Yields could be 1% and the 30-year could be closer to 1.5-1.75% if the Federal Reserve kept raising interest rates. This could hurt TIPS Bond prices again.
Chart of Fed Funds Target Rate and the CPI
The Future may look like the Past: Making TIPS Not Yet Attractive
We may be caught in a doom loop where an investment in TIPS continues to be the only one that directly benefits from increasing inflation. And that same inflation will lead to Federal Reserve tightening aggressively. Real yields (and all yields) will trade higher and hurt the bond prices from duration risk. Any joy from CPI increases might be taken away from future bond yield increases!! What a bummer. Unfortunately, we are at the point in the road where we realize investing in bonds is never that easy.
What would still make it interesting to invest in TIPS?
The scenarios would be:
- If Inflation kept going up, but if the Fed did not raise rates because the economy was collapsing. Real Yields might stay where they are. Stagflation would help TIPS. {I think Fed will sacrifice the economy to rein in inflation}
- Real Yield went up, but the CPI rose even faster. Whatever one lost in Bond Price, one more than made in Principal Accrued. {This could only work in short-dated TIPS where bond duration is low, and I think this is the best case for TIPS investing here}
- A version of Scenario 2 in which CPI stays high for a decade, Fed raises Rates, and Real Yields go up to 1.5-2% but peak there. {For the patient investor the increase in CPI from Principal actual can eventually overpower the drop in bond price from Yield increases}
- If an investor decided to buy a 30-year TIPS because CPI + 0.75% or a 10-year TIP at CPI + 0.2% was good enough for their money, and they would hold the bond to maturity. {If CPI came in at 3 or higher, this would be a decent outcome. It’s important to hold to maturity and not look at the bond price in between.}
Conclusion
When I started writing this article, I was convinced the answer was to invest in TIPS. It might still work but there isn’t enough room for error. Real Yields are still negative (less than 5 years maturities) or barely positive (from 5-10 years maturity). The Federal Reserve is likely to raise rates further. This will not help Bond Yields, whether in Nominal Treasuries or TIPS Bonds.
Short-term TIPS buyers (2-3-year maturities) need CPI of about 3.5 – 4% to overcome the Negative Real Yields and earn 3-3.5% per year in Total Returns. Long-term TIPS buyers (10-30 years) need to buy and hold to maturity to overcome the Duration risk from rising Real Yields.
In both cases, it seems better to pass on TIPS now, wait for Real Yields to create a margin for error, and then enter the investment.
It is true that TIPS are supposed to be the best tool for dealing with inflation. Unfortunately, the investment recommendation is not as obvious.
To the reader: If you are a bond fund manager, discretionary investor, or macro analyst, I would love to see what scenario you think makes it worthwhile to be invested in TIPS. My email is [email protected] You can also contact me for any source data you need more details on or if you disagree with the analysis.
Further Deliberations for bonds: Breakeven Inflation Rates
Comparing an asset against its own history and possible outcomes is one way to investigate investment fitness. Sometimes, one compares against the Opportunity Cost. Bond market investors compare TIPS to Nominal Treasuries to decide which is better.
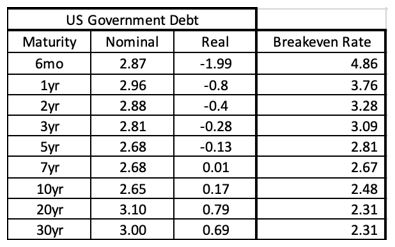
Table of similar maturities Yields of US Government Debt for both Nominal Bonds and TIPS:
Computing TIPS/Treasury Breakeven Inflation Rate: Both TIPS and Nominals trade in their independent bond market but when they are looked at side-by-side, they can be helpful in divining the expected annual CPI projected in the bond market for a given time period. This is called the Breakeven Inflation Rate. For E.g., currently:
10-Year Treasury Nominal Yield = 2.65%
10-Year TIPS Real Yield = 0.17%
10-Year TIPS/Treasury Breakeven Rate = Nominal – Real = 2.65% – 0.17% = 2.48%
Total Return from Nominal Treasuries would equal the Total Return from TIPS when the next 10-year average annual CPI = 2.48%. Investors must believe CPI over the next 10 years will be higher than 2.48% on average to own TIPS. We can expand the above table and calculate the Breakeven Inflation Rate for the next 30 years of bond maturities.
This tells us that CPI is expected to be high over the next few years but as time goes by, investors expect the US economy will experience CPI more or less consistent with the 2% history. Each investor needs to calculate what they think the CPI will be.
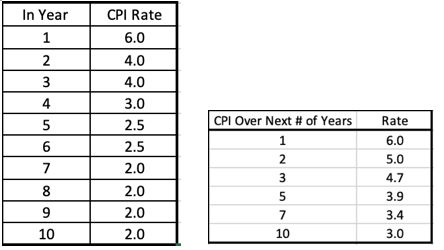
Let’s create a hypothetical path for CPI where inflation stays sticky for a few years:
And a hypothetical path where inflation comes faster under control:
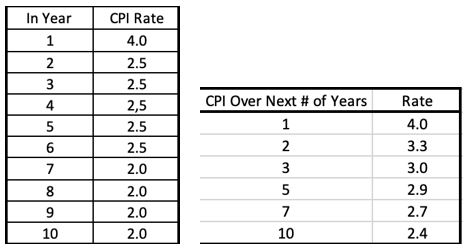
Comparing the two hypothetical paths and the average CPI over a given number of years to the Breakeven Rate tells you how important it is for CPI to be high and sticky in the first few years for the TIPS investment to pay off compared to Treasuries. In a world where CPI slides down to 4% and tapers down to 2.5% in future years before tailing off at 2% leaves you with equal Total Returns between Treasuries and TIPS. In all likelihood, the Bond Market has the prediction for the 2nd hypothetical path for the US economy. It’s not a crazy path. TIPS still offer a call Option to inflation, but that’s about it.
Next, we look at Fund flows to determine where Investors are positioned in TIPS.
TIPS Mutual Fund/ETF Flows:
TIPS funds can be thought of as broken down into 3 maturity buckets: short, medium-term, and longer-dated. Most funds have a portfolio of TIPS with varying maturities.
The iShares TIPS Bond ETF (TIP)
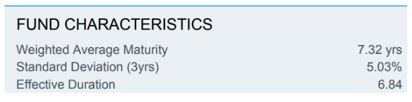
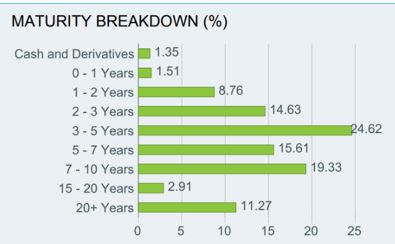
We can use the Effective Duration of the Bond Portfolios for the three time-bucketed categories.

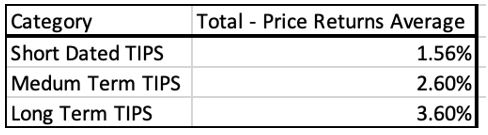
Short Dated TIPS: The average fund’s Total Return YTD is slightly below zero. It’s attracted about $9.5 billion in Assets this year and the current AUM of short-dated TIPS funds is about $62 billion. In the last 1-month, people have been exiting shorter TIPS.
Medium Term TIPS: The average fund’s Total Return YTD is 5% and the price return is -7%. It’s lost about $7.5 billion in Assets this year (probably because this group of funds is losing money) but it still has a current AUM of $159 billion. In the last 1-month, people have been adding into medium TIPS, probably attracted by recently no longer negative real yields.
Long Dated TIPS: The average fund’s Total Return YTD is a devastating 21.7% and the price return is -25.3%. This is a small category with only $ 1 billion in AUM and has lost $400 million in assets this year. Not many want to touch this area.
Given that the Total TIPS issuance by the Treasury is $1.8 Trillion and the fund holds about $220 Billion, it’s a rough 12% of the market share. Insurance and pension companies must hold a lot of TIPS as buy and hold to meet long-dated obligations.
Differences between Total Returns and Price Returns in TIPS and what it means for investors
Since funds pay all dividends to investors, sooner or later, all CPI-linked Principal Accruals and Interest earned should make its way to the shareholders. A quick look at the difference between Total Returns and Price Returns from the 3 categories above makes me wonder what’s going on? YTD, the Dividend Yield paid out, or Total – Price Returns seem low compared to the CPI accumulated thus far this year (5.7% in 2022). And why the difference between funds of different maturities?
As investors, if we are going to use TIPS to be invested in the Asset class, we are hoping to get the Cash flow from the CPI-led Principal accrual. I am sure it will come, but funds could do more to deliver it.
Comparing Historical CPI with Historical Dividend Yields (Total – Price Returns)
I have chosen 3 Representative TIPS ETF and Mutual Funds. I have highlighted the CPI accumulated each year for 2020, 2021, and YTD 2022. I have also highlighted the difference in Total less Price Returns for each year for these funds. The hope is that the CPI should over time match the Dividends paid. The relationship has broken down after 2020.
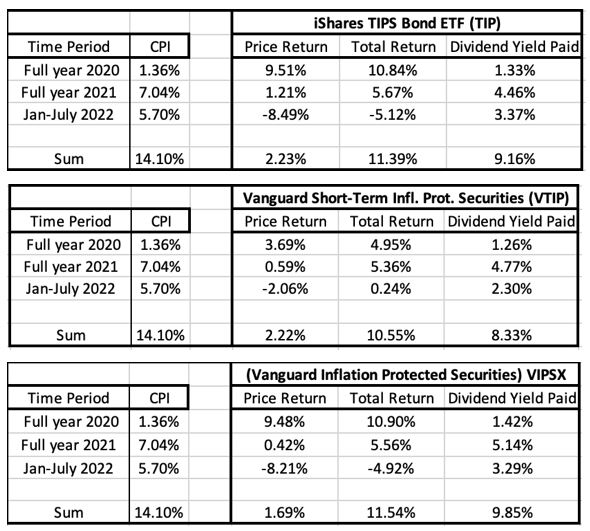
Is there a reason why 2021 CPI and Dividends should have differed this much, and it doesn’t look like they’ve caught up in 2022 either? Looking at the VTIP prospectus, here is the dividend schedule:
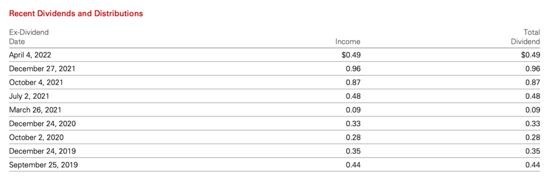
It seems that the dividends are loaded in the last quarter of the year. Suppose that’s right for 2022. That should mean that investors holding TIPS funds should expect a decent distribution at some point later this year to make up for not just the high CPI this year but also the gap from last year. Arguably, there is a 3-month lag for Index Ratios so patience would help.
From a fund investor’s perspective, the TIPS asset class is less easy than I had expected it to be. It’s not just that the returns are problematic – that one can say is due to Real Yields going higher. The deficit in dividends compared to CPI is a problem. I’d like to understand why the gap exists.
Ultimately, higher Real Yields and a good Fund distribution mechanism should be the way to play TIPS. When the ducks line up, I’ll be there.