


Source: PublicDomainPictures.net
A reader on the Mutual Fund Observer Discussion Board asked “how do you feel about putting monies into funds that have a somewhat ‘black box’ dynamic to them…yes, they explain their positions but sometimes I wonder, how safe of an investment are some of these funds?”
For those not familiar with black box investing, Investopedia explains: “a black box is a device, system, or object which produces useful information without revealing any information about its internal workings. The explanations for its conclusions remain opaque or ‘black.’ Financial analysts, hedge fund managers, and investors may use software that is based on a black-box model in order to transform data into a useful investment strategy.”
Useful but not magical
By nature, then, these tend to be computer-driven quant funds that might move between asset classes, or between long and short positions within asset classes, based on triggers in the model but unknown to mere mortals. The first well-known Black Box Models was the Black-Scholes-Merton Model, it was developed by Fischer Black, Myron Scholes, and Robert C. Merton in the late 1960s. Good news: the trio shared a Nobel Prize in 1997 for the work that underlies the model. Fans will recognize the BSM model for European options pricing:
![]()
Bad news: The early application of this model incurred financial losses due to a lack of risk management. These models can make money or reduce risk in certain environments, but may fail miserably in other environments.
In his Weekly Commentary on Seeking Alpha, Doug Noland describes a current example of Black Box risk which occurred this past week. Some pension funds in the U.K. have employed a strategy using liability-driven investing that attempts to reduce volatility without lowering returns. However, as interest rates rose, these pension funds experienced losses and margin calls, and were forced to sell assets to raise cash. Volatility was high during the week. The Bank of England stepped into to support the bond market.
I have invested in several “Black Box” funds which currently make up approximately 10% of my financial assets. The reason that I chose to place money in black boxes is because in this environment of high inflation and valuations, rising rates, and falling bond prices, some Black Box funds have demonstrated that they can reduce risk and have outperformed stocks and bonds. Diversification across funds and categories is essential to keeping risks low.
This article is divided into the following sections so readers can skip to the sections of interest:
Black Box Fund Lipper Category Definitions
Black Box Fund Performance – 5 Years
Black Box Fund Current Performance – Top 30 Funds
Alternative funds have become more popular recently, and are more available to individual investors. The five-year time period includes most alternative funds in the Lipper Database. The Current Performance is based on thirty of the best performing alternative funds that are available to individual investors.
Base Case for 2023
My base case is that the U.S. economy will enter a recession during 2023. Opinions about the severity of a possible recession vary. As an explanation, let’s start with the deep inversion of the yield curve as shown in Figure #1. Bond investors believe that a recession is likely in the next year or two. Banks make money in large part by borrowing short term funds at a lower rate and lending them out longer term at higher rates. Since the beginning of the year, rates have risen dramatically raising the cost of borrowing to consumers and businesses. Yun Li reported in a CNBC article, “The Fed Forecasts Hiking Rates As High As 4.6% Before Ending Inflation Fight” that the median forecast for the Fed Funds rate is 4.4% by the end of 2022 which will require two more 75-basis-point rate hikes.
Figure #1: Yield Curve
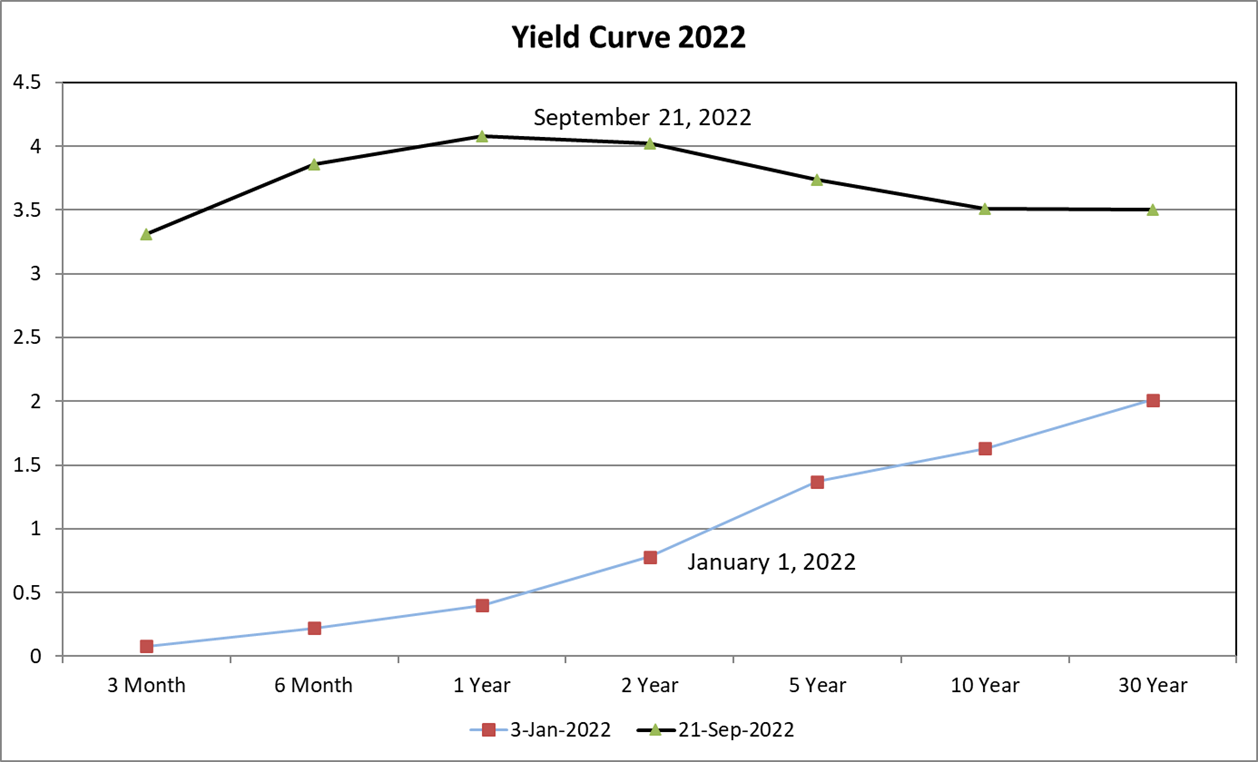
Source: Created by the Author Using the St. Louis Federal Reserve FRED Database
Lance Roberts of Real Investment Advice had an article published on Seeking Alpha titled “Debt and Why the Fed Is Trapped” where he points out that “massive” debt levels pose a significant risk and challenge to the Federal Reserve. He quotes Federal Reserve Chairman Jerome Powell below and highlights the importance on future growth:
It is very important that inflation expectations remain anchored. What we hope to achieve is a period of growth below trend. (Lance Roberts, “Debt And Why The Fed Is Trapped”, Seeking Alpha, September 23, 2022)
Growth below trend may imply a “soft” landing, but also implies below trend stock returns. A timely article by Charles Rotblut at the American Association of Individual Investors entitled, “It’s Been Difficult for the Fed to Pull Off Economic Soft Landings”, reminds us of how difficult it is to manage a soft landing after raising rates:
Most prior rate-hike cycles have been followed by recessions, so-called hard landings… Only one of the 11 previous rate-tightening cycles has resulted in what [former Federal Reserve vice chairman Alan] Blinder described as a “perfect soft landing.” (Charles Rotblut, “It’s Been Difficult for the Fed to Pull Off Economic Soft Landings”, American Association of Individual Investors, September 2022)
Liz Ann Sonders and Kevin Gordon at Charles Schwab wrote “Earnings: Trampled Under Foot?” where they express concerns about earnings growth:
We believe the weakness in expected earnings growth is early in its trip to an ultimate negative (year-over-year decline) destination. Last week’s FedEx news of an expected earnings implosion and the company’s removal of all forward-looking guidance is a likely canary. (Liz Ann Sonders and Kevin Gordon, “Earnings: Trampled Under Foot?”, Charles Schwab, September 19, 2022)
Are we headed for a recession next year? Azhar Igbar and Nicole Cervi with Wells Fargo answer that question in “Gonna Change My Way of Thinking: Is Recession Coming?”. They believe that a recession is likely to start in the first quarter of next year:
Using 50% as a threshold, our preferred Probit approach has never produced a false signal and has predicted all recessions since 1980. The 50% line was breached in Q2-2022, jumping to a 57% probability from 28% the prior quarter. Through August, the Q3 probability is 48%…
Given the historical accuracy of this Probit approach, a recession in the next year is more likely than not, in our view.
…Our forecast calls for a recession starting in Q1-2023 with three consecutive quarters of negative real GDP growth and output growth turning positive in Q4-2023. (Azhar Igbar and Nicole Cervi, “Gonna Change My Way of Thinking: Is Recession Coming?”, Wells Fargo, September 23, 2022)
The S&P 500 fell 9.9% for the past month at the time that I wrote this article. During this time, the Alternative Managed Futures funds covered in this article averaged a positive return of 4.9%. Multi-Strategy, Event Driven, and Global Macro Trading funds lost about one percent, or one-tenth of the loss of the S&P 500. Of the funds that I track, Intermediate Government Bonds lost 3.8%, Utilities lost 3.5%, Health funds lost 5.0%, and Consumer Defensive funds lost 9.0%.
How does one prepare for a recession when interest rates are rising and bond prices falling? Here is the approach that I have taken over the past year and as I approached retirement:
- Consulted with a financial advisor.
- Set up pensions to cover living expenses.
- Reduced expenses.
- Maintained a Safety Bucket of several years of expenses in ultra-safe funds.
- Set up Buckets based on tax characteristics and timing of withdrawals.
- Reduced allocations to stocks to just under 40%.
- Built ladders of short-term treasury bonds and certificates of deposits.
- Allocated approximately 10% to alternative funds in Conservative, Tax-Advantaged Buckets.
- Added modest amounts of Utility, Infrastructure, Health Care, and Consumer staple funds.
Black Box Fund Lipper Category Definitions
We’re going to look at funds that fall into six distinct Lipper categories. They are Event-Driven, Global Macro, Long/Short Equity, Multi-Strategy, Managed Futures, and Mixed Assets / Flexible. Folks interested in a bit more precision about what characteristics each box represents should check the Lipper Global Classifications Category Definitions (2019) document. When you click on that link, you’ll be prompted to download a .pdf file. These categories are mostly on pages 25 – 27.
For Flexible Portfolio funds, I selected funds with “Multi-Asset” in the name.
Black Box Fund Performance – 5 Years
Over the past five years, there has been an increase in the number of alternative funds and assets under management. One might infer from Figure #2, that over the past five-years, Alternative Managed Futures, Long / Short Equity, and Multi-Strategy Funds have been riskier than the S&P 500.
Figure #2: Return vs Risk (Ulcer Index) – Five Years
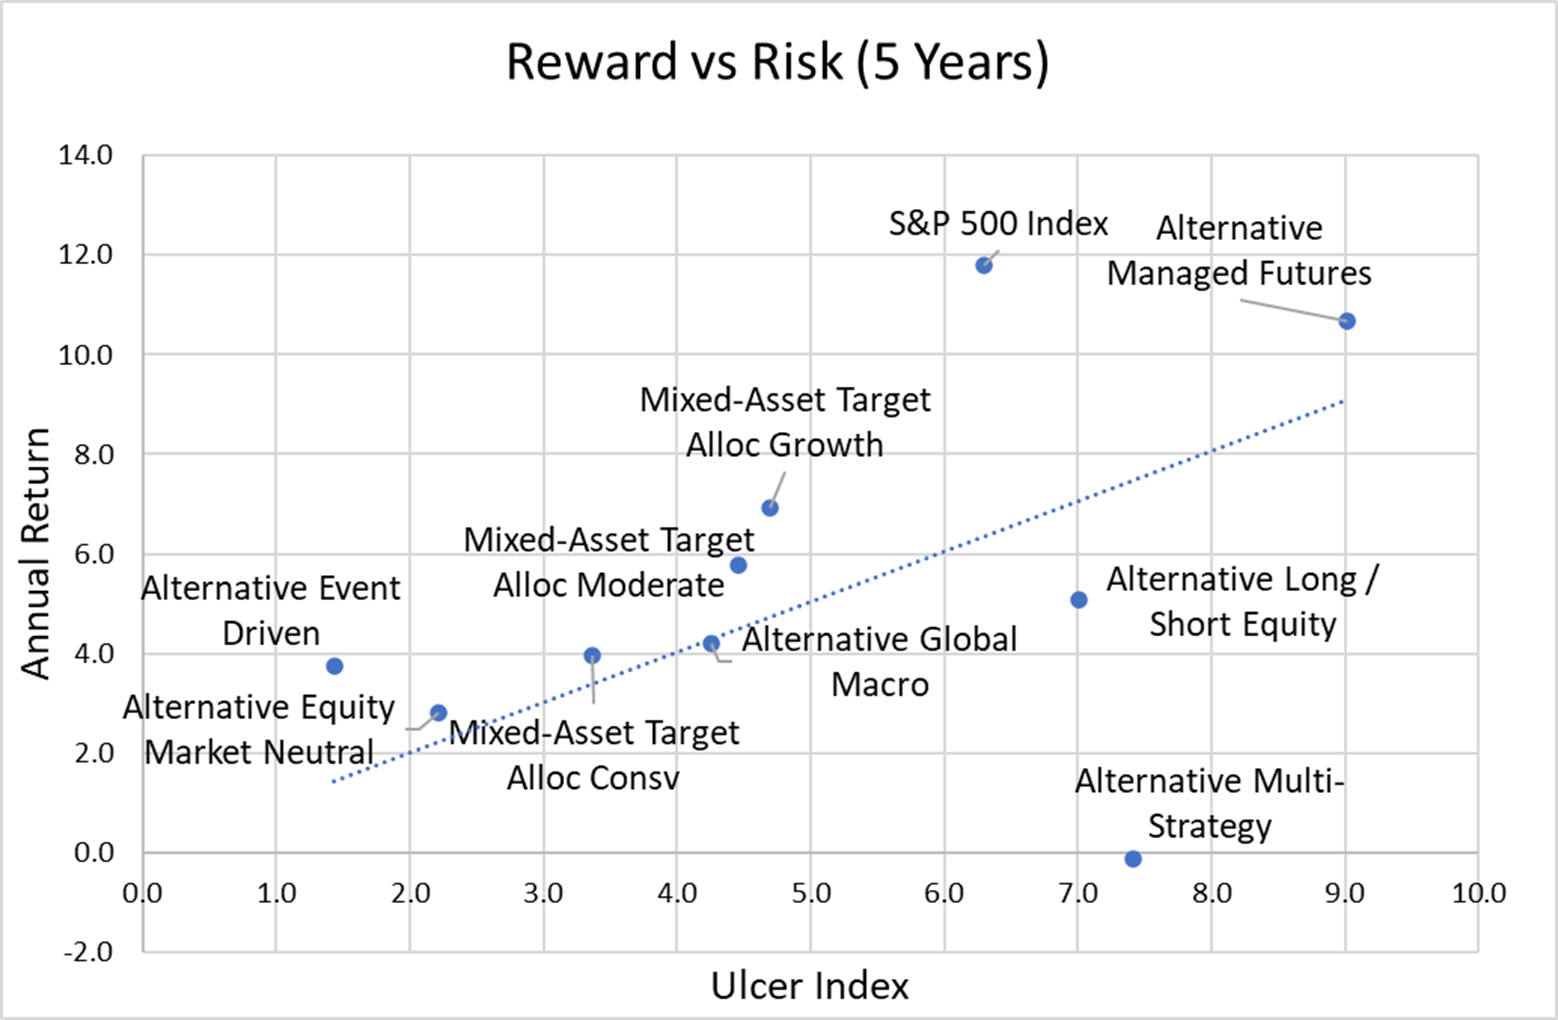
Source: Created by the Author Using the MFO Premium fund screener
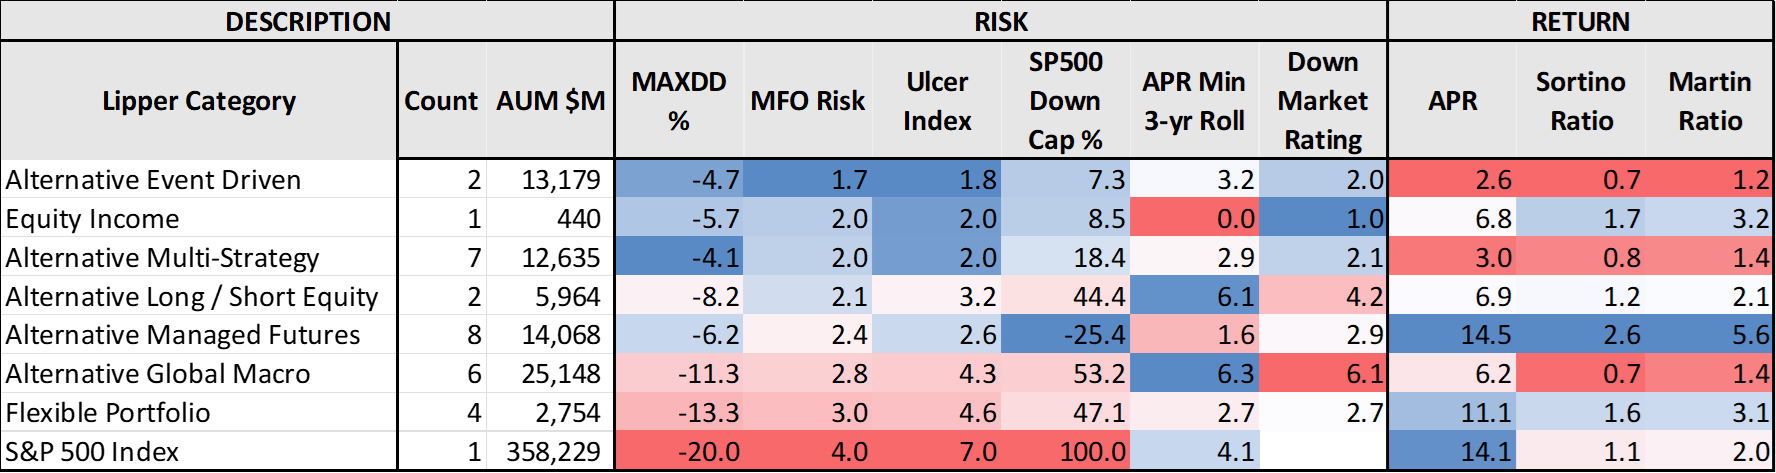
Table #1 shows that by several measures, Alternative Even Driven, Equity Market Neutral, Multi-Strategy, and Global Macro along with Conservative Mixed-Asset have been the least risky in terms of drawdown. Blue shading indicates lower risk and higher returns and red shading indicates higher risk and lower returns. The best funds to own in a bear market continue to be Conservative Mixed Asset Funds, and Alternative Event Driven, Multi-Strategy, and Market Neutral funds.
Table #1: Risk and Reward – Five Years
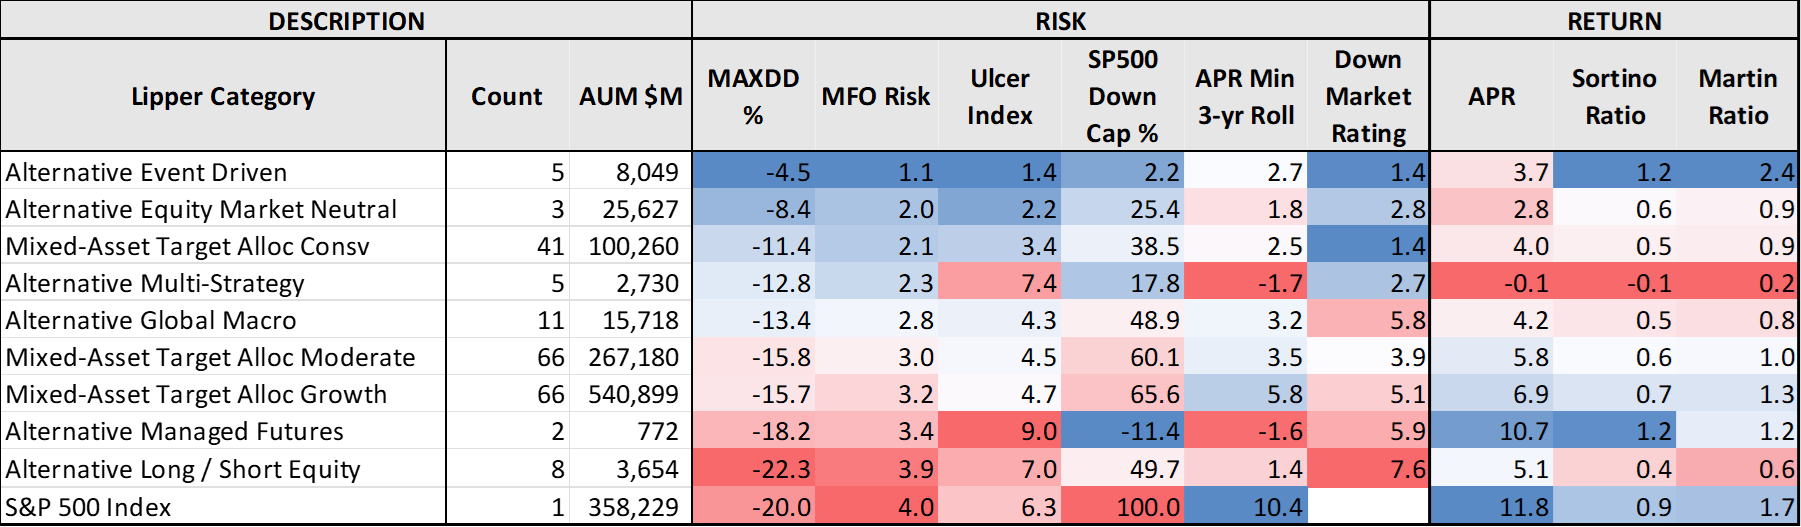
Source: Created by the Author Using the MFO Premium fund screener
Note: Blue shading indicates lower risk and higher returns and red shading indicates higher risk and lower returns.
Black Box Fund Current Performance
I began the research for this article by looking at Alternative Funds available at Fidelity with no transaction fees, expense ratios less than 2%, assets under management of at least $100 million, and required minimum investments of less than $25,000.
As shown in Figure #3, over the past two and half years, Alternative Managed Futures have had high returns and lower risk as measured by the Ulcer Index. Equity Income includes only one fund, the Core Alternative Fund (CCOR).
Figure #3: Return vs Risk (Ulcer Index) – 2.5 Years
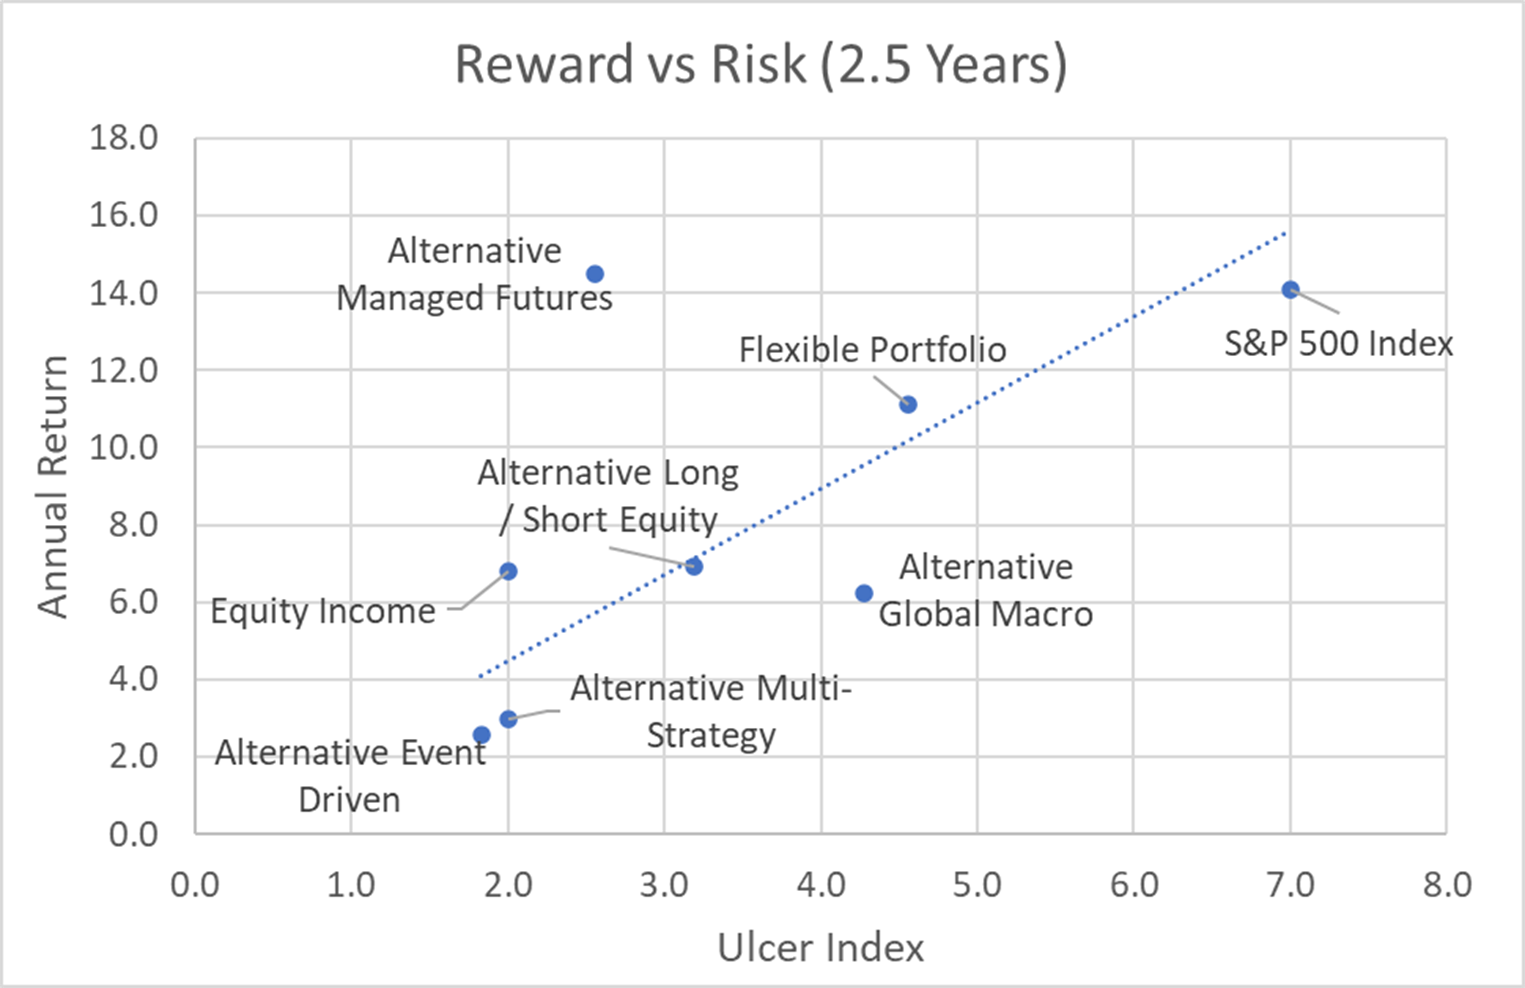
Source: Created by the Author Using the MFO Premium fund screener
One can see in Table #2 that the alternative funds have lower risk than the S&P 500 over the past two and a half years. Alternative Managed Futures and Flexible Portfolio funds have had high returns.
Table #2: Risk and Reward – 2.5 Years
Source: Created by the Author Using the MFO Premium fund screener
Note: Blue shading indicates lower risk and higher returns and red shading indicates higher risk and lower returns.
Table #3 contains the thirty funds used in the analysis for the past two and a half years, sorted by the Martin Ratio which is the risk adjusted return. It is calculated as the average annual return divided by the Ulcer Index. The top section represents the funds with the highest risk adjusted returns (Martin Ratio) and consists mostly of Alternative Managed Futures Funds. The bottom section represents the funds with the lowest risk adjusted returns and consists mostly of Alternative Global Macro Funds. This may be related to the Russian invasion of Ukraine. The middle section consists of a wide variety of categories of funds due to the effectiveness of strategies.
Table #3: Top Black Box Funds 2.5 Years Sorted by Martin Ratio (Risk Adjusted Return)
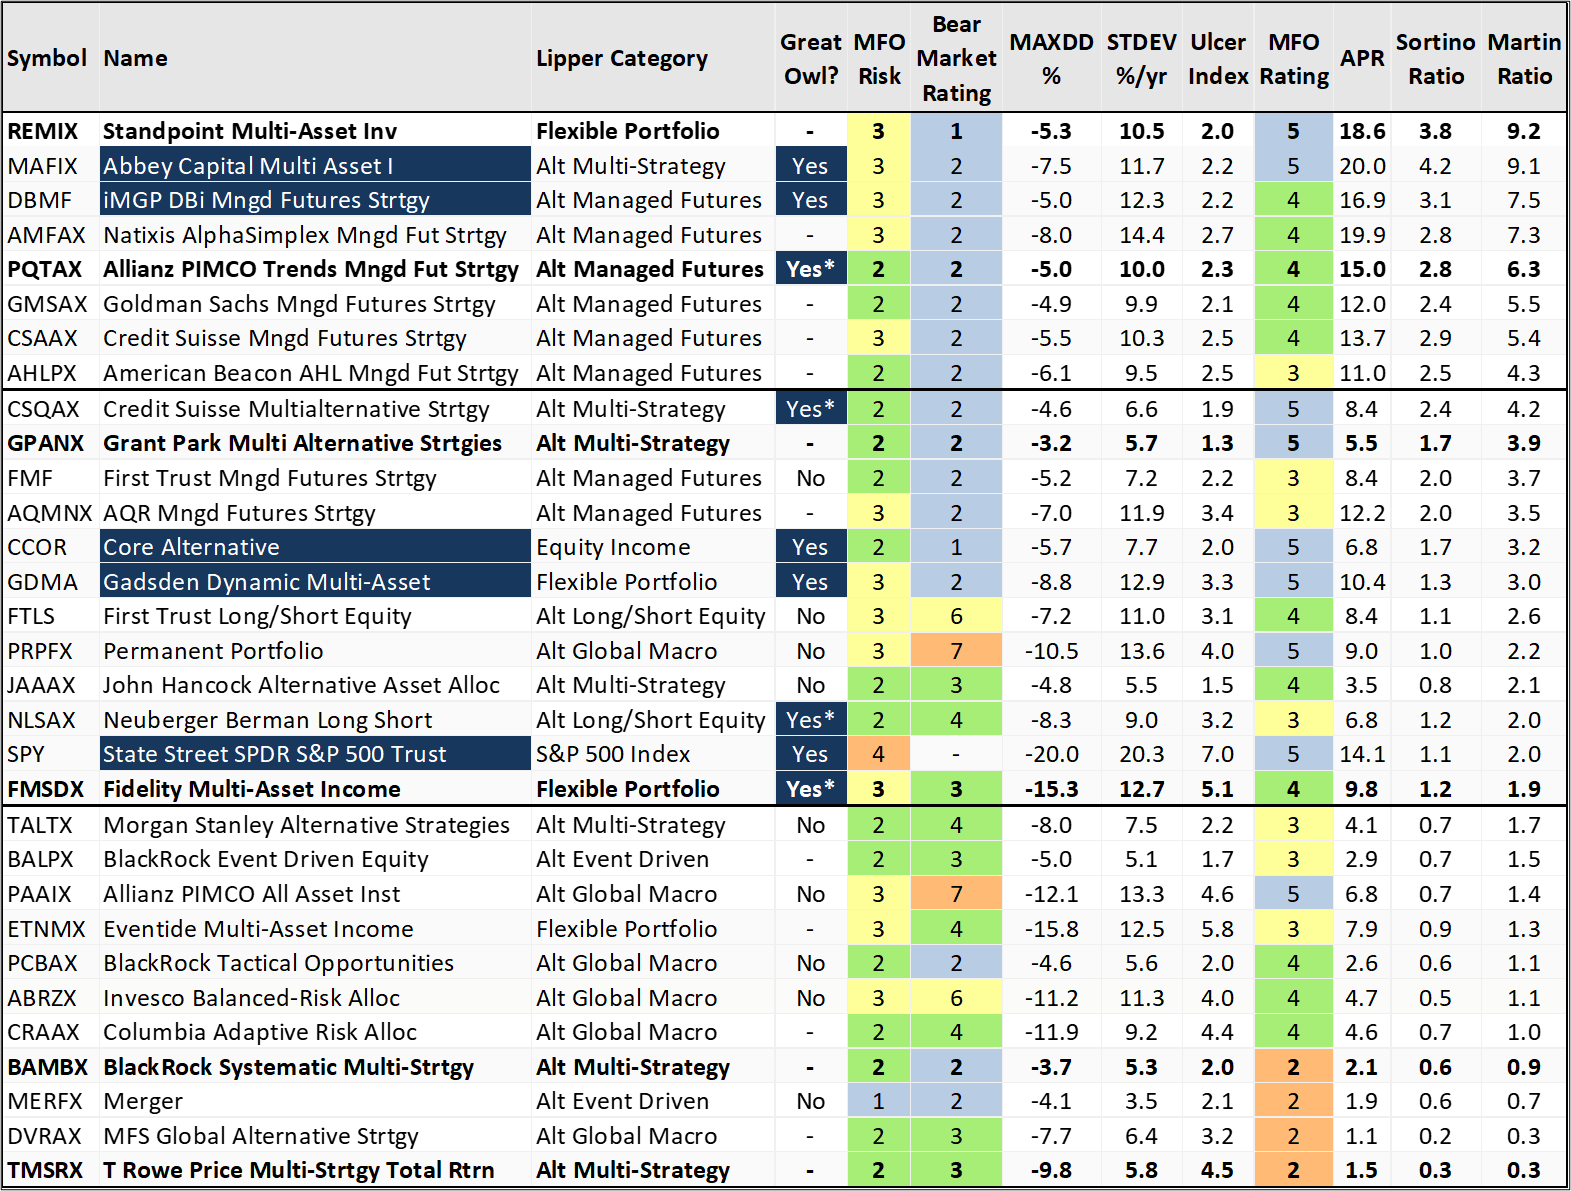
Source: Created by the Author Using the MFO Premium fund screener
The week ending September 16th covered a large down turn when markets reacted to higher-than-expected inflation reports. Table #4 shows performance during that week, along with year-to-date performance and percent below the 52-week high. The bold lines are the funds that I am invested in. Each helped to reduce the volatility in my portfolios. I don’t own any Alternative Global Macro Funds or Event Driven Funds. One of my criteria for buying a new fund is whether I expect them to outperform no risk, short-term treasuries over the next few months. Short-term treasuries and certificates of deposit are currently yielding around 4% or more.
Table #4: Black Box Funds – Week Ending September 16th, 2022 Sorted by One Week Performance
| Ticker | Name | Stock Industry/ Fund Category |
% Total Return 1 Week |
% Total Return 3 Month |
% Return YTD |
% Below 52-Week High |
| AMFAX | AlphaSimplex Mgd Futs Strgy | Systematic Trend | 1.9 | -2.6 | 39.0 | 4.6 |
| GMSAX | Goldman Sachs Mngd Futs Strgy | Systematic Trend | 1.6 | -2.9 | 20.5 | 4.2 |
| AHLPX | American Beacon Mgd Futs Strat | Systematic Trend | 1.5 | 1.5 | 16.8 | 0.0 |
| AQMNX | AQR Mngd Futures Strgy | Systematic Trend | 1.2 | 0.5 | 36.1 | 0.7 |
| CSAAX | Credit Suisse Mngd Futs Strgy | Systematic Trend | 1.2 | -0.2 | 22.7 | 1.4 |
| PQTAX | PIMCO TRENDS Mngd Fut Strgy | Systematic Trend | 1.0 | -6.0 | 15.8 | 8.9 |
| GDMA | Alpha Architect Gdsdn Dynmc Mlt-Asst | Alloc-50% to 70% Eq | 1.0 | -3.9 | -0.9 | 8.6 |
| CCOR | Core Alternative | Options Trading | 0.7 | 6.9 | 2.8 | 5.2 |
| DBMF | iMGP DBi Mngd Futures Strategy | Systematic Trend | 0.4 | 0.9 | 27.6 | 1.9 |
| FMF | First Trust Mngd Future Strategy | Systematic Trend | 0.2 | -6.7 | 10.5 | 15.8 |
| TMSRX | T. Rowe Price Multi-Strat Ttl Ret | Multistrategy | 0.1 | -0.3 | -5.0 | 11.4 |
| CSQAX | Credit Suisse Multialt Strgy | Multistrategy | -0.2 | 4.6 | 3.0 | 6.7 |
| GPANX | Grant Park Multi Alternative Strats | Macro Trading | -0.3 | -1.2 | -0.5 | 12.3 |
| PCBAX | BlackRock Tactical Opportunities | Macro Trading | -0.3 | 1.7 | 0.1 | 1.3 |
| MERFX | The Merger Fund A | Event Driven | -0.4 | 3.5 | 0.2 | 0.6 |
| BALPX | BlackRock Event Driven Equity | Event Driven | -0.8 | 3.3 | -0.7 | 1.3 |
| MAFIX | Abbey Capital Multi Asset I | Multistrategy | -0.9 | 3.7 | 8.5 | 5.2 |
| TALTX | Morgan Stanley Pathway Alt Strats | Multistrategy | -0.9 | -0.4 | -2.5 | 4.3 |
| JAAAX | JHancock Alternative Asset Allc | Multistrategy | -1.3 | 0.8 | -3.4 | 5.6 |
| BAMBX | BlackRock Systematic Multi-Strat | Multistrategy | -1.3 | -1.3 | -4.7 | 7.9 |
| CRAAX | Columbia Adaptive Risk Allocation | Tactical Allocation | -1.4 | -0.2 | -13.3 | 27.6 |
| REMIX | Standpoint Multi-Asset Investor | Macro Trading | -1.5 | -3.7 | 4.0 | 5.8 |
| FMSDX | Fidelity® Multi-Asset Income | Alloc-50% to 70% Eq | -1.5 | 4.2 | -12.6 | 16.4 |
| DVRAX | MFS Global Alternative Strategy | Macro Trading | -1.9 | 1.7 | -6.9 | 7.6 |
| ABRZX | Invesco Balanced-Risk Allocation | Tactical Allocation | -2.0 | -3.5 | -13.4 | 32.4 |
| NLSAX | Neuberger Berman Long Short | Long-Short Equity | -2.5 | 2.4 | -7.1 | 8.7 |
| FTLS | First Trust Long/Short Equity | Long-Short Equity | -2.6 | 1.2 | -7.2 | 7.8 |
| PAAIX | PIMCO All Asset | Tactical Allocation | -2.6 | -0.9 | -12.6 | 18.3 |
| PRPFX | Permanent Portfolio | Alloc-50% to 70% Eq | -2.7 | -1.7 | -10.3 | 13.4 |
| ETNMX | Eventide Multi-Asset Income | Alloc-50% to 70% Eq | -3.1 | 3.6 | -14.9 | 19.9 |
| SPY | SPDR® S&P 500 Trust | Large Blend | -4.8 | 6.1 | -17.9 | 19.5 |
Source: Created by the Author Using Morningstar
Figure #4 shows the short-term performance of selected funds. My hesitance to add more alternative funds is that even though they have out performed the S&P 500 year to date, most have been trending down.
Figure #4: Performance of Selected Funds
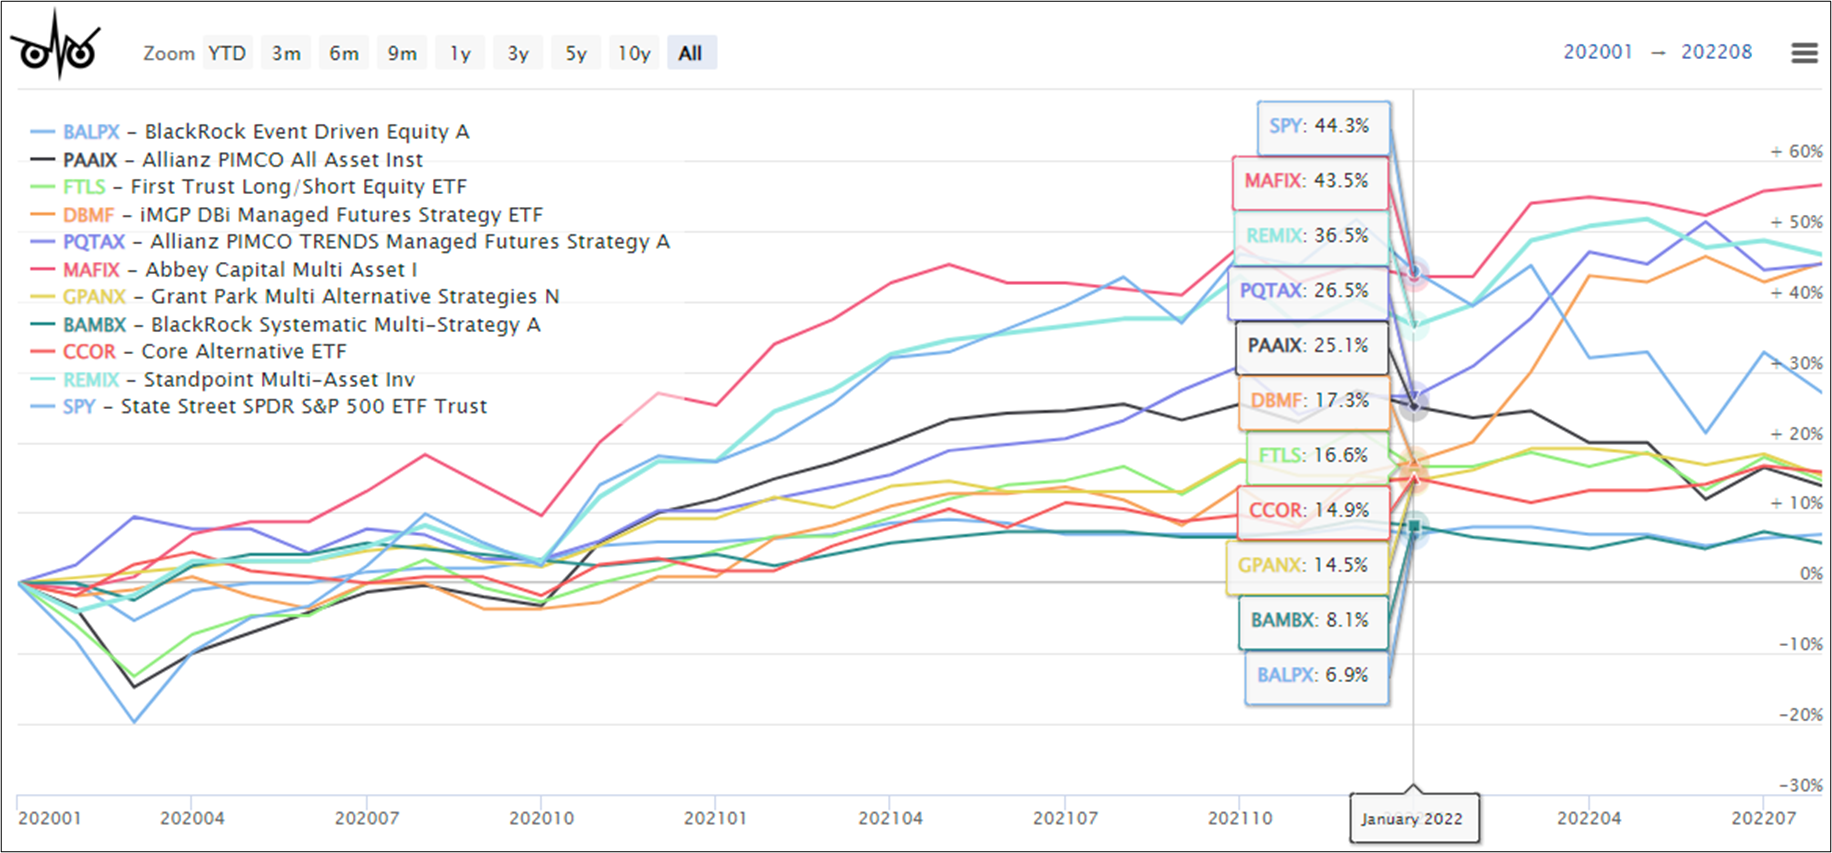
Source: Created by the Author Using the MFO Premium fund screener
Portfolio Visualizer Backtest
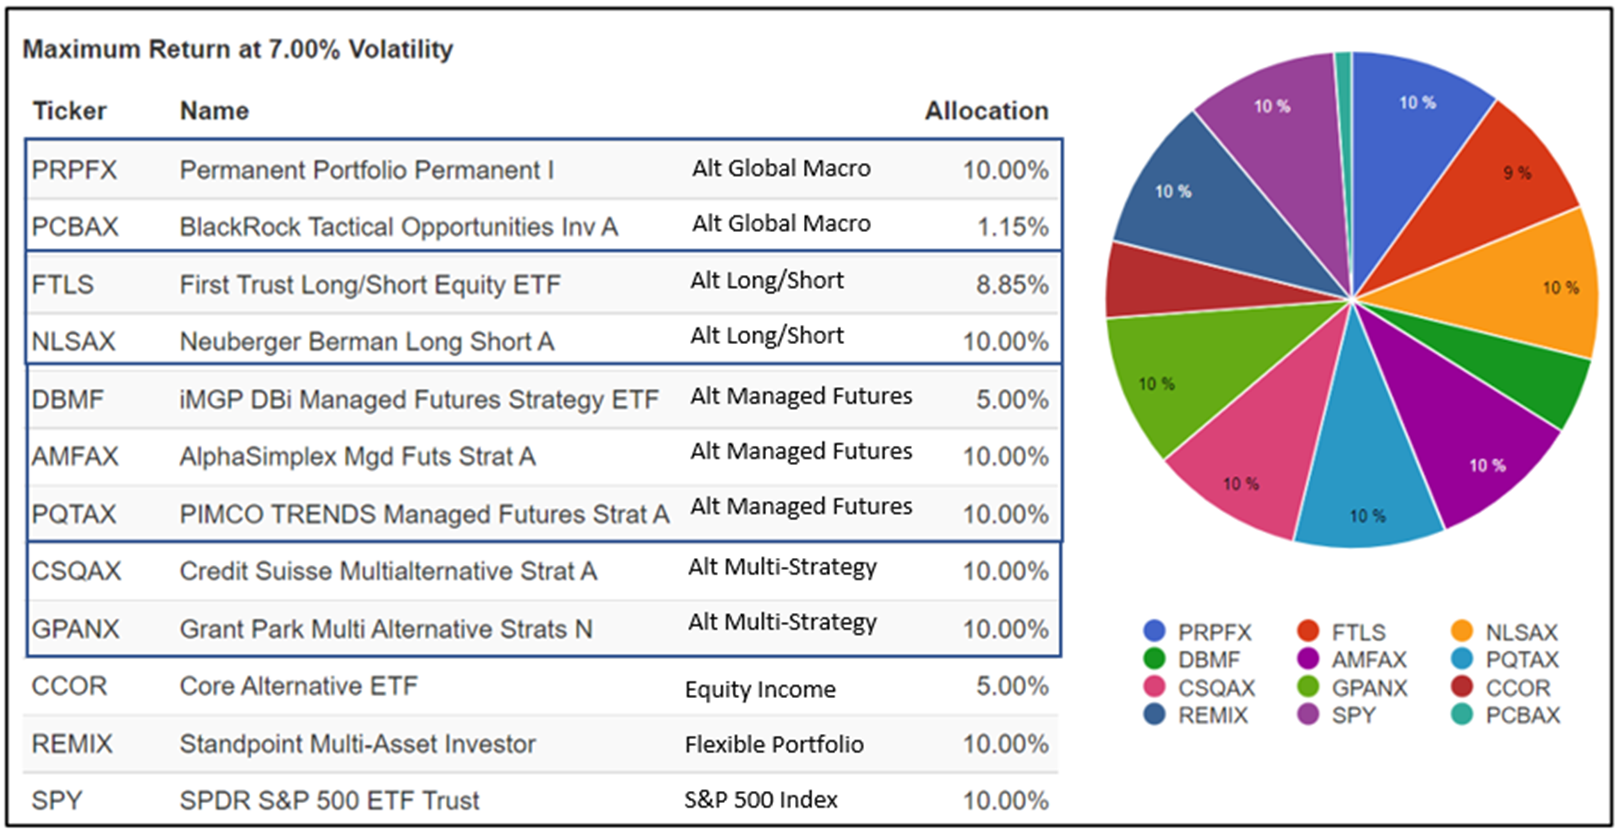
I ran Portfolio Visualizer Backtest to maximize return with seven percent volatility for a portfolio of twenty-five of the funds in this article including the S&P 500. I limited allocations to ten percent per fund and twenty five percent per Lipper Category. I would not invest this way; however, I learn which funds Portfolio Visualizer selects. The link to Portfolio Visualizer is provided here.
The Provided Portfolio was equally weighted. What I like about the “optimized” portfolio is the low draw down during the COVID-induced recession and this year. Keep in mind that interest rates will probably not be rising as rapidly over the next two years and the risk of a recession is rising for 2023.
Figure #5: Portfolio of Alternative Funds Performance
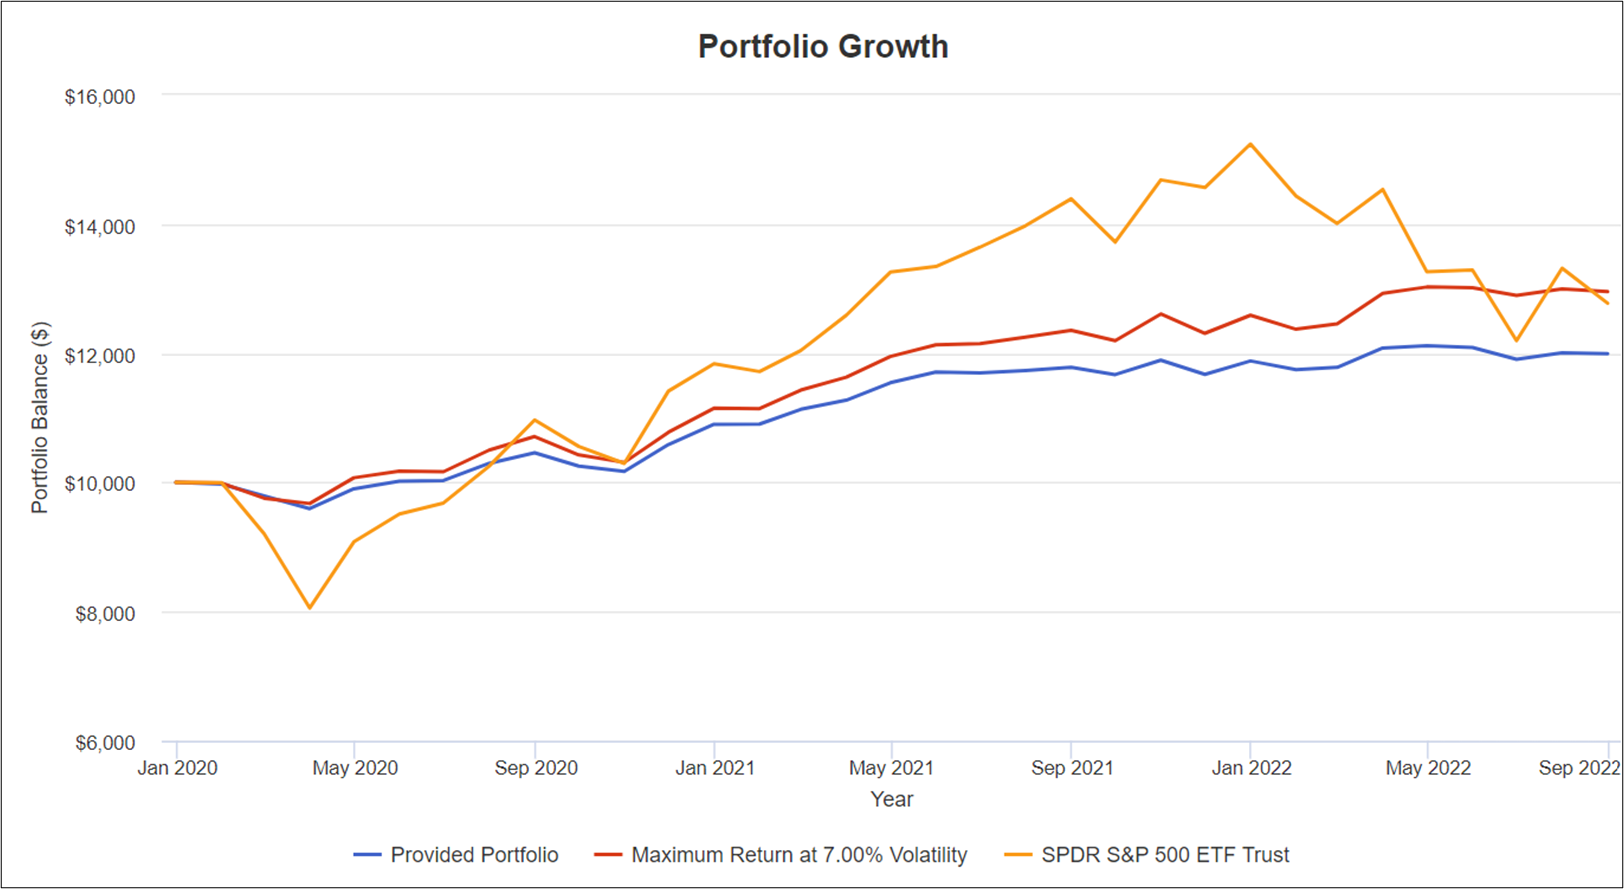
Source: Created by the Author Using Portfolio Visualizer
Table #5 contains the funds and allocation from Portfolio Visualizer.
Table #5: Allocations for Portfolio of Alternative Funds with 7% Volatility
Source: Created by the Author Using Portfolio Visualizer
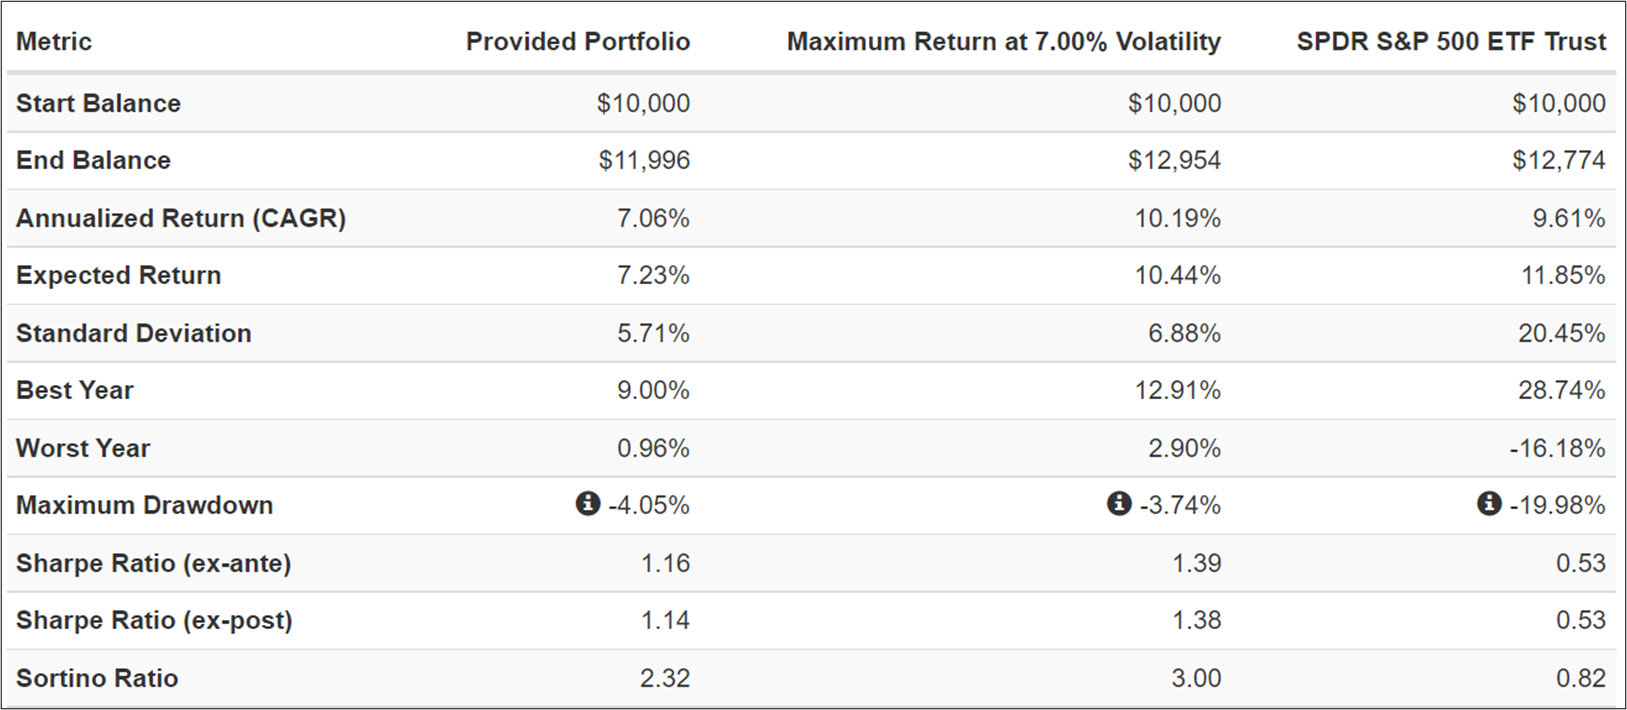
The results are that the above portfolio had similar returns to the S&P 500 with a drawdown of only 4% compared to 20% for the S&P 500.
Table #6: Portfolio Performance
Source: Created by the Author Using Portfolio Visualizer
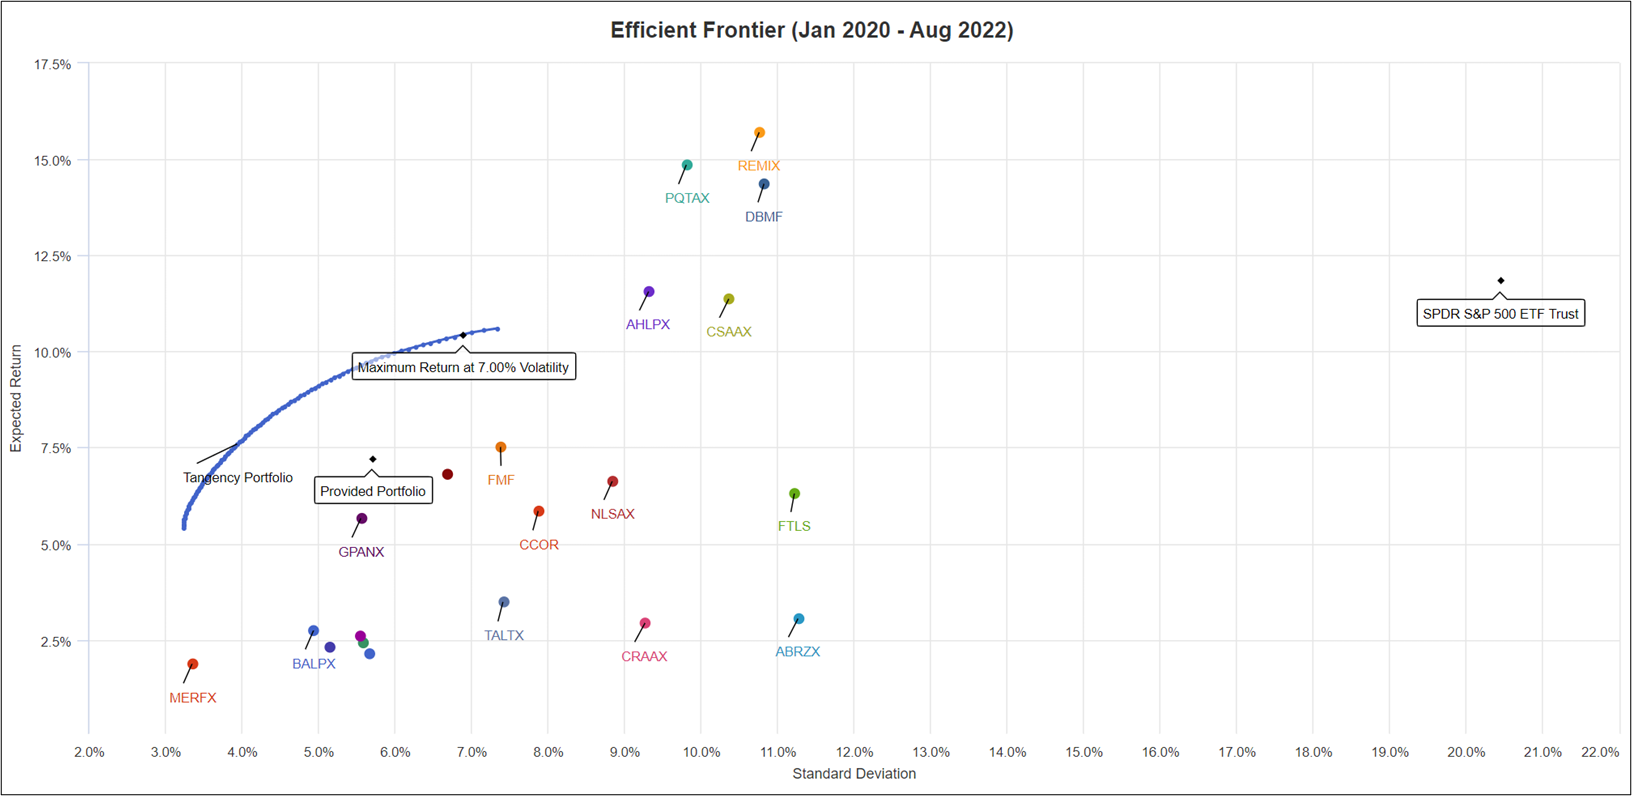
Figure #6 is the Efficient Frontier of the funds showing the return over nearly three years compared to volatility as measured by the standard deviation. Note that all are significantly less volatile than the S&P 500. AMFAX had higher returns than the scale of the Expected Return and is not shown in the figure.
Figure #6: Efficient Frontier of Alternative Funds
Source: Created by the Author Using Portfolio Visualizer
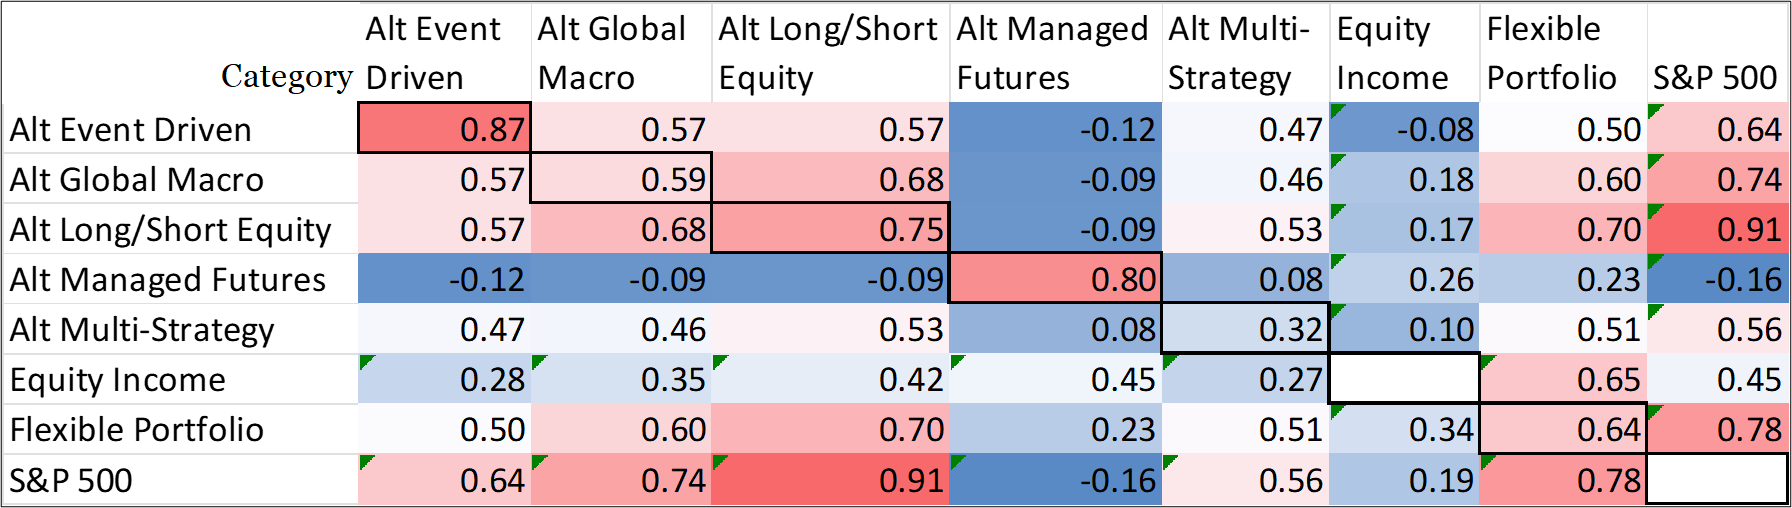
Table #7 shows the average correlation of the funds by Category. The dark outlines show the correlation of the funds against other funds in the same category. For example, the two Alternative Event Driven funds have a high correlation of 0.87 to each other while Alternative multi-strategy funds are less correlated (0.32) to each other. If investors are going to invest in Alternative Funds, they should diversify across funds and categories to reduce risk, and limit the total exposure according to their risk tolerance.
Table #7: Correlations – January 2020 to August 2022
Source: Created by the Author Using Portfolio Visualizer
Closing
For investors who dedicate a moderate amount of time to studying the markets, modest allocations to Black Box funds can reduce volatility and increase returns. One needs to have eyes wide open when buying some of these funds. Standpoint Multi-Asset Investor (REMIX) lost 5% in one day not too long ago, but has had good performance over the past year.
In the event of a recession, I expect a further decline of around 20%. As Liz Ann Sonders and Kevin Gordon pointed out earlier in this article, earnings may become negative. The Price to Earnings ratio is based on cyclical measures of earnings. Longer term valuations are still historically high.
I see short-term bond yields as being attractive compared to stocks. I continue to build ladders of short-term treasuries and rolling them over at higher rates. Rising rates are a headwind to stocks. Another possible headwind to some stocks is the new 1% tax introduced in the Inflation Reduction Act. Investors should also consider the tax efficiency of alternative funds. Multi-Strategy, Event-Driven, and Global Macro tend to be the least tax efficient. Flexible Portfolio and Equity Income tend to be more tax-efficient.
Recessions occur frequently and are to be expected, but not feared. Impacts can be reduced by preparing for them. Best wishes in these volatile times!