Monthly Archives: March 2022

March 1, 2022

By David Snowball

Dear friends,

It’s been that kind of year. Who would have guessed that I’d miss the quiet sanity of 2021?

It has been a lot like that, hasn’t it?

It has been a lot like that, hasn’t it?

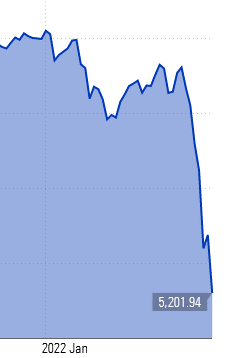
Here’s a snapshot of 2022 so far: 67% of NASDAQ and 30% of NYSE-listed stocks have suffered bear market declines (i.e., losses of more than 20%). Major indexes saw three-day swings of 10% or more – down 6% then up 8% in 72 hours. The VIX (hi, Devesh!) spiked by 50%. Inflation hit a 40-year high and oil hit $100 for the first time since 2014. Bitcoin, celebrated as “the new gold” because … well, actually I have no idea of what would cause people to think that, dropped 10% in value since January 1 but 50% since November. The case for gold is that its value is independent of the stock market and rises in value during times of turmoil; crypto is doing the opposite. Then, too, Vladimir Putin launched a war in Europe and the Voya Russia Fund (IIRFX) did this:

Some subset of investors used all of this volatility to justify their decision to double-down on their exposure to market risk. Reasoning that tech stocks surely couldn’t get any more beaten down (apparently these folks weren’t in the market in 2000) and the Fed surely wasn’t serious about rate increases given all the turmoil, they began repurchasing meme stocks and leveraged exposure to tech. The Wall Street Journal reported:

Individual and institutional investors jumped into the market. Of the $3.6 billion that investors poured into U.S. equity ETFs this week, around a fifth went to the ProShares UltraPro (TQQQ), which provides turbocharged exposure to the Nasdaq, FactSet data through Thursday show. (“Ukraine Crisis Upends Investing Playbook for 2022,” 2/27/2022)

That fund is, by the way, down 40% year to date.

My colleagues are probably more scarred and less blindly optimistic about how this all might play out. As you dive further into the issue, you’ll find:

Devesh Shah, the creator of the VIX, helps you understand how to survive drawdowns.

Lynn Bolin, whose drive is building purpose-built portfolios, walks through managing risk in a rising rate environment.

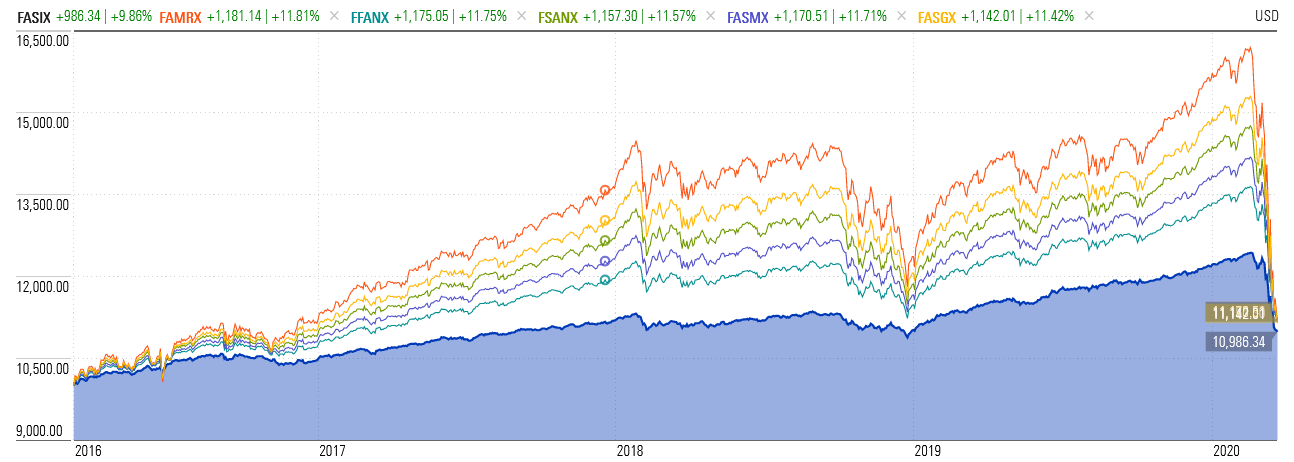
I offer an update of a 2021 article on the draw of a stock-light portfolio, looking at the risk and return profiles of Fidelity’s family of Asset Manager funds, through January 2022.

Mark Freeland, aware that April 15th (actually April 18th this year) is looming, walks investors through the maze of fund tax rules.

For visual learners, Charles previews the cool new MFO Premium charts function.

And The Shadow highlights industry news and developments – it’s starting to look like 25% of all mutual funds are thinking about becoming ETFs – that struck us as compelling.

Wars and rumors of wars

You will hear of wars and rumors of wars, but see to it that you are not alarmed. Such things must happen, but the end is still to come. Nation will rise against nation, and kingdom against kingdom. There will be famines and earthquakes in various places. All these are but the beginning of the birth pains. Matthew 24: 6-8

The Russian invasion of Ukraine might, in the long term, turn out to be a turning point. It might be the fatal miscalculation that unseats Vladimir Putin. It might unite Europe and revitalize NATO. It might shake American conservatives from their recent isolationism. It might move Sweden and Finland to increase military coordination with their European neighbors, encourage German leadership of the western alliance, or strengthen the hand of front-line countries facing Russia. It might cement a sense of national identity among the diverse ethnic groups in Ukraine. It might goof with your portfolio, or not. (Morningstar shared a list of bond funds with really substantial exposure to Russia.)

But in the short term, it is a vast human tragedy inflicted on small children, frightened parents, and worried elders. The United Nations reports 500,000 people made homeless in a week. Children, and children’s hospitals, have become collateral damage in Putin’s assault. These days will settle a weight on them that will never be fully lifted.

I was called upon, many years and rather too many wars ago, to read aloud part of Mark Twain’s “War Prayer” (1916). It was inspired, presumably, by a rising tide of support for US involvement in The Great War. A church filled with those about to go to war, and with their ebullient neighbors, confronts “an aged stranger [who] entered and moved with slow and noiseless step up the main aisle, his eyes fixed upon the minister, his long body clothed in a robe that reached to his feet, his head bare, his white hair descending in a frothy cataract to his shoulders.” He bore, he announced, a message “from Almighty God.” The message was that their pro-war prayers would be answered, as long as they affirmed the unspoken part of what their prayer entailed:

help us to wring the hearts of their unoffending widows with unavailing grief; help us to turn them out roofless with their little children to wander unfriended in the wastes of their desolated land in rags and hunger and thirst, sports of the sun flames in summer and the icy winds of winter, broken in spirit, worn with travail, imploring thee for the refuge of the grave and denied it—

For our sakes who adore Thee, Lord, blast their hopes, blight their lives, protract their bitter pilgrimage, make heavy their steps, water their way with their tears, stain the white snow with the blood of their wounded feet!

Twain’s passage ends, “It was believed afterward that the man was a lunatic because there was no sense in what he said.”

Those of us who have the luxury of worrying about how much it costs to fill our pick-ups and SUVs, or about the vicissitudes of the NFL off-season, should try to help lift as much of the weight from them as we can.

(New York Times photo)

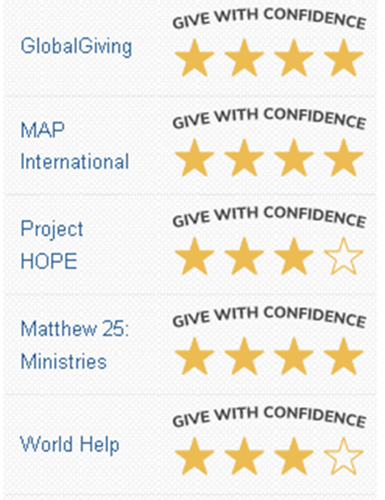
Please take a moment and give whatever assistance you can to the people of Ukraine. The UN Refugee Agency has helped rather more than 11 million displaced people over the years and accepts online donations. Charity Navigator highlights a handful of charities that strike them as responsible actors. I’m not sure who, among them, is “best.” My own conclusion was that giving money to good people right now is better than giving money to great people eventually. That led me to donate to the UN Refugee program and, through Charity Navigator, to Save the Children, Catholic Relief Services, and Global Giving’s Ukraine Crisis Relief fund.

It’s diversification, of a sort.

Meanwhile, other issues grind on

The magisterial IPCC Sixth Assessment report, released on February 28, 2022, provided the latest consensus on the “impacts, adaptation and vulnerability” of climate change. They concluded that “dangers of climate change are mounting so rapidly that they could soon overwhelm the ability of both nature and humanity to adapt” (“Climate Change Is Harming the Planet Faster Than We Can Adapt, U.N. Warns,” New York Times, 2/28/22).

As an investment matter, two questions arise. (1) Is it worth doing anything with my portfolio? And (2) if so, what?

Is it worth the effort?

The Wall Street Journal has a long-standing record of skepticism about sustainable investing. Their most sustained broadside came in a week-long series of articles by James Macintosh in January, decrying “the sustainable investment craze” (1/23/2022) and concluding “ESG investing can do good or can do well, but don’t expect both” (1/24/2022). Mr. Macintosh’s positions are that ESG funds are a marketing scam, they misdirect attention from essential political initiatives, and they necessarily sacrifice real investment gains in pursuit of illusory social goods. I’m particularly skeptical of articles where the conclusion predates the examination of the evidence, and this has been the Journal’s conclusion for a long time. The evidence appears to be more like, “well, yes, some funds are gimmicky and suck but that’s not an inherent characteristic of the group.”

Morningstar offered a clear and blessedly short response, Jon Hale’s “What The Wall Street Journal Missed About Sustainable Investing” (1/28/2022). Don Phillips, a managing director at Morningstar and former Alpha Dog, extends some of the arguments in “A Better Case for ESG” (2/11/2022). Here’s the synopsis: ESG investors, individual and professional alike, are neither stupid nor delusional. They know that this can only be a part of any effort to manage the effects of climate change, but it might well be an essential part because it supplies an essential and ongoing source of pressure on corporate decision-makers.

But where to invest?

There are at least two paths to consider. One is to invest in overtly ESG funds with a long performance record and clearly articulated discipline. A huge number of funds have only recently stapled the “ESG” designation to their operations, which often means the long-term records are meaningless and the quality of the ESG commitment is dubious.

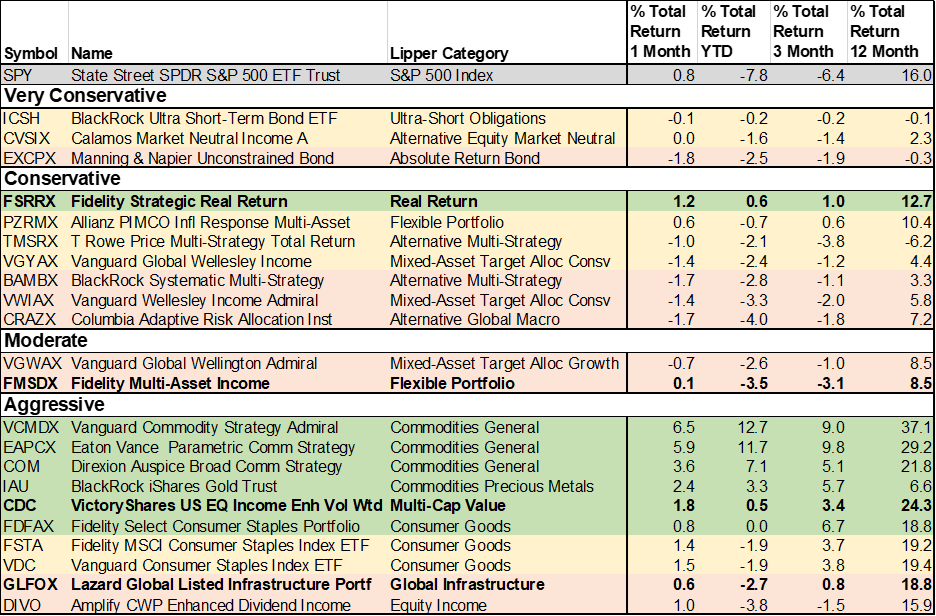
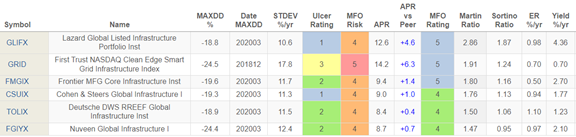
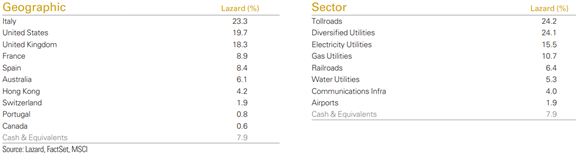
The second path is infrastructure funds. Those funds invest in the companies that are addressing the essential changes to our built environment, from power grids to water plants and seawalls. They provide an interesting complement to ESG funds because most, though not quite all, ESG funds invest in growth stocks while almost all infrastructure funds invest in value stocks.

In our April issue, we’ll use an interview with the managers of the First Sentier Investors American Listed Infrastructure Fund (FLIAX), a new institutional fund from a long-standing team, as a lens through which to look at the group.

“The team is still working on it”

Between December 1, 2021, and February 2022, 158 new open-end and exchange-traded funds were launched. Because of a perplexing glitch, Morningstar.com’s Premium Fund Screener says only 11 funds were launched in that period. We’ve been in conversation with Morningstar’s retail support and media teams, this year and last, who agree that it’s a problem. The status, as of February 28, 2022, is “the team is still working on the highlighted issue and we are yet to receive any update from them.” We’ll update you if the problem gets resolved.

The greater weakness is that the Morningstar screener, unlike the MFO Premium one, cannot simultaneously search mutual funds and ETFs. A separate ETF-only screener was fine in the days when ETFs were all passive funds and mostly insignificant ones, but the rising tide of fund-to-ETF conversions makes it clear that direct comparisons are essential. The good folks at Morningstar responded, most recently, “We have taken this as an enhancement and forwarded the same to the concerned team.”

Really, it’s not an optional change. The fund screener is nearly meaningless if its outputs aren’t integrated with the ETF screener. If you need that functionality and have $120, rather than a five-digit amount for a Morningstar Direct seat, I’d really recommend you look at the MFO Premium screener.

In memoriam

We note with sadness the passing of David W. James (1967-2022). Mr. James was the director of research at James Investment Research, a firm launched by his father Frank James, and a co-manager on all four of the James funds. Mr. James was engaged to be married and was, by all accounts, a good and loving person. His older brother, Barry, leads both the firm and the teams guiding the James funds. We wish them all peace.

Thanks, as ever!

Thanks to our faithful contributors this month: to the generous folks behind the Weeks Family Charitable Fund, Gardey Financial Advisors (welcome back, guys!), and the good folks at S&F Investment Advisors. And, most especially, to our subscribers: Gregory, William, Brian, David, William, Doug.

If you would like MFO to thrive in the year ahead, please support it … either financially or by reaching out to Devesh, Mark, Lynn, and Bill to let them know that you appreciate their dedication and are interested in their insights. You’d be surprised at how far a little encouragement goes!

On behalf of the folks at MFO,

david's signature

Overcoming Drawdowns

By Devesh Shah

My “Thoughts on Inflation Protection” essay, which appeared in MFO’s February 2022 issue, focused primarily on the role of different major asset classes in providing an inflation buffer for your portfolio. The article was focused in particular on the performance of funds and ETFs with substantial exposure to TIPS (Treasury Inflation-Protected Securities) and similar products. I highlighted the promise of short-duration TIPS funds.

In passing, I also noted the long-term potential role of domestic stocks and Equity REITS in protecting against inflation, while mentioning their two main drawbacks. One, they do not respond well to inflation in the short-term; and two, they act poorly in severe market drawdowns. This past month, Feb 2022, was a timely demonstration of the above reasoning.  

I mentioned that “part of an asset’s job is to help protect the portfolio during a financial catastrophe. Risky assets – Equity, REITs, and Stocks – while great for participating in long-term growth, are not good at capital preservation in tough market conditions. To prove the point, I pointed to a one-month drawdown endured by the Vanguard REIT Fund during the Covid-19 pandemic of Feb/March 2020.

A Reader Challenges

That prompted a challenge from a thoughtful reader who has considerable expertise in the fund industry. A lively exchange of views occurred, driven in part by different takes on how long a drawdown must last in order to be of material concern. (Would a 50% decline in your portfolio that lasted two weeks be “better” than a 25% decline that resolved in two months?) That’s a question worth pursuing.

This is a two-part question:

  1. Easy part: the calculations
  2. Difficult part: why do the drawdowns matter and for whom?

Part 2 of this question is also a great opportunity to discuss one of the most difficult and imminent problems in investing:

  1. What is a drawdown?
  2. How should we define it? How do most investors experience drawdowns? and
  3. How do successful investors practically and psychologically deal with drawdowns?

Calculating Drawdowns

First, let’s look at the calculations. I have picked some dates around the start of the Covid-19 Pandemic as it relates to my comments on Equity REITs in the TIPS article. As a proxy for the Vanguard Real Estate fund, I have chosen the Vanguard Real Estate ETF (VNQ, a fund I own and like).

As we can see from the price history in Column B, 2020 was a very volatile year for VNQ. Starting the year around ~93, the fund rallied in late February ’19 to around $99. Just about 4- weeks later, it crashed and experienced a closing low of ~ $57. The return between those 2 dates is ~ negative 42%. This is the return I had in mind and quoted when I wrote the article.

The reader pointed out, also correctly, that the calendar monthly returns in Feb ’20 and March ’20 were negative 7% and negative 20% respectively. Therefore, claiming that fund had a “1- month” return of negative 42% is incorrect. He pointed out that only a trader, not an investor, would call Peak to Trough using a 4-week intra-month period as a drawdown.

According to Investopedia, a drawdown is a peak-to-trough decline during a specific period for an investment, trading account, or fund. Since each investor has their own definition of a specific period, there can be multiple right answers for defining drawdowns. VNQ’s 2020 drawdowns can be:

Is any of these drawdowns more legitimate than the others? Very quickly, we can divine that the right drawdown answer lies in the eyes of the beholder. When the market moves as much as it did in 2020, a lot of common definitions and reference points we take for granted no longer work. The market is made up of many investors, each of whom may look at the world differently.

Why do drawdowns matter, and for whom?

However, the more interesting question here is why should investors care about drawdown? Why is it important to discuss and learn from the drawdown in Equity REITs in the year 2020? When we ponder this question in-depth, we learn a lot about the process of investing. Let us now spend some time thinking about the more difficult drawdown questions.

In the field of investing, there are two principal regrets:

  1. when an asset goes up a lot, and we don’t own it
  2. when an asset goes down a lot, and we do own

The first regret is when we miss buying something that goes on to have a phenomenal rally. “We had a chance to buy Tesla at $30, but we didn’t. We missed buying Tesla!” would fall in this category. This loss is called opportunity loss. Investors think of how much money we could have made if we had pulled the trigger. No uninvested money is actually lost. People remember missed investments perhaps in a similar way to recalling a missed chance of falling in love with someone. There is no way of knowing how it would have worked out for us, but our mind likes to believe it would have been great. The human mind can almost always (eventually) rationalize missed opportunities as the role of destiny in life. Because investment opportunities keep arising, a smart person might perhaps be able to learn from past missed opportunities and act differently in the future.

The second regret investors experience is when they have bought an asset and it goes down a lot in price. Everyone defines what “a lot” means differently. Every investor who has invested long enough has experienced sharp selloffs in their portfolio.

In general, when the price of an asset goes down more than 20-30%, that’s a proper drawdown! Investors in the asset feel it viscerally. It hurts to know that a deliberate decision made to buy XYZ, to own XYZ, has now resulted in a substantial reduction of the money we had once associated with XYZ. This feeling is different than opportunity loss. Drawdown-driven losses have the potential to overtake a person’s entire system. “I could have done this, I should have done that, I would have had this much more money…” are thoughts that fill the mind. Drawdowns can be traumatic and sometimes financially catastrophic. When such a drawdown occurs, investors have three choices. Sell the investment, buy more, or do nothing. Portfolio decisions made during such times are consequential to the long-term financial health of the investor.

It is far more common for individual stocks to experience large drawdowns than it is for entire major asset classes. Moreover, an individual stock has the potential for bankruptcy. When a stock halves, it is a very difficult moment for an investor. Will the stock be the next Lehman Brothers in 2008 or the next Amazon in 2002? Should the investor buy more, exit the stock, or do nothing. Precisely because security selection is so difficult, many seasoned investors who realize they have not the skill and don’t want to depend on luck, seek returns instead from asset allocation.

How do thoughtful investors structure portfolios to prepare for inevitable drawdowns?

Thoughtful investors choose to own a diversified basket of stocks to prevent the mental panics associated with occasional drawdowns in individual stocks or any one asset class. A major asset class, like the S&P 500 basket of stocks, can halve in price, but will not go bankrupt. In fact, both in 2003 and in 2009, the S&P 500 went down about 50% from peak to trough. Buying/owning the S&P 500 down 50% is a safer bet than buying any one stock down 50 percent.

Not only do these investors diversify within an asset class, but they also diversify across asset classes. By owning a combination of Risky and Riskless asset classes, experienced investors anticipate that drawdowns will unexpectedly occur, that not all drawdowns can be predicted in advance, but a system does exist to deal with eventual drawdowns. Having Riskless assets provides a buffer zone in sharp selloffs. By then selling Riskless assets and buying Risky assets, investors can rebalance portfolios: buy low and sell high.

Drawdowns are inevitable and painful for all investors. But using a combination of major asset classes, asset allocation, and portfolio rebalancing, we can harness the same drawdowns and capitalize on them.

A Simple Risky/Riskless Portfolio

Here is an example of a portfolio with a starting value of $100 split 70/30 between Risky (Stocks) and Riskless assets (short-term T-Bills). In this example, after a 30% drawdown in Risky assets and a 2% increase in Riskless assets, the investor is left with $80. Bad, but not catastrophic. She then decides to Rebalance back to the 70/30 weights. This requires buying the Risky Asset which has suffered the drawdown – the “Buy low” part.

Luckily for her, the drawdown ends, the market turns around, and Risky assets go on to rise 100% in price over the next few years. Riskless assets sell off 2%. How does the portfolio do?

She can rebalance once again here and execute the “Sell High” part.

What if she had not rebalanced the portfolio during the drawdown?

Thus, we see that rebalancing the portfolio added an incremental $7 of value to her portfolio compared to not rebalancing.

Practical Aspects of Rebalancing Portfolios

Drawdowns can be painful, but they can be useful to rebalance. Yet, one must pose the deeper question: how do I know when a meaningful drawdown has occurred and that I should practice rebalancing? It requires looking at the portfolio periodically, calculating percentage weights of asset classes in the portfolio, and executing trades to actually rebalance.

Those who buy and never look at their portfolio face a similar situation to the philosophical experiment – If a tree falls in a forest and no one is around to hear it, does it make a sound? I recently learned that my mother-in-law is holding stocks her husband bought in the 1960s!

The practical reality is that most people do look at their portfolios with some regularity. Some investors hire professional wealth managers to manage portfolios. Other investors are hands-on and like to manage their own portfolios. The nature of the investor and how closely she manages her portfolio drives the frequency of market observation.

That observation frequency in turn allows you to divine if the VNQ had a 42% drawdown in Feb- March 2020 or a 20% selloff in the month of March 2020. The magnitude of your perceived drawdown determines if and when you will rebalance your portfolio.

Month-end/Calendar Driven Rebalancing

Some investors choose a calendar-driven trigger, that is, month-end or quarter-end, to monitor the progress of the investment portfolio and to rebalance if the opportunity is available. With as little as four (quarterly) to twelve (monthly) observations in a year, they eschew the daily volatility of the market. The tendency of this group is to wisely let the dust settle before making substantial investment changes.

For those in the business of money management, it is important to lay out clear, systematic rules for employees, while simultaneously providing useful guidance to clients. Using calendar monthly returns for all investment decisions helps managers tell their investors, “In no calendar month were any of your funds down more than 20% in the year… As we have always maintained, we will only rebalance at the end of every month.” This is a strong and discretion-free message. It offers business continuity and peace of mind for the investor. It is practically very useful.

The shortcoming of the monthly rebalancing system is it most likely will miss rich intra-month opportunities to rebalance by buying Risky assets at attractive levels. For example, the VNQ made a low of ~ $57 on March 23rd, 2020. By March 31st, 2020, the VNQ had rallied 23% to ~ $70. Month-end portfolio watchers did not fret the intra-month lows, but they also missed an opportunity to buy cheaply.

Flexible Rebalancing

Since the 2007 housing crisis, we have seen that markets have been prone to increasingly extreme moves. This volatility makes more frequent rebalancing rewarding for some investors. Investors who choose to look at the market with daily frequency may still believe in the strategic power of long-term asset allocation, but they also want to take advantage if the market has overreacted in the near term.

As the far more eloquent Lady Gaga has said, “I want your ugly, I want your disease.” These investors closely monitor and often rebalance their portfolios in months with extraordinary volatility.

While calendar-based rebalancers have the convenience of dates to reallocate between assets, daily market observers get no such respite. They need other tools. One tool such investors can use is to rebalance at every 10% selloff in the Risky asset. In an extreme case, when peak to trough asset drawdowns start to approach the worst-case scenario for a major asset, such levels can be used to reallocate aggressively (as much as one’s risk appetite will allow). The date of the month is immaterial. All investors have a higher rate of success when they stick to a system that best fits their natural tendencies. The daily market observer must be careful not to overtrade.

What is the psychological importance of rebalancing during severe drawdowns?

Firstly, let us remember that to make money in investing, we must be greedy when others are fearful. The person selling VNQ at $56 is probably the same person who bought it at $99. Their fear is our opportunity. But we can only take advantage of this opportunity if we act. Sitting around twiddling our thumbs ain’t gonna help. Rebalancing will.

Second, every investor gets psychologically destroyed in sharp drawdowns. Let us think: what can we do to raise our game in such depressing moments? We can think of the future and what we can do today that will be helpful in the future. Rebalancing, calculating new asset allocations, deciding what to buy, what to sell, and tax loss harvesting are activities that can use the portion of our brain that deals with analytical work. Slowly, our emotional state can step back, and our analytical self can take control. The magic starts happening when we start believing in ourselves again.

Today’s market and conclusion

The current market drawdown is as good a time as any for an opportunity to apply the gift of rebalancing. Year-to-Date the US Equities benchmark is down about 9% and US Equity REITs are down 11%. If anyone has any doubts, the year 2022 has made it clear that no investor knows what the future holds. Trying to rationalize and analyze economic and political events is nice, but what does it do for the portfolio? Meanwhile, using the drawdown opportunity to rebalance as appropriate is fully actionable, and can be an investor’s best friend. Work out a system that is right for you and stick to it.

In this article, I have tried to show that during highly volatile periods, definitions of drawdowns will differ. This is to be expected. Different investors design systems based on what works for them. It is not the definition of the drawdown that matters, it is what you do during the drawdown that can help your future financial self.

Drawdown metrics for the four Risky Major Asset Classes (Past 25-year window)

Drawdown metrics for the five highest returning funds of the past 25 years

 Twelve lowest-drawdown funds among those earning 5% APR for the past 25 years

Introducing MFO Charts

By Charles Boccadoro

We’ve just gone live with Interactive Charts on our premium site. The capability is a long time in coming and addresses an ongoing complaint (aaah … request) from David that the site should offer more than table-based screening tools, more specifically DataTables based. It does now.

The new charting tool provides performance plots of up to 12 funds. It resides in MultiSearch, the main tool on the premium site, and is accessed via the Analyze button. Pressing it reveals eight analysis tools: Chart, Compare, Correlate, Rolling, Trend, Ferguson, Calendar Year and Fixed Period Performance. Each of these analysis tools, which have all been introduced previously, can be run from any other.

We have our license with HighCharts to thank for the new tool.

Here’s the default chart view having selected State Street Sector ETFs from the MultiSearch Pre-Set Screen options:

Display period defaults to 3 years, but can be changed via the Zoom buttons and by using the navigation bar at bottom of the chart. If the youngest fund in the comparison is less than 3 years, the display period will be set to the age of that fund.

Plots are of total return, typically, shown in units of percentage, %, versus month ending calendar date, YYYYMM.

Use can export using the chart context bar in the upper right corner. You can print charts, download images in various formats, and view table values.

Here’s the full-screen view focused on that awful period in 2020 when CV-19 sent markets reeling (rhymes with current reaction to Ukraine invasion). Hovering the cursor on the chart will display return performance based on curser location.New charts can be created quickly from the Chart tool via the New Chart button. Click and then enter new symbols in the pop-up input box.

Similarly, below is an example of running the Compare tool from the Chart tool page via the Analyze button. The example shows just the Summary parameters, but the output includes more than 1000 metrics, as applicable. This feature is new; previously, Compare could only be run from MultiSearch.

Soon, users will be able to run new comparisons, charts, correlations and more just by entering symbols on the welcome page. This more streamlined user interface will better facilitate quick access to MFO fund risk and return metrics via mobile devices.

Please enjoy the new features.

Managing Risk During Normalization and Rising Rates

By Charles Lynn Bolin

Risk is defined as “the possibility of loss or injury” by the Merriam-Webster Dictionary and volatility as “a tendency to change quickly and unpredictably.”

Risk refers to the possibility of loss, which is outcome focused. Volatility refers to a quick, unpredictable change, which isn’t centered on the outcome. To be a good investor, a person must be able to differentiate between these. Volatility acts as noise, while risk is worth paying attention to.

The Difference Between Risk And Volatility, Investopedia, Judy Hulsey

I continue to expect a regime change from mid-cycle to late-cycle later this year and look for opportunities to reduce exposure to riskier assets from my current 55%. Fourth-quarter nominal gross domestic product is up 11.8% compared to a year ago with the consumer price index up 7.5% for a real (inflation-adjusted) gross domestic product of 5.6%. Inflation, valuations, geopolitical risks, and volatility are high. Normalizing of monetary policy (QE and rates) is likely to continue as planned, but perhaps at a slower pace.

This article looks at the recent trends in the two hundred quality funds that I track and a few that passed new screens looking for funds that may have higher risk-adjusted returns over the remainder of the year. A shift to defensive funds began late last year as consumer staples are down only 2% year to date compared to 7.8% for the S&P 500 and inflation protection funds such as commodities are up 10%. Technology, growth, and health care are down typically 10% to 13% year to date. Is it time to buy the dip or rotate to safety?

The model portfolios that I have written about on Mutual Fund Observer have lost 1.8% and 2.4% compared to the S&P 500 which has fallen 7.8% year to date. The portfolios are tilted to value, international, commodities, and funds that do well during the late stage of the business cycle such as consumer staples and utilities. In January, I sold a small amount of American New World Class (NWFFX) and in early February purchased more Parametric Commodity Strategic (EAPCX).

1. Top Performing Funds in 2022 (Ending February 25th)

Below are the top-performing funds for 2022 that I track, plus a few that passed recent screens. They are selected based on relatively low drawdown and volatility. The grouping is based loosely on the MFO Risk Ranking over multiple time periods. In the Very Conservative category, most bonds will not do well in a rising rate environment. The Conservative and Moderate categories are of the most interest to me for buying and holding in an environment such as this. I own all of these except PZRMX and BAMBX which I view favorably. TMSRX has underperformed BAMBX over the past year but is outperforming slightly year to date.

I use the Aggressive Category to find funds in the recovery stages of the business cycle and to be in the tactical sleeve of portfolios. The aggressive category currently holds mostly commodities and consumer staples. It also holds CDC and DIVO which I have owned, but do not currently own. CDC: Three Layers Of Portfolio Protection by the Sunday Investor is an interesting article describing how CDC outperforms on a risk-adjusted basis. One other fund that has piqued my interest is Lazard Global Listed Infrastructure (GLFOX) which I recently purchased to test the waters. I profile it later in this article.

Table #1: Top Performing Quality Funds – Ending Feb 25, 2022

Source: Morningstar

2. MFO Risk-Adjusted Returns and Trends

To look at recent trends I used Mutual Fund Observer Multi-Search for the Taper and Normalization Period from July 2021 to January 2022 sorted from highest two-month return ending January to lowest. The S&P500 (SPY) is included as a baseline fund. I like funds that have higher three and ten-month exponential moving averages (EMA), but also those that are trending higher compared to their EMAs. In other words, while I like all of the funds, I will favor increasing allocations (within reason) in the upper half of the table. I limit funds in the tactical sleeve to 25% of a portfolio while still maintaining diversity.

Table #2: Top Performing Quality Funds – Risk-Adjusted Returns and Trends (Jul 2021 -Jan 2022)

Source: MFO Premium database, Lipper Global Data Feed

3. Portfolio Optimization

Future returns are guaranteed to be different than past returns, but I still like to see how Portfolio Optimization (portfoliovisualizer.com) would construct a portfolio to Maximize Return at 8% Volatility (blue) and to Maximize the Sharpe Ratio (red). I compared these two portfolios to the Vanguard Balanced Index Fund (orange).

Figure #1: Portfolio Optimization: Feb 2021 to Feb 2022

Source: Portfolio Visualizer

The risk-adjusted return (Sortino Ratio), as well as the volatility-adjusted return (Sharpe Ratio) of the two “Optimized” portfolios, are favorable compared to the Vanguard Balanced Index Fund.

Table #3: Portfolio Performance

Source: Portfolio Visualizer

Table #4 contains the allocations to funds in both “Optimized” portfolios. Funds that have high allocations to both portfolios are an easier choice to own. Whether a fund is suitable for an investor that is higher in one portfolio and lower in the other depends upon an investor’s tolerance to risk as well as their outlook for 2022. I own VCMDX, FSRRX, CRAZX, GLFOX, FMSDX, VGWAX, VWIAX, VDC, and VGYAX. I like and am considering CDC and BAMBX.

Table #4: Portfolio Allocations

Source: Portfolio Visualizer

Figure #2 is a good visual representation of the returns of the funds versus standard deviation (volatility) for the past year. Standard deviation is the deviation from the mean which means that a fund that had a high return may also have had a high standard deviation and not necessarily large ups and downs. This is the case for CDC which had a return of 24% for the past twelve months.

Figure #2: Efficient Frontier (Return vs Volatility)

Source: Portfolio Visualizer

4. Finalist Funds

Finally, I looked at the drawdowns and graphs of returns to develop a final list of funds that I believe will do well on a risk-adjusted basis for 2022. I own all but CDC and BAMBX. The returns of these funds are dependent upon inflation, monetary policy, and geopolitical tensions. The Columbia Adaptive Risk Allocation Fund (CRAAX) is available at Fidelity.

Table #5: Finalist Funds: July 2021 – Jan 2022

Source: Portfolio Visualizer

5. Lazard Global Listed Infrastructure (GLFOX)

The Lazard Global Listed Infrastructure Portfolio seeks total return by investing in a select universe of “Preferred Infrastructure” companies. The team believes that these companies have the potential to achieve lower volatility returns that exceed inflation and that a portfolio of Preferred Infrastructure companies presents a potential diversification opportunity. The Portfolio may be a powerful complement to real assets, private equity infrastructure, and global equity allocations.

Lazard Global Listed Infrastructure Portfolio

While developing my watchlist of two hundred quality funds, I did not find an infrastructure fund that I believed had solid risk to reward performance. They were just too volatile. I only recently researched Lazard Global Listed Infrastructure (GLFOX), and it is available with no load or transaction fee at Fidelity. Table #6 contains the no-load Global Infrastructure Funds with the highest risk-adjusted returns over the past 10 years. GLFOX is the investor share class and is available through Fidelity. It has a relatively lower risk (MaxxDD, Ulcer Rating) compared to other Global Infrastructure funds, and a high risk-adjusted return (Martin Ratio, Sortino Ratio). Many investors will find the yield (4.36%) attractive.

Table #6: Top Performing Global Infrastructure Funds – Ten Years

Source: MFO Premium database, Lipper Global Data Feed

GLFOX is diversified across several countries and types of utilities.

Table #7: Lazard Global Listed Infrastructure Allocations

6. Short Term Bullish Funds

As I close out this article, I ran my ETF screen at Fidelity for ETFs with short-term bullish signals also using FactSet ratings of “A” or “B” and Morningstar Ratings of three or higher. I then used MFO to reduce the list to one or two per Lipper Category of three-year risk-adjusted-performance. Below are the short-term returns from Morningstar. The point of this exercise is that Consumer Defense is still making the list of short-term bullish funds. In addition, CDC continues to trend favorably. Finally, I have been considering buying a financial services fund and track Fidelity MSCI Financials ETF (FNCL) and Fidelity Dividend ETF for Rising Rates (FDRR) as possible defense against rising rates. Invesco S&P 500 Equal Weight Financials ETF (RYF) is another option to look at.

Table #8: Bullish ETFs With (Relatively) Higher YTD Returns

Source: Morningstar

Closing

Prior to the Russian action, investors were largely focused on high inflation and imminent rising interest rates. Now the focus has shifted to the attack’s expected impact on energy, global growth, inflation, and central bank actions….

Market corrections driven by wars and oil market disruptions have historically been sharp but short-lived. As ever, volatility creates an urge among investors to do something, but our guide continues to be to stay invested and focused on long-term goals

Investors Confront Volatility As Russia Invades Ukraine, Columbia Threadneedle Investments

The invasion of Ukraine by Russia is a tragic event for world peace and a terrible loss of lives. On this last day of February, the war is still escalating along with the world’s reactions to it. Talks to diffuse the situation are starting.

The markets were oversold in February before the invasion, as measured by the relative strength index (RSI), and the markets recovered slightly last week. Is it time to buy the dip? Capital preservation is more important to me than a small gain from a dip when so much is unknown. I continue to focus on reducing risk according to the business cycle, and short-term volatility can be used to time these adjustments.

The case for a stock-light portfolio, version 4.0

By David Snowball

Update from the MFO archive

“Stocks for the long-term!” goes the mantra. That chant has two meanings: (1) in the (very) long-term, no asset outperforms common stock. And (2) in any other term, stocks are too volatile to the trusted so if you’re going to buy them, be sure you’re doing it with a long time horizon.

Your financial adviser hates this article. They’ll explain that following a lower equity, lower volatility strategy will absolutely kill your long-term returns. Over 20 years, $1,000 earning 6% returns will grow to $3,200. Over the same time, $1,000 earning 12% will grow to $9,600. That’s vast. No argument.

Our argument is that if your investment horizon is not measured in decades, the risk-return calculus is vastly different. For a five-year horizon, for instance, the difference is a high certainty of $1300 (the equity-lite portfolio) and high uncertainty around a potential $1700 return (the equity-heavy portfolio).

My own non-retirement portfolio, everything outside the 403(b), embeds a healthy skepticism about stocks. The strategic asset allocation is always the same: 50% equity, 50% income. Equity is 50% here, 50% there, as well as 50% large and 50% small. Income tends to be the same: 50% short duration/cash-like substances, 50% riskier assets, 50% domestic, 50% international. It is, as a strategy, designed to plod steadily.

In the past, 2004, 2010, and 2014, we’re shared research from T. Rowe Price that illustrates the dramatic rise in risk that accompanies each increment of equity exposure. Below is the data from the most recent of those articles, which looks at 65 years of market history, from 1949 to 2013.

Performance of Various Portfolio Strategies

December 31, 1949, to December 31, 2013

  S&P
500 USD
80%
Stocks
20 Bonds
0 Cash
60%
Stocks
30 Bonds
10 Cash
40%
Stocks
40 Bonds
20 Cash
20%
Stocks
50 Bonds
30 Cash
Return for Best Year 52.6 41.3 30.5 22.5 22.0
Return for Worst Year -37.0 -28.7 -20.4 -11.5 -1.9
Average Annual Nominal Return 11.3 10.5 9.3 8.1 6.8
Number of Down Years 14 14 12 11 4
Average Loss (in Down Years) -12.5 -8.8 -6.4 -3.0 -0.9
Annualized Standard Deviation 17.6 14.0 10.5 7.3 4.8
Average Annual Real (Inflation-Adjusted) Return 7.7 6.8 5.7 4.5 3.2

T. Rowe Price, October 30, 2014. Used by permission.

Over those 65 years, periods that included devastating bear markets for both stocks and bonds, a stock-light portfolio returned 6.8% annually. That translates to receiving about 60% of the returns of an all-equity portfolio with about 25% of the volatility. Going from 20% stocks to 100% increases the chance of having a losing year by 350%, increases the average loss in down years by 1400%, and nearly quadruples volatility.

A fascinating real-world experiment in asset allocation points to the same conclusion. Fidelity Investments run a series of Asset Manager funds, run by the same team, which differ only in the degree of their exposure to the stock market. Asset Manager 20% has … well, 20% in stocks while Asset Manager 70% has 70% in stocks. Otherwise, the same strategy from the same manager.

The youngest of the funds in the Asset Manager series is 12 years old and the oldest is twice that. If we look at raw returns, we see a familiar and predictable pattern: more stock exposure, more total return.

Raw Returns, through January 2022

Fidelity Asset Manager 3 year 6 year 9 year 13 year 20 year 25 year
20% 6.1 5.3 4.3 5.9 4.9 5.2
30% 7.9 6.8 5.5 7.4
40% 9.6 8.1 6.6 8.5
50% 11 9.2 7.6 9.7 6.0 6.6
60% 12.4 10.4 8.5 10.7
70% 13.8 11.5 9.4 11.7 6.6 6.8
85% 15.8 13.3 10.8 13 7.4

In rough terms, increasing your equity exposure by 10% increases your annual returns by 1%. Over 13 years, the most stock-heavy fund returned 2.2 times what the most stock-light fund did.

The question is, how much risk are you taking for the sake of a 1% gain in returns? Are the additional returns a free lunch (that is, 1% more gain with less than 1% more pain) or are you being taken to the cleaners?

Here’s the data on risk and risk-adjusted returns:

Risks and return-return measures over the longest possible period, 13 years

Fidelity Asset Manager Maximum drawdown Standard deviation Capture ratio Sharpe ratio Martin ratio Ulcer Index
20% -6.2 4.3 1.4 1.3 5.3 1.0
30% -8.3 5.7 1.2 1.2 4.6 1.5
40% -10.2 7.1 1.1 1.1 4.0 2
50% -12.2 8.6 1.1 1.1 3.6 2.6
60% -14.2 10.1 0.99 1.0 3.3 3.1
70% -16.2 11.6 0.95 0.96 3.0 3.8
85% -19.2 13.8 0.91 0.91 2.7 4.7

Data through January 30, 2022

How do we read that table? First, the most stock-heavy fund earned 2.2x what you got with the most stock-light fund but that came at the price of tripling the maximum drawdown and volatility. All four risk-return measures – capture ratio, Sharpe ratio, Martin ratio (a sort of “Sharpe ratio for risk-conscious investors”), and Ulcer Index (“how much of an ulcer is this fund going to give you?” A metric computed from the depth and length of a fund’s worst drawdowns) – deteriorated steadily with the addition of equity exposure. Every little bit of added equity saw a worsening of the funds’ long-term performance.

Just looking at the current market cycle – the Covid bear market in the first quarter of 2020 and the insane gains that followed and the swoon in January 2022 that saw broad averages end 6% down – shows a similar pattern. The losses in the bear were 3.5 times as great in the stock-heavy fund though the returns were almost as great: 3.4 times. The highest capture ratio and the highest Martin ratio were held by the stock-light fund, while the highest Sharpe ratio came with a 30-40% exposure to equities.

Risks and return-return measures during Recent Rocket Ride

Fidelity Asset Manager 2020 meltdown 2020 melt up January 2022 Full cycle Capture ratio Sharpe ratio
20% -5.4 14.6 -2.1 7.1 1.3 0.88
30% -7.7 20.3 -2.6 9.5 1.2 0.90
40% -9.7 25.7 -3.1 11.5 1.2 0.91
50% -11.9 31.1 -3.6 13.2 1.1 0.88
60% -14.1 36.5 -4.0 14.7 1.1 0.85
70% -16.2 41.9 -4.3 16.0 1.1 0.82
85% -19.0 50.1 -5.0 18.3 1.1 0.81

What would have happened if you bought exactly five years ago, but were freaked out by the Covid bear? Oops. The blue field represents the five-year growth of FAM 20, each succeeding line is the performance of sibling fund with more stock exposure.

At the bear trough, all of the excess returns were effectively wiped out. FAM 20 sat at $11,000. FAM 85 at $11,200. In one 16-day stretch, the five-year gains of FAM 85 went from $16,200 to $11,200.

Bottom line

Valuations in the US stock market, measured by the Shiller 10-year CAPE ratio, are at their second-highest level in over 150 years and climbing. As we note in this month’s Publisher’s Letter, more and more investors are taking more and more rash, perhaps irrational, and sometimes almost-laughable, actions. Many pundits and others paid to convince you to buy stocks see the coming Biden Bull, most especially in sectors that might benefit from reopening and government spending on green infrastructure.

You should hope they’re right, and plan your investments around the possibility that they’re wrong. In general, that might mean dialing down your exposure to equities (a portfolio with 30% equities has, historically, returned 7% annually), shortening by a bit your bond portfolio duration, adding some strategic cash to your holdings – just in case you encounter a sudden, dramatic sale – and looking beyond recent winners and stocks beloved by the day-trading crowd.

There are no guarantees but, on average and over time, slow and steady wins, risk-conscious wins, quality wins, dividends win. You should, too.

Death, taxes and childbirth

By Mark Freeland

As we head into March, it will soon be spring. A young man’s fancy lightly turns to love, while young and not so young investors’ thoughts turn more solemnly to taxes. This seems like an appropriate time to look at one corner of taxation – curiosities of ordinary income dividends distributed by funds.

I’ve been told that some people find taxes numbingly dull and perplexing. Who could imagine? Just to help you target your attention, I’ll break this essay into five parts.

  1. Basics of fund taxation
  2. Taxes on Tax-Free Investments
  3. Taxes on Money Market Funds
  4. Taxes on Global and International Funds
  5. Tips on managing it all

The Basics: What Gets Taxed, When?

At first blush, ordinary income looks straightforward. Mutual funds are required by law to distribute 98% of the ordinary income they make (i.e., excluding capital gains – which are be taxed, but differently) or pay a penalty tax. Broadly speaking, that income is revenue less expenses.

Basic sources of revenue are interest from bonds (federal, municipal, corporate, etc.) and dividends (qualified and non-qualified) from stocks. Revenue can also come from a variety of other sources, such as fees for lending out securities to short-sellers.

Taxes on Tax-Free Investments

(‘cause you knew they’d find a way!)

We know that tax-exempt interest that a fund collects from municipal (muni) bonds is passed through as tax-exempt dividends to its shareholders. Also, that for state income tax purposes, only the fraction of the income that comes from in-state bonds (or bonds from U.S. territories including Puerto Rico, Guam, etc.) is state tax-exempt.

One needs to be alert here; a single state fund may not get 100% of its income from that state. Further, some states require a minimum percentage to be issued by the state, else none of the income is tax-exempt. For example, Minnesota doesn’t give you a break unless 95% or more of the income comes from Minnesota bonds.

If you invest through a brokerage, you may have to go to the fund family’s website to get the percentages for your funds. Fidelity, Vanguard, and T. Rowe Price all have good pages that provide this and other tax information about their funds, as do many other families. Some other families make it more difficult to find the information, but with some searching, the necessary figures can usually be found.

Similarly, interest derived from federal securities (e.g., Treasuries) is generally state tax exempt. As with muni funds, the exemption is limited to the fraction of the income derived from these securities. And as with muni funds, some states have a minimum threshold. California, Connecticut, and New York all require 50% of the portfolio to be invested in federal securities for any income to be treated as tax-exempt.

The Money Market Market

In the past few years, many prime money market funds have been converted to government money market funds, making much of their income state tax-exempt. With these funds yielding under ten basis points this has likely not been something investors have been concerned with. But with interest rates likely to go up soon, it is worth checking the fraction of a money market fund that is invested in government securities.

Some funds may meet the 50% threshold in some years but not others. Fidelity Government Money Market Fund (SPAXX) is one such fund. It met the threshold in 2018 but hasn’t since. Of note is that in 2021, 52.9% of the fund’s income came from government securities, but the fund still didn’t meet the 50% threshold. That is because the percentage pertains to the value of federal securities in the fund, not to how much interest those securities generate.

Taxes on Global and International Funds

Matters get more interesting when looking at foreign taxes. Mutual funds that invest abroad often pay taxes to foreign governments. Most funds treat these taxes the same way as they would treat other operating expenses such as brokerage fees. They count the taxes among their expenses and reduce net income accordingly. In much the same way, multinationals subtract their foreign taxes from revenue in calculating their net profits. Just what one would expect.

If a fund makes $11/share in net income before subtracting a $1 in foreign taxes, it nets $10/share, which it distributes in cash to its shareholders. That’s pretty straightforward. But some international funds perform a bit of accounting legerdemain. Instead of subtracting that $1 from their income, they pretend that they made $11 in income which they distribute to you. They also pretend that you, not the fund, are the one who pays that $1 in foreign taxes. So they pay you that dollar with one hand and take it back with the other, at least on paper. Your bottom line is the same: you receive $10 in cash.

Yet this has very different tax implications. The fund doesn’t get to deduct that $1 from its profits. That’s why it has to distribute $11 to you on paper. You on the other hand get credit, figuratively and literally, for having paid that $1 in foreign taxes.

In order for the fund to execute this sleight of hand, it must meet a threshold requirement. It is reminiscent of the 50% threshold some states impose before taxpayers may exclude federal interest received from mutual funds. Funds must have over 50% of their assets invested in foreign corporations to do this creative bookkeeping. In addition, they must also choose to do this.

Many global funds do not meet this threshold. Generally, even those that do chose not to pass the foreign tax credit through to their investors. For example, Vanguard Global Capital Cycles (VGPMX) had 68% of its assets invested in non-US equity at the end of 2021 according to Morningstar. But it’s not in Vanguard’s list of funds providing a foreign tax credit.

On the other hand, Grandeur Peak global funds, pass through foreign tax credits to their shareholders if they meet the threshold requirement. These funds are the exception that proves the rule. Grandeur Peak global funds tend to hold over two-thirds of their assets in foreign stock. Global funds typically hold under half and so are ineligible to pass through credits. This is an argument for investing in foreign funds rather than global funds, at least in taxable accounts where it makes a difference in taxes.

If you do get credit for having paid foreign taxes (box 7 on form 1040-DIV), you have a choice whether to take a dollar-for-dollar credit or a deduction. Generally, the credit is better. Suppose your 1099 shows that you paid $4 in foreign taxes and you are in the 25% tax bracket. The choice is whether to subtract $4 from the taxes you owe or to take a $4 deduction that only reduces your taxes by $1 (25% x $4).

That seems simple enough, but nothing with taxes is simple. If you’re paying say 10% of your income in federal tax (e.g., your taxable income is $50,000 and your tax bill is $5,000), then your foreign tax credit is limited to 10% of the foreign income that you made, typically from your fund investments. For tax wonks, this is similar to the limitation on tax credits that your home state will give you for income taxes you pay to another state. The good news is that any excess can be carried forward for ten years, or back one year. So it is likely that you will be able to use the full credit eventually.

If for some reason you can’t or don’t want to take the credit, you are allowed to deduct the foreign tax instead. Unfortunately, that is treated as an itemized deduction which may not help if you are taking the standard deduction rather than itemizing.

All of this discussion about foreign tax credits and foreign tax deductions may make it appear as though you lose if you keep foreign funds in a tax-sheltered account (e.g., IRA, 401(k)). While it is true that you lose the opportunity for a credit, the effect is as though you get a deduction, so all is not lost.

Go back to the example of a fund making $11/share and paying $1 in foreign taxes. In an IRA, you don’t care what the 1099-DIV says. All that matters in an IRA is the cold hard cash received. Your investment earned $10/share, and that’s the extent of your added tax liability. It’s the same as if you had received $11 on paper in a taxable account and taken a $1 deduction.

Tips for Managing Your Fund-Related Taxes

Though the machinations and tax rules may be complicated, dealing with them doesn’t have to be:

  1. Keep muni bond funds in taxable accounts; consider single state funds if you are in a high-income tax state.
  2. When holding government bond funds in taxable accounts, look at how your state treats the dividends, especially in California, Connecticut, and New York. Government money market funds may give a better after-tax return than prime funds because some of the income may be state tax-exempt.
  3. Consider foreign funds in preference to global funds for taxable accounts if the foreign funds are likely to pass through foreign tax credits. Keeping them in IRAs or investing in global funds still provides some benefit from the foreign taxes paid, just not as much.

Briefly Noted

By TheShadow

Updates

On February 17, the Securities and Exchange Commission charged James Velissaris, the former Chief Investment Officer and founder of Infinity Q Capital Management, with overvaluing assets by more than $1 billion while pocketing tens of millions of dollars in fees.

The SEC’s complaint alleges that, from at least 2017 through February 2021, Velissaris engaged in a fraudulent scheme to overvalue assets held by the Infinity Q Diversified Alpha mutual fund and the Infinity Q Volatility Alpha private fund

In February 2021, Velissaris was removed from his role with Infinity Q after SEC staff confronted the firm with information suggesting that Velissaris had been adjusting the third-party pricing model. Several days later, at Infinity Q’s request and to protect shareholders, the Commission issued an order to suspend redemptions of the mutual fund.

Morningstar’s John Rekenthaler weighed in with his answer to the question, “Worst. Fund. Ever?” Not to spoil the surprise, but Mr. R. does conclude:

“to my recollection, no other fund has so effectively combined marketing arrogance, high fees, investment inscrutability, and failed ethics. That it did so while possessing enough assets to cause real damage only adds to its tally.  For me, Infinity Q Diversified Alpha takes the prize.”

The return of Beini Zhou: Artisan Partners has in registration its International Explorer Fund. Management plans to invest in undervalued, primarily non-US small companies, with strong balance sheets and shareholder-oriented management teams. The fund will be co-managed by Beini Zhou and Anand Vasagiri. Mr. Zhou formerly managed the Matthews Asia Value Fund. In our profile of the fund, David Snowball reported

I’ve spoken twice, at length, with Mr. Zhou at the Morningstar Investment Conference. I talk with lots of managers each year. He is among the most impressive I’ve met in terms of clarity and precision of thought and expression. He was, at our last conversation, in the midst of taking courses on artificial intelligence and teaching himself a new programming language with the intent of designing a program that could scrape qualitative data, not just statistical data, from conference calls and other corporate documents.

In September 2020, two high-profile Matthews managers – Tiffany Hsiao and Beini Zhou – left with little notice and less explanation. They were subsequently revealed to be at Artisan. At the same time, Matthews liquidated the Value fund while claiming that the fund’s liquidation and Mr. Zhou’s departure were entirely unrelated events. I nodded.

This one’s worth watching. Expenses have not been stated at this time.

On February 3, Janus Henderson announced that it has made the strategic decision to sell its 97%-owned Quantitative Equities subsidiary, Intech Investment Management LLC (‘Intech’), to a consortium of Intech management and certain non-executive directors.

Briefly Noted

Active ETFs have officially reached the big time: Capital Group, the advisor to the $2.3 trillion American Funds family, has launched a suite of core active ETFs.

  • Capital Group Growth ETF (0.39% expense ratio)
  • Capital Group Core Equity ETF (0.33%)
  • Capital Group Dividend Value ETF (0.54%)
  • Capital Group International Focus Equity ETF (0.33%)
  • Capital Group Global Growth Equity ETF (0.47%)
  • Capital Group Core Plus Income ETF (0.34%).

On February 24, 2022, DFA launched three more active ETFs: Dimensional US Small Cap Value ETF, Dimensional US High Profitability ETF, and the Dimensional US Real Estate ETF —with expense ratios of 0.33%, 0.24%, and 0.22%, respectively. They anticipate seven more launches, including one more fund-to-ETF conversion, this year.

In stages between early April and early June, JPMorgan will be converting four more funds to ETFs: JPMorgan Inflation Managed Bond ETF, JPMorgan Market Expansion Enhanced Equity ETF, JPMorgan Realty Income ETF, and JPMorgan International Research Enhanced Equity ETF.

With the flagship ARK Innovation ETF (ARKK) down by 48% in the past year and four consecutive quarters of outflows, you might imagine that Cathie Woods would pause and focus on protecting the fortunes of her current investors. Or, alternately, she might choose to branch out into a new arena replete with high volatility, low liquidity investments. Which is to say, ARK Venture Fund is in the offing. The fund will be a leveraged, closed-end interval fund, which means that investors will not be able to withdraw their investments on demand. Between the February 3, 2022 announcement of this Venture Fund and the date of this writing, ARKK declined 18%, evaporating $2.1 billion of investor wealth.

DoubleLine is the latest fund advisor to locate to a “red” state. Founder Jeff Gundlach, who is on the record about the chance that the US might break into separate countries in the next six years, is relocating DoubleLine from California to Florida. He argues that California is ill-governed and over-taxed, making Florida a better business locale. It might be that DoubleLine’s star has peaked: over the past three years (through 2/26/2022), half of the DoubleLine funds have above-average performance and half are below average. The firm had about $4 billion in outflows in the past 12 months, about 5% of assets.

On February 1, Vanguard lowered its fees on seven of its actively managed funds and on one exchange-traded fund for the fiscal year ending September 30, 2021.  According to Vanguard’s press release, these reductions saved investors $4.4 million in savings.

    2020 fiscal year-end expense ratio 2021 fiscal year-end expense ratio Change (in basis points)
Vanguard Core Bond Fund Investor Shares VCORX 0.25% 0.20% -5
Vanguard Emerging Markets Bond Fund Admiral Shares VEGBX 0.45% 0.40% -5
Vanguard International Core Stock Fund Investor Shares VWICX 0.46% 0.45% -1
Vanguard International Core Stock Fund Admiral Shares VZICX 0.36% 0.35% -1
Vanguard Capital Opportunity Fund Investor Shares VHCOX 0.44% 0.43% -1
Vanguard Capital Opportunity Fund Admiral Shares VHCAX 0.37% 0.36% -1
Vanguard Short-Term Inflation-Protected Securities ETF VTIP 0.05% 0.04% -1

OLD WINE, NEW BOTTLES

AMG Managers CenterSquare Real Estate Fund is being reorganized into the Cromwell CenterSquare Real Estate Fund.  The Reorganization is expected to close on or about March 7, 2022.

Sterling Stratton Capital Small Cap Value Fund changed its name to Sterling Small Cap Value Fund on February 1, 2022.

The name “Stratton” was removed also from Sterling Capital Stratton Mid Cap Value Fund and Sterling Capital Stratton Real Estate Fund on February 1, 2022. The surviving funds are now named Sterling Mid Cap Relative Value Fund and Sterling Capital Real Estate Fund, respectively.

Sterling Capital Corporate Fund was rebranded into the Sterling Capital Long Duration Corporate Bond Fund on February 1, 2022.

CLOSINGS AND (RELATED INCONVENIENCES)

Invenomic Fund soft-closed to new investors on February 11, 2022. Poster/Contributor Dennis Baran noted that the closure was due to an influx of incoming monies due to the fund’s stellar performance.

OFF TO THE DUSTBIN OF HISTORY

Cambiar Global Equity Fund is to cease operations and liquidate on or about March 18, 2022.

MassMutual Select BlackRock Global Allocation Fund is to be liquidated on or about June 24, 2022.

PIMCO Global Bond Opportunities Fund (Unhedged) will be liquidated on or about June 17, 2022.

William Blair Bond Fund, William Blair Short Duration Bond Fund, and William Blair Ultra-Short Duration Bond Fund to liquidate all the shares of the Funds on or before April 15, 2022. The liquidations followed the disclosure that Ruta Ziverte, who joined William Blair as head of fixed income in 2019 and who co-managed all three, was leaving the firm.